BTC-----Buy around 119000, target 120000-1205000 areaTechnical analysis of BTC contract on July 28:
Today, the daily level of the large cycle closed with a small positive line yesterday, the K-line pattern continued to rise, the price was above the moving average, and the attached indicator was dead cross. The general trend of rising is still very obvious, but from the trend law, it is not a very strong trend at present. The trend of oscillating upward and range is highly likely. In this case, we must find a good rhythm for trading, keep short-term, and don’t be greedy, otherwise it is easy to have profit-taking problems; the short-term cycle hourly chart yesterday’s US market rose and then fell under pressure to correct the low position near the 118700 area. The current K-line pattern is continuous, and the price is at a high level. The attached indicator is golden cross and shrinking. In general, the trend is still strong and the retracement is relatively small. If we look at the continuation of the rise today, it is still the old rule. The retracement cannot be large and cannot break the intraday low.
Today’s BTC short-term contract trading strategy:
Trade in the 119000 area when retreating, stop loss in the 118500 area, target 120000 and break to the 120500 area;
BTCUSDT trade ideas

btcusdtbtc might form deep crab harmin pattern. so far our lower high is 120952 .until this level is breached we may go lower to 112 k area

ABC BTC LongCurrently in a Long position on btc, closed the short out in profit from previously posted short abc. Now in a great position from the start of the new ABC long as depicted on chart

BTC & ETH Structural Market Analysis🚀 Don’t forget to hit follow and smash the 🚀 button if you enjoy this analysis! 🚀
BTC & ETH Structural Market Analysis
⭕️Methodology:
• Dow Theory
• 1D: HWC
• 4H: MDC
• 1H: LWC
Market Outlook:
Yesterday's structural analysis remains valid for today, but let’s review the key levels again.
Today’s approach:
1️⃣ Wait for Total2 to react at 1.53 – if it breaks upward, we hold our positions.
2️⃣ Take profits quickly – if weakness is spotted in the trend, close positions without hesitation.
Note: There’s a chance of fake breakouts on long positions, but personally, I’m willing to take this risk. If TOTAL breaks its key resistance, we may see a strong rally.
Key Levels & Scenarios:
♦️ BTC ♦️
• Important levels: 115 and 120.
• A breakout of these levels will define bullish or bearish scenarios.
• Long trigger remains at 120.
♦️ BTC.D ♦️
• Bullish above 61.44 and 62.17 – bearish momentum in altcoins.
• Bearish below 60.83 and 60.42 – bullish rally in altcoins.
• If BTC dominance climbs, 62.74 is the limit where we stay bullish on BTC pairs. Beyond that, focus shifts fully to BTC itself.
• If BTC breaks 119,500 while dominance drops, it confirms holding or entering longs on altcoins.
♦️ TOTAL ♦️
• Still struggling with the 3.85 resistance level.
♦️ TOTAL2 ♦️
• Successfully broke 1.48, leading to the recent altcoin move.
• Next critical level: 1.55 – a breakout could trigger a strong altcoin rally.
♦️ USDT.D ♦️
• Breakdown of 4.22: keep positions open.
• Breakdown of 4.13: start of a new bullish trend in BTC & altcoins.
• Fake breakout around 4.13: expect range-bound movement between 4.13 – 4.37.
• If 4.37 breaks upward: expect corrections in BTC & altcoins.
♦️ ETH ♦️
• Weakness visible in ETH/USDT chart; candles are not giving strong signals.
• ADX oscillator suggests a sharp move is coming (direction TBD).
• If RSI climbs above 70 with current ADX conditions: expect a sharp bullish move.
🔥 If this analysis helps you, hit that follow & smash the 🚀 to support my updates! And share your comments 🔥
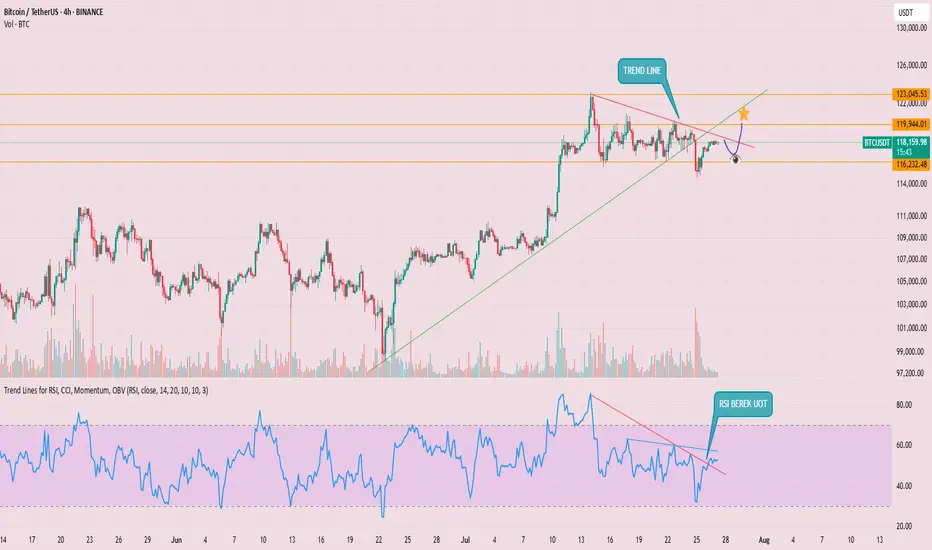
#BTC Update #10 – July 27, 2025#BTC Update #10 – July 27, 2025
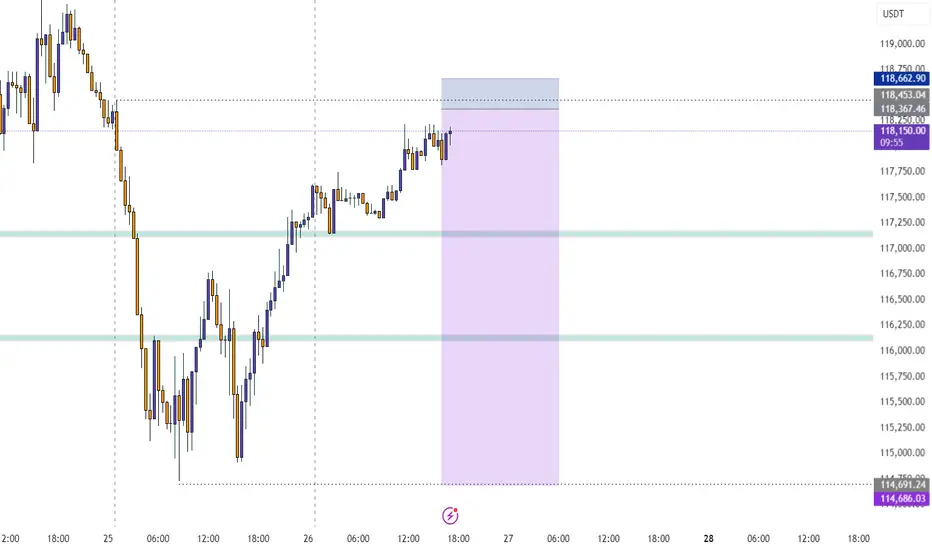
Bitcoin continues to move between $116,400 and $118,900, and staying within this range is actually a positive sign, even in bearish scenarios. A decisive close below $114,000, however, could open the door for a deeper and more prolonged correction.
Although BTC hasn’t broken to new highs yet, its ability to hold here means the trend isn’t broken. A strong breakout above $118,900 could lead to a rally toward $123,300 and possibly even $128,000.
🔹 On the 4H chart, BTC seems to have completed its minor correction.
🔹 On the daily chart, the correction remains incomplete – despite dipping to $114,700, the key $112,900 zone hasn’t been tested.
In lower timeframes, BTC remains squeezed within a symmetrical triangle. While it occasionally pokes out, it quickly returns inside — showing indecision.
📌 Direction is unclear at the moment. There’s no strong signal for Long or Short. Waiting for confirmation with volume and a clear breakout is the safer play.

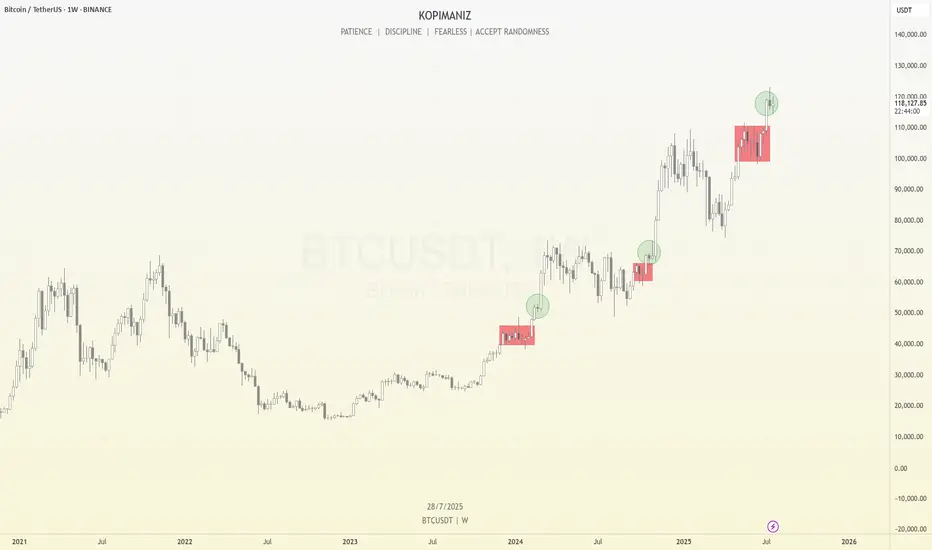
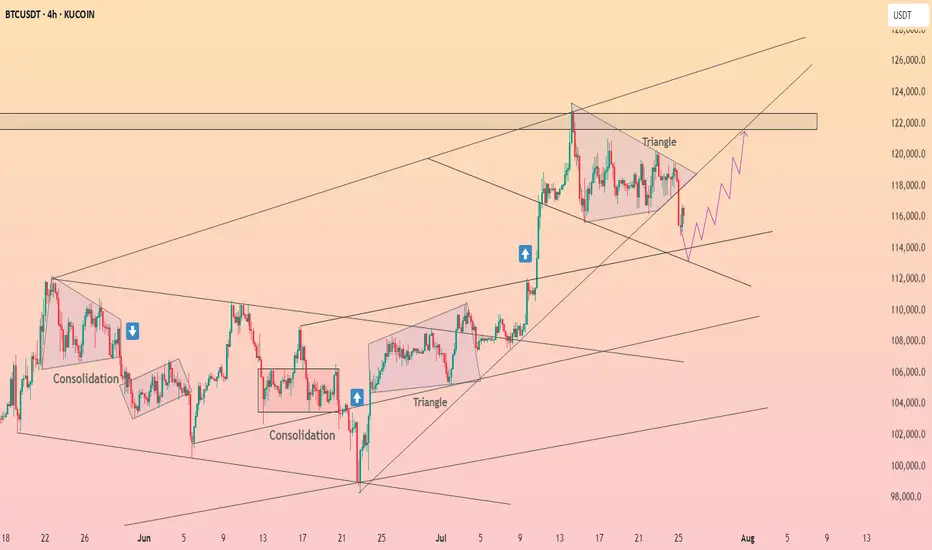
Bitcoin Weekly Structure: Repeating Rhythms and What’s Next
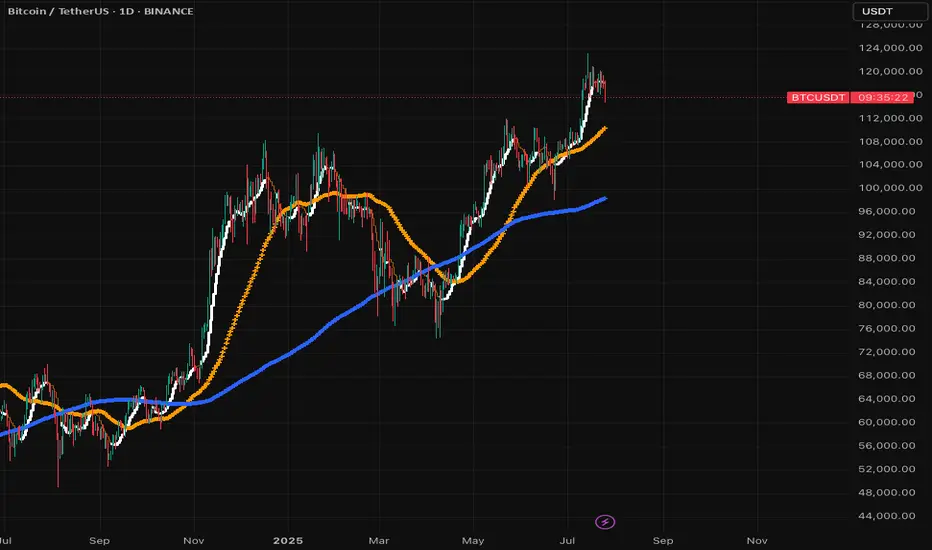
Bitcoin continues to follow a consistent structural rhythm on the weekly timeframe. We can observe that before every major breakout, price enters a multi-week consolidation phase, which I’ve marked using red boxes on the chart. These red box zones represent long periods of sideways movement, typically acting as reaccumulation phases. Once price breaks above these levels, it often results in a strong impulsive move, confirming that these areas serve as foundational support for trend continuation.
After each of these longer consolidations, Bitcoin tends to enter a brief 1–2 week consolidation right after the breakout, which I’ve marked with green circles. These short pauses are signs of healthy bullish momentum, often acting as flags or continuation patterns before the next leg up. What’s notable is that each of these green circle phases occurs after a clean breakout from a red box, and they consistently lead to further price appreciation.
Currently, Bitcoin has just broken out of another red box zone between ~$100k and ~$110k. Over the past two weeks, it has formed a small range near $118k, resembling the same green circle structures we’ve seen earlier in the trend. Given this recurring pattern, there’s a high probability that we are once again in the early stages of a bullish continuation. If the pattern plays out as it has in the past, the next move could be another strong weekly candle pushing toward new highs.
However, I’m paying close attention to the $125k–$126k level. This psychological zone may act as a major turning point. It could lead to either a prolonged consolidation phase that lasts for months, or potentially trigger a significant correction if the market faces strong resistance. This level marks a critical area where momentum may shift, so it deserves extra caution as we approach it.
This type of structural repetition helps me stay grounded in my analysis—focusing not just on price, but also on how long and where Bitcoin consolidates. So far, the rhythm has been clean and reliable.
Let’s see if Bitcoin respects the rhythm once again.
BTCUSD LONGIt's a long time to write and explain everything, just buy the level with the limit that is at ~117.550. You can count on a short-term rebound.
The one below the touchdown is not worth taking. I'll let you know if it works or not later.

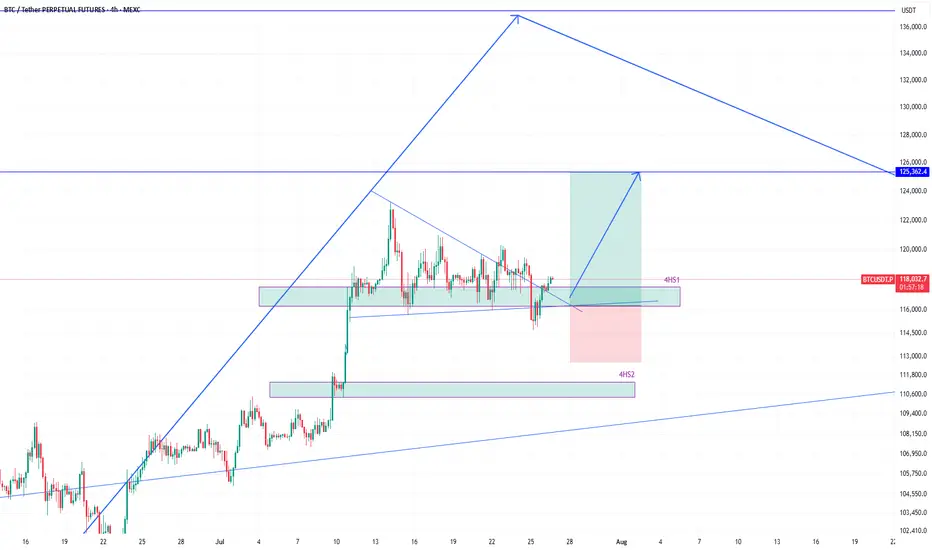
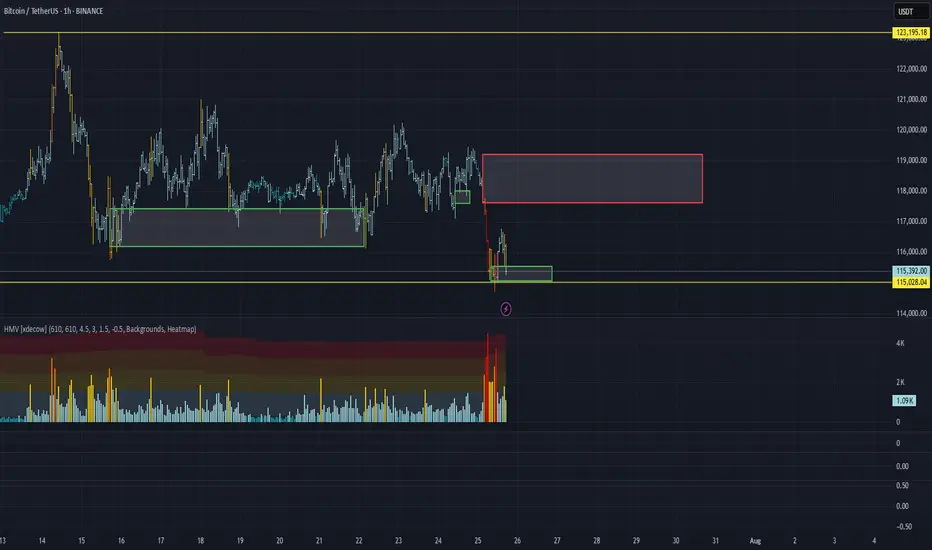
BTCUSDT eyeing 125k next after bounce from 116k zoneEarlier I shared the high time frame view of #BTCUSDT. We know that its heading higher and that helps in holding spot positions.
However, the move to the high frame target will not happen in a straight line, instead with various push to the upside and then subsequent corrections to the down side.
Therefore, as a trader, we must profit from those movements as we see some good high probability setups.
And there is one right now which is a long position.
The price broke 4h support 4HS1, but quickly reclaimed it. That is a sign of demand and strength required to move higher.
Therefore, this presents a long opportunity where the target of this long position should be 125k.
As the price enters into 4HS1 zone, I will scale into long position.
It is quite likely that the price will bounce hard once it taps into 4HS1 zone.
I am talking this long position targeting 125k. What about you? Share with me what you think.
SellRejection Level
Daily Volume
Market Structure Shift
London US Session
Trend Line Break
Untapped Order Point
Structural and Technical Analysis of Crypto + BTC + Altcoins + TStructural and Technical Analysis of Crypto + BTC + Altcoins + Totals + Dominance
🔔 Follow me & smash that rocket 🚀 if you find this useful! Let's ride the next wave together!
🕒 Timeframe: 4H
🧠 Strategy: Customized Dow Theory + Structural
---
🟡 A critical moment for the market:
Many coins, including top 10 alts, are currently sitting on major key levels. Yes, you can go long — but only IF volume supports the move.
📈 That means we must keep an eye on:
TOTAL, TOTAL2, TOTAL3
BTC.D, USDT.D
---
💎 Bullish Trigger Conditions:
✅ BTC.D must show strong red candles (dominance falling)
✅ USDT.D must break below 4.22-4.23 (money flowing out of stablecoins)
✅ TOTAL must break 3.85T
✅ TOTAL2 must break 1.48T
✅ TOTAL3 must break 1.05T
🔴 If all these confirm, it could be a great trigger to enter alt positions.
---
🔍 BTC Outlook
As previously mentioned:
🟥 If sellers want BTC below $115K, they need to break it fast and sharp — slow breakdowns won’t work due to buyer activity.
🟨 Bullish trend requires a break above $120K.
📊 Most likely scenario? Ranging between $115K - $120K
⚠️ BTC Dominance plays a key role here. If dominance drops while BTC ranges, alts could explode.
---
💸 USDT.D Critical Level:
A clean breakdown of 4.23 on USDT.D = 🚀 Funds rotating into alts
---
✅ Coins To Watch (Long Setup Only IF Above Conditions Hold):
♦️BNB
enter:741.00
Sl: 786.13
♦️ETH
enter:3750
Sl: 3480
♦️SUI
enter:4.10
Sl:3.40
♦️XRP
enter:3.25
Sl:2.92
♦️LINK
enter: 18.60
Sl: 17.4
♦️AAVE
enter:295
Sl:276
♦️ADA
enter:0.8405
Sl: 0.7628
♦️SOL
enter: 192.40
Sl:177
♦️DOGE
enter:0.249
Sl:0.220
🔁 Note: First SUI trigger was 3.80 — next key level is 4.10.
---
⚠️ Important Notes:
Today is Saturday, expect low volume
Manage risk ⚠️ and avoid aggressive Martingale strategies
High chance of fake breakouts
Levels being tested might just be lower highs in a bearish structure
❗️Even for bearish continuation, volume increase is key
---
🟢 If you liked this post, don’t forget to Follow & Hit the 🚀 Rocket to stay updated on live setups and strategic insights!
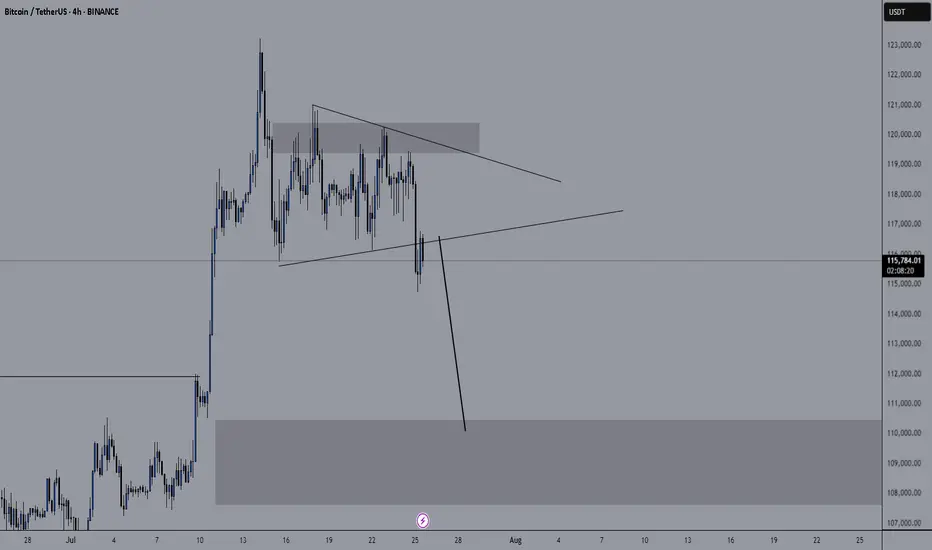
Fake Breakout at $116,522 Could Signal BTC Bull Continuation📈 Fake Breakout at $116,522 Could Signal BTC Bull Continuation — Watch Altcoin Triggers
After a fake breakdown below $116,522, Bitcoin is showing signs of resuming its uptrend.
A key bullish signal was yesterday's daily candle closing above this level — maintaining structure and giving bulls hope.
🔍 Current Strategy:
For BTC, I suggest watching $119,151 as a long trigger, only if BTC Dominance is rising.
If BTC.D isn’t rising, then it’s better to focus on altcoin long setups.
I’m still not opening any short positions — structure remains bullish, and risks of fake breakdowns remain high.
---
💬 Altseason loading? Drop your favorite alt setups in the comments!

Wyckoff ReaccumulationCurrent range looks like another reaccumulation range. Spring has just occurred and looking for a move back and then above the top of the range.
Bearish if we breakout then retrace forming an upthrust after distribution (UTAD).

BTCUSDT ready to march towards 140k zoneHere is once again a view of what I had shared when BTCUSDT was trading around 95k in may 2025.
The price action has been similar to our expectation. A push towards 106k-110k and then drop around 95k-98k before boucing towards 137k.
So the next stop for the current upward move is 137k. The push from 98k has brought us into 120k zone and currently we were holding in that range from 114k-120k for a while.
However, this is going to change now. I believe the last drop towards 114k was a false breakdown from 4h support 4HS1 since the price quickly grabbed this region again by moving towards 117k.
I believe the path to 137k-144k is clear now and we see that in coming weeks. After that we shall likely see a correction towards 120k area before move to the target around 150k.
Lets see how the price moves. We will keep monitoring it time to time and I will provide updates. But till now it has been moving according to the plan.
#BTC #BTCUSD #BTCUSDT #BITCOIN #CRYPTO CRYPTOCAP:BTC $crypto

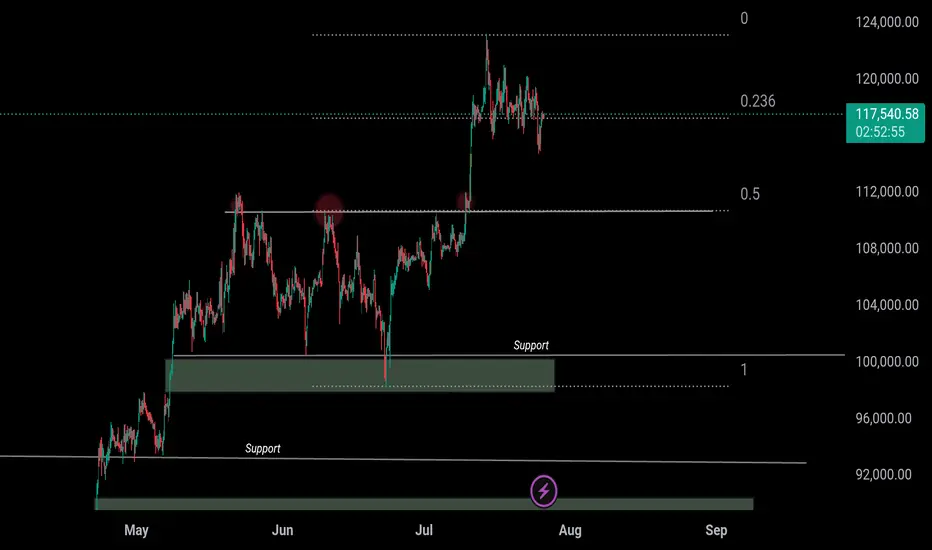
BTC 110k or 150k ??𝗪𝗶𝗹𝗹 CRYPTOCAP:BTC 𝗕𝗼𝘂𝗻𝗰𝗲 𝗮𝘁 $𝟭𝟭𝟬𝗞 𝗼𝗿 𝗖𝗿𝗮𝘀𝗵 𝗕𝗲𝗹𝗼𝘄 $𝟭𝟬𝟬𝗞? ‼️‼️
Breakout rallied from $110,500 → $123,293
Now pulling back toward 0.5 Fib retracement $110K
Retest Scenario:
– Hold above $110K = Bullish continuation toward $150K ATH
– Breakdown below $110K = Risk of deeper correction below $100K
Drop your thoughts below — bounce or breakdown?
CRYPTOCAP:BTC
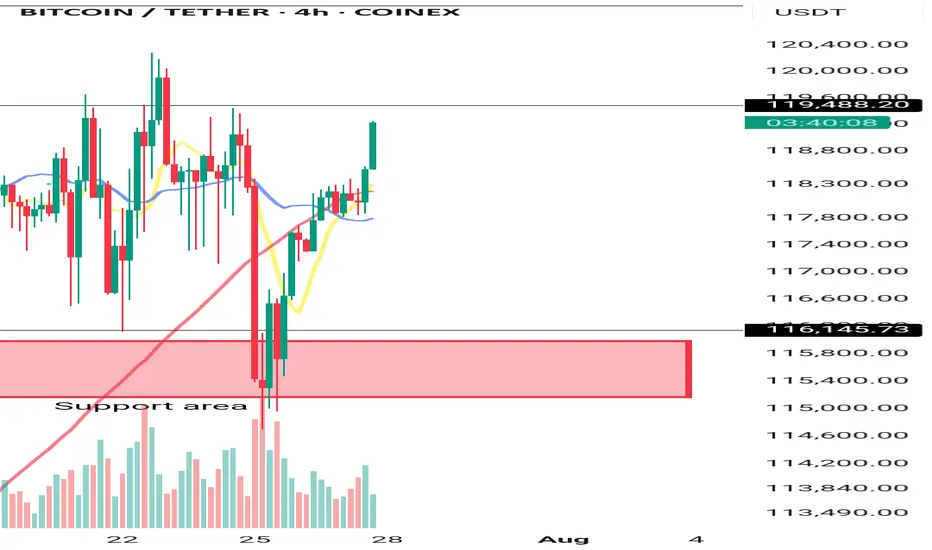
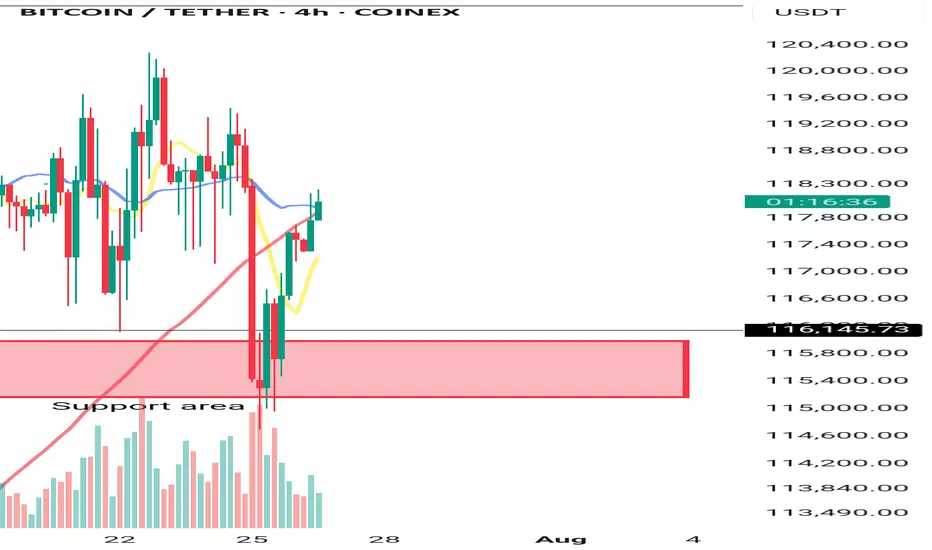
BTC Consolidates Below 119,300 Over the Weekend💎 BTC WEEKEND PLAN UPDATE (26/07)
NOTABLE BTC NEWS
The cryptocurrency market is attempting to stabilize after a wave of sell-offs during Friday’s Asian session, when Bitcoin (BTC) dropped to an intraday low of $114,723. A recovery trend is gradually strengthening, with BTC trading at $115,868 at the time of writing, indicating that buying interest at lower levels may increase in upcoming sessions.
TECHNICAL ANALYSIS PERSPECTIVE
Symmetrical Triangle Pattern
BTC is currently fluctuating within a symmetrical triangle pattern, with converging upper and lower trendlines. This pattern typically signals a strong consolidation phase before a decisive breakout.
Scenario unfolded as planned:
• The price failed to break the resistance zone around $120,000 (previously forecasted as a likely failed breakout zone).
• BTC then dropped sharply to the support zone around $115,000, touching the lower trendline and the potential breakout zone.
• At this level, the price rebounded as expected, indicating strong buying pressure at support.
MA lines supporting the trend:
• The price is currently moving around the 200-day MA (red line), showing that the dynamic support is working effectively.
• The 50-day MA (yellow line) is acting as short-term resistance. If broken, it could support the recovery momentum.
Two potential upcoming scenarios:
🔼 If BTC breaks above the $119,500 – $120,000 zone with strong volume, it may continue to test higher levels around $123,000 – $125,000.
🔽 Conversely, if it faces strong rejection around $119K and turns downward, BTC may retest the support zone at $114,000 – $115,000 once again.
Stay tuned to the channel for the latest and continuous updates on XAUUSD, CURRENCIES, and BTC.

BTCUSDT 6H#BTC is currently working on filling the CME Gap between $115,635 – $114,060 in the Futures chart, as previously mentioned. On the 6H spot chart, a falling wedge has formed, and there's a high probability of a retest of the wedge’s support line.
This support line lies within the support zone at $114,723 – $114,159, and the 6H SMA100 adds another layer of confluence. A dip into this zone is normal and not a cause for concern.
📌 In case of a bounce and breakout above the wedge resistance, the next upside targets are:
🎯 $119,505
🎯 $120,805
🎯 $122,461
However, if the support zone breaks, the potential downside targets will be:
🔻 $112,021
🔻 $108,977
📉 According to the liquidity map, there’s a cluster of liquidity around $114,000, and a brief wick below it is likely. Be cautious with your entries and exits.
⚠️ As always, use a tight stop-loss and apply proper risk management.

BTC/USDT Analysis. Range Breakout
Hello everyone! This is the daily analysis from a trader-analyst at CryptoRobotics.
Yesterday, Bitcoin bounced off a local sell zone on the 15-minute timeframe (previously mentioned), but a full-fledged bullish move did not follow. Instead, the less likely scenario played out — we broke the range to the downside and tested an important buy zone around ~$115,000 (zone of initiating volumes). Almost immediately, anomalies appeared in the cluster search near this level, and we quickly saw an initial rebound.
At the moment, a retest of ~$115,300 is likely. If buyers show proper reaction there, we could resume an upward move toward the $117,600–$119,200 area (accumulated volumes). To continue the long scenario toward the ATH, we need to consolidate within this area or break through it without a strong seller response — which is less likely.
A short scenario becomes possible if there is no buyer reaction around ~$115,300. In that case, a decline toward the next major support zone is expected.
Buy Zone:
$110,000–$107,000 (accumulated volumes)
Sell Zone:
$117,600–$119,200 (accumulated volumes)
This publication is not financial advice.
BTC dropping like a brick....bound to happen sooner or laterHard drops follow big spikes. Happens every time, just look back in time. But this time it's different? Maybe to some extent, but as long as there are short term profit takers and insane volatility this trend will continue. Only 2 cents is to not SHORT SELL. You will only contribute to the potential squeeze and will lose money. If you're up now, your priority should be to retain value and sell before it goes down to it's next support level which is under 100k! Maybe it does or not, but the dips do happen and with automated trading bots it could hit more aggressively and faster. If anything, but the dip when there's sufficient support. Best of luck!
Bitcoin is correcting ┆ HolderStatBINANCE:BTCUSDT compresses inside a triangle between $132K and $137K. Breakout above $137K could initiate a run toward $143K. Breakdown exposes $132K. Watch for decisive move.
Consider a sales transaction.Hello friends
You can open a sell trade on the 4-hour time frame, but this is a risky trade.
You can open a trade with half a percent risk.
On the higher time frame, the trend is still up.
Cutting-edge Tech, Outperforming Traditional Tools Until now my AI has been defying market odds
The forecasts work on all timeframes, short, medium or long range
My AI is outperforming traditional tools, in real time, thats right...with real time validation
The question is, will the crown remain intact or be dethroned??

bitcoin, Stay heavy on positionsbitcoin, Stay heavy on positions
Short-term overbought is noise. Focus on the bigger picture. Keeping my position heavy—no plans to reduce yet
