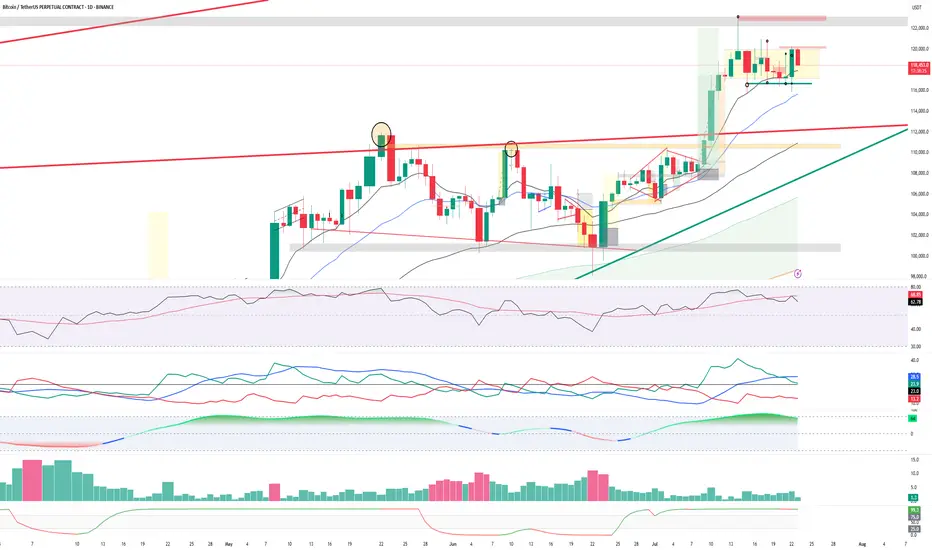
BTC/USDT – Range Formation Before Next Move?Bitcoin is currently consolidating between $117,000 support and $120,000 resistance, forming a tight sideways range after a strong breakout.
🔹 Structure Insight:
Bullish rally stalled at $120K resistance zone.
Range-bound candles with wicks on both ends = indecision.
Strong demand zone near $117K, acting as short-term floor.
🔸 Indicators Flash Neutral Bias:
RSI cooling off below overbought zone (~63) – no strong momentum.
ADX low and flattening – trend weakening.
MACD losing strength – bull momentum fading.
Volume declining during consolidation = awaiting catalyst.
🟢 Bullish Trigger: Break above $120K with strong volume could ignite next leg up → Targets: $122K–$127K
🔴 Bearish Trigger: Breakdown below $117K opens door to $114K–$112K retest.
🧭 Outlook: Sideways range – wait for breakout confirmation before positioning aggressively.
BTCUSDT trade ideas
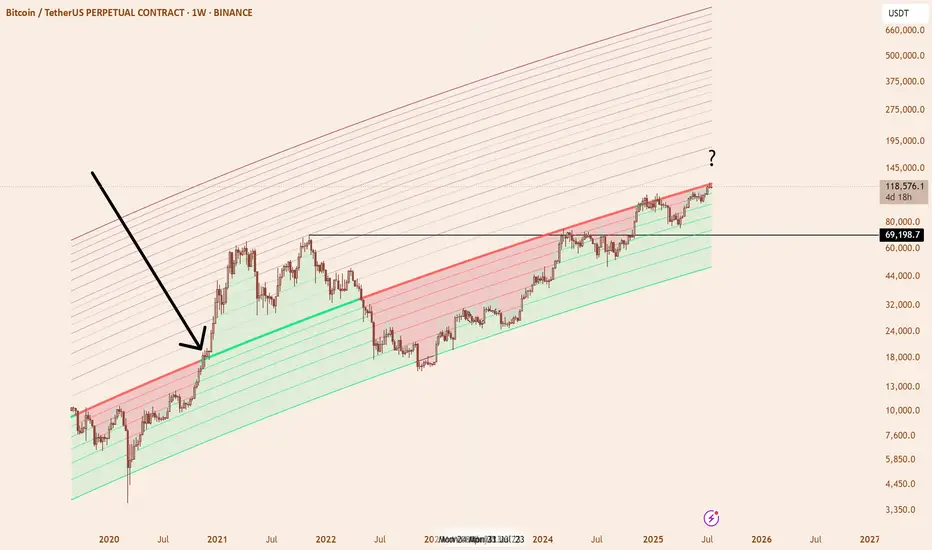
Power Law GrowthWhat you’re seeing is a Power‑Law Growth Corridor plotted over the weekly BTC/USDT price. In essence, it’s a dynamically‑sloped channel built on a power‑law fit of price vs. time, rather than the usual straight‐line
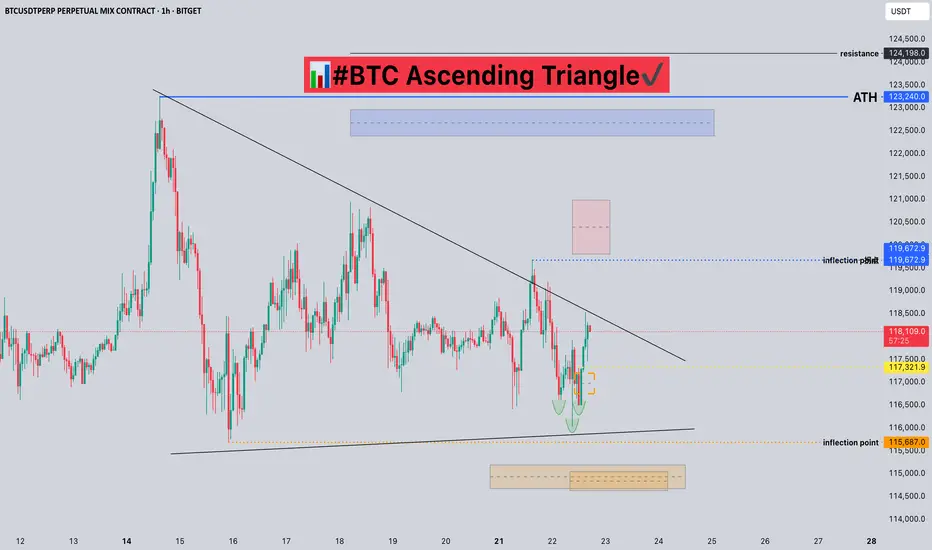
#BTC Ascending Triangle📊#BTC Ascending Triangle✔️
🧠From a structural point of view, we are still in a long-term bullish trend, and the short-term short structure of the small cycle is difficult to change the trend force of the large cycle. And we have been sideways here for a long time, digesting the selling pressure here, and it seems difficult to pull back. And the 15m level has built a bullish head and shoulders structure, so please be cautious about shorting!
➡️From a morphological point of view, the price is gradually compressed and formed into an ascending triangle. Generally, we will use this model to continue the original trend force.
⚠️Note that if we fall below the inflection point of 115687, it means a short structure at the 4h level. We need to be alert to further pullbacks. At that time, if we want to participate in long transactions, we need to find a lower support level to participate, such as around 112000.
Let's take a look👀
🤜If you like my analysis, please like💖 and share💬 BITGET:BTCUSDT.P
BTCUSD BULISH TRANDE Btuusd buy from 117,500
tp 118,500
tp 119,500
tp 120,590
Stope Lose 116,000
TRADE AT YOUR OWN RISK

long reng for mach timei thing we have reng sid for long time and 77500 / 133000 is on
but in line i see very opportunity fo trad
for just personal in other coin :)

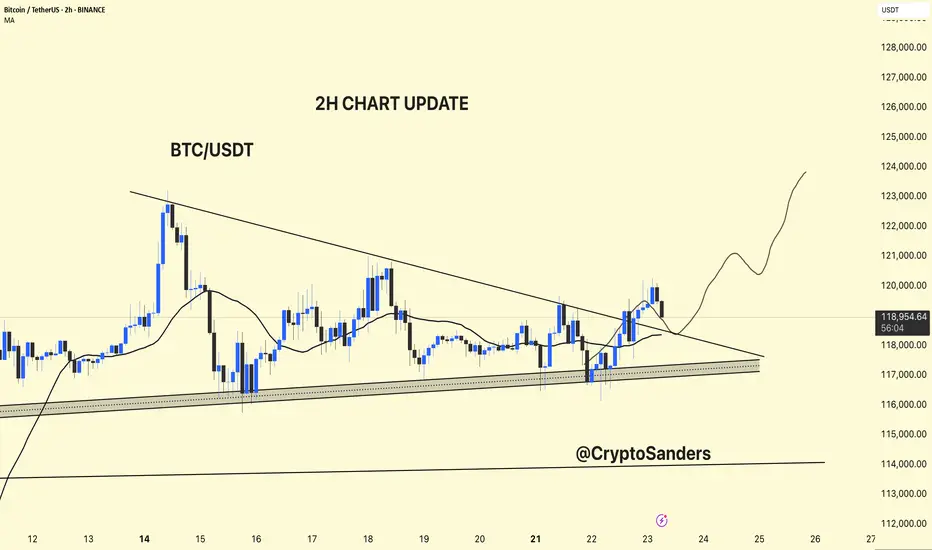
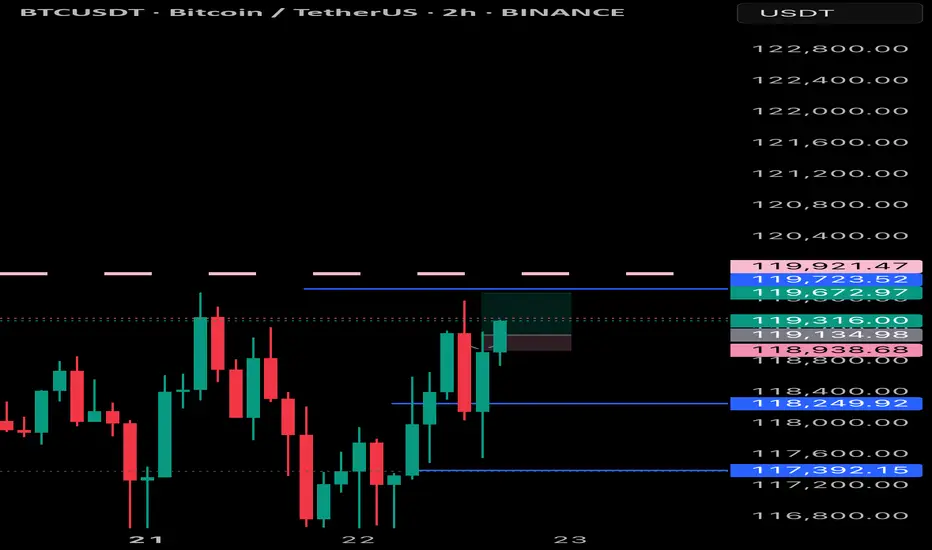
BTC/USDT – 2H Chart Update!!BTC/USDT – 2H Chart Update
Breakout Confirmed:
BTC has broken above the descending trendline but is currently facing resistance at around $ 119,500.
Support Zone:
Strong ascending support between $ 117,000 and $ 118,000 remains intact.
Moving Average:
Price is currently testing the 2H MA (~$118.3). Holding above this could confirm bullish continuation.
Outlook:
If BTC holds above $ 118,000, a move toward $ 123,000–$ 125,000 is likely.
Failure to hold may retest $117K support.
Bias: Short-term bullish unless price breaks below ascending trendline.
Thanks for your support!
DYOR. NFA
BTC # 15-minute BTC/USDT chart This 15-minute BTC/USDT chart shows a key breakout structure:
Ascending trendline (red) supported price before a breakout.
Horizontal line marks a previous resistance turned support post-breakout.
Vertical red line represents the breakout height.
50% retracement level of the breakout move is highlighted — a critical area for potential price reaction.
Price is currently pulling back after a recent high near $120,400, trading around $119,059, nearing the breakout support zone.
This setup suggests a possible bullish retest scenario if support holds near the 50% level
thanking you

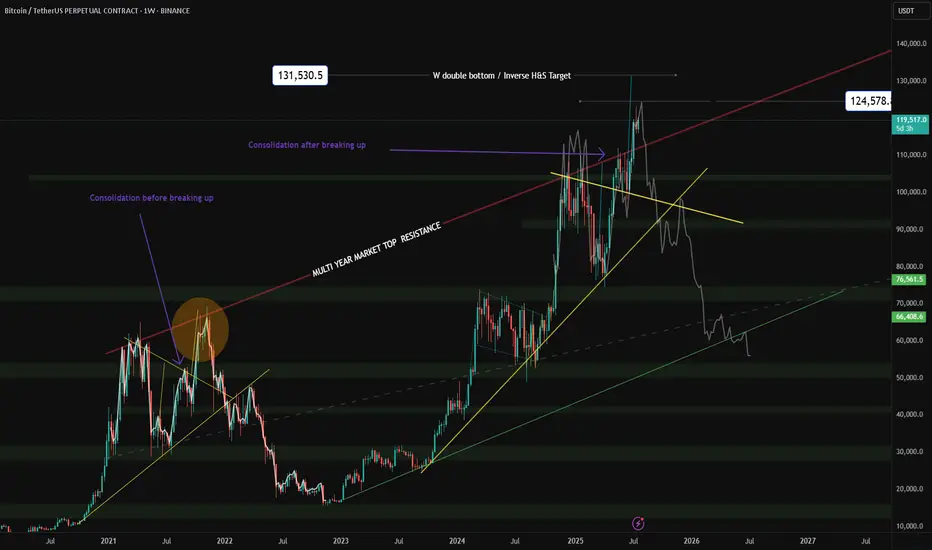
BTC - A POSSIBLE SCENARIO (MARCH 2025)BTC - A POSSIBLE SCENARIO (MARCH 2025)
BTC is still showing weakness. Overall, I remain bullish, but it may dip to $68K–$73K.
Alts are a real bargain now in March 2025. They won’t stay like this forever—soon, they’ll surprise everyone. But obviously they are extremely risky assets.

This time it's not different. Still The same macro structure. This time it's not different. we are in the last phase of the bull market cycle.
Bitcoin Wave Analysis – 22 July 2025
- Bitcoin reversed from support level 116065.00
- Likely to rise to resistance level 122775.00
Bitcoin cryptocurrency recently reversed up from the key support level 116065.00, which also stopped the earlier minor correction 2 at the start of June.
The support level 116065.00 was further strengthened by the support trendline of the daily up channel from June and the 38.2% Fibonacci correction of the upward impulse from July.
Given the strong daily uptrend, Bitcoin cryptocurrency can be expected to rise further to the next resistance level 122775.00 (which stopped the previous impulse wave 1).

$BTC Macro UpdateBitcoin Macro Outlook BINANCE:BTCUSDT.P
Weekly
Bias & momentum remain bullish. Price is pressing toward new ATHs despite last week’s pullback.
Next macro target: ~$133,550 (extension of the current DeCode V-Range: 111,959.5 – 77,111.0).
A weekly close back inside that range (<111,968.0) = Failed Auction → serious red flag for reversal.
Daily
Clean rejection off the 21-Day Rolling VWAP + bounce at the structural HL V-Level (116,862.4).
A strong bullish engulfing today would set the tone for follow-through this week.
10-Hour
Structure is still bullish. Multiple Failed Auctions from ~116,960.0 are driving price toward the ATH.
Intraday
Choppy and hugging range lows → harder read. That behavior near balance edges triggers AMT Rule #5: “If time/volume builds at the edge of balance, price is likely to push through.”
Auction Market Theory – Quick Reminders
Price : advertises opportunity
Time : regulates opportunity
Volume : tells you if the auction is succeeding or failing
Rule #5 (above) is in play right now. Stay patient, wait for confirmation, and don’t FOMO.

"BTCUSDT Bearish Reversal: FVG Breakout & Sell Target Zone AnalyThis BTCUSDT 1D chart highlights a Bearish Market Structure, showing a Break of Structure (BOS) followed by a Fair Value Gap (FVG) and Breakout. A Support Level within the Demand Zone was tested, and the price is projected to fall toward the Sell Target Zone near 99,581 USDT.

targetRemember, day trading is risky and most traders lose money. You should never trade with money you can’t afford to lose. Prove profitability in a simulator before trading with real money.
❗❗My results are not typical. We do not track the typical results of past or current customers. As a provider of trading tools and educational courses, we do not have access to the personal trading accounts or brokerage statements of our customers. As a result, we have no reason to believe our customers perform better or

Lingrid | BTCUSDT Consolidation Expansion ScenarioBINANCE:BTCUSDT is coiling within a bullish continuation zone after rebounding strongly from the 115,930 support and holding above the blue ascending trendline. Price formed a higher high inside the rising channel, followed by sideways consolidation, suggesting preparation for another bullish leg. The triangle pattern breakout and price stability above the trendline favor upward continuation toward the resistance at 126,500. Momentum remains intact while the structure supports the next breakout push.
📉 Key Levels
Buy trigger: Break and hold above 120,000
Buy zone: 117,500–118,200
Target: 126,500
Invalidation: Close below 115,930
💡 Risks
Loss of support at the trendline
Strong rejection near red channel resistance
Weak market sentiment or macro news shocks
If this idea resonates with you or you have your own opinion, traders, hit the comments. I’m excited to read your thoughts!

Bitcoin shows signs of a potential declineBitcoin's price shows signs of a potential decline after testing resistance levels. A correction at this stage is generally a healthy sign for the market, allowing for consolidation before any strong upward move.
Bitcoin may test the resistance line after the current decline. If the price falls below 118,000, there is interim support, but further downside may be expected. 116K and 112K A break below 112,000 could open the door for deeper bearish momentum.
You May find more details in the chart.
Trade wisely best of Luck.
Ps Support with like and comments for better analysis Thanks for Supporting.

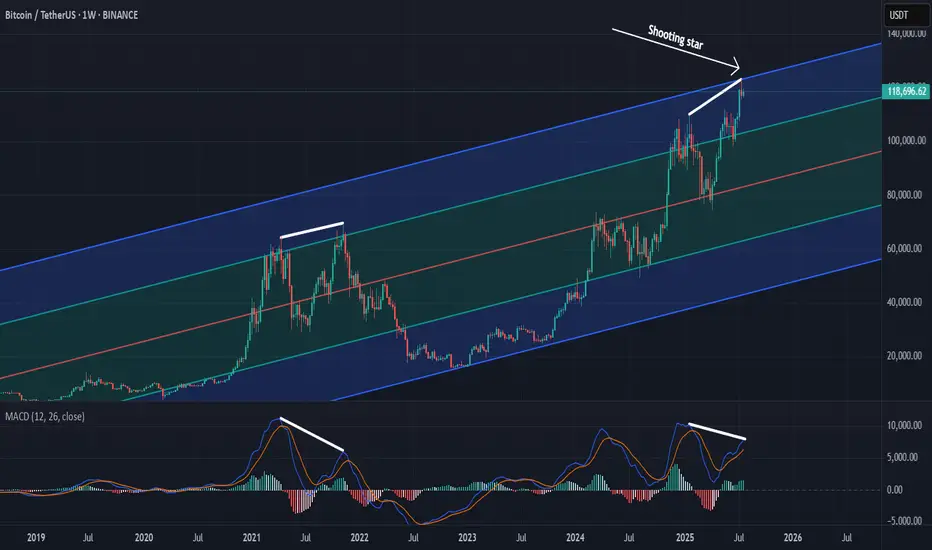
Calling the Unthinkable: Why a Bitcoin Drop May Be ComingCOINBASE:BTCUSD BITSTAMP:BTCUSD OKX:BTCUSD BINANCE:BTCUSDT.P
Predicting a drop in Bitcoin's price during a strong uptrend is extremely difficult and calling it takes real courage. It puts my credibility at risk, but based on everything I see, I believe BTC has reached dangerously high levels.
From a psychological perspective , investor behavior is sending warning signs. There’s a rush of people buying in out of FOMO, amplified by heavy promotion on social media and mainstream claiming BTC is the safest investment out there. Many who missed earlier buying opportunities now regret betting on altcoins instead, and they see this as a last chance to profit. Even if BTC drops below their entry points, most of these “late buyers” won’t sell. They’ll convince themselves it’s just another minor correction like what happened in the previous 2 years, and that they’re in it for the long term.
From a technical analysis point, the signs are just as concerning. A “ shooting star ” candle has formed on the weekly chart. This candle is often seen at market tops. The MACD histogram on the same timeframe is showing a potential divergence, suggesting weakening momentum. The Fear and Greed Index is approaching 70, indicating strong market greed. On top of that, traders are opening high-leverage long positions in anticipation of another big bullish candle.
These technical and psychological signals combined paint a risky picture. If this kind of setup is confirmed , it will lead to sharp corrections.
HolderStat┆BTCUSD consolidatedBINANCE:BTCUSDT is consolidating between $129K and $137K. Breakout above $137K could lead to new highs. Key support remains at $125K.

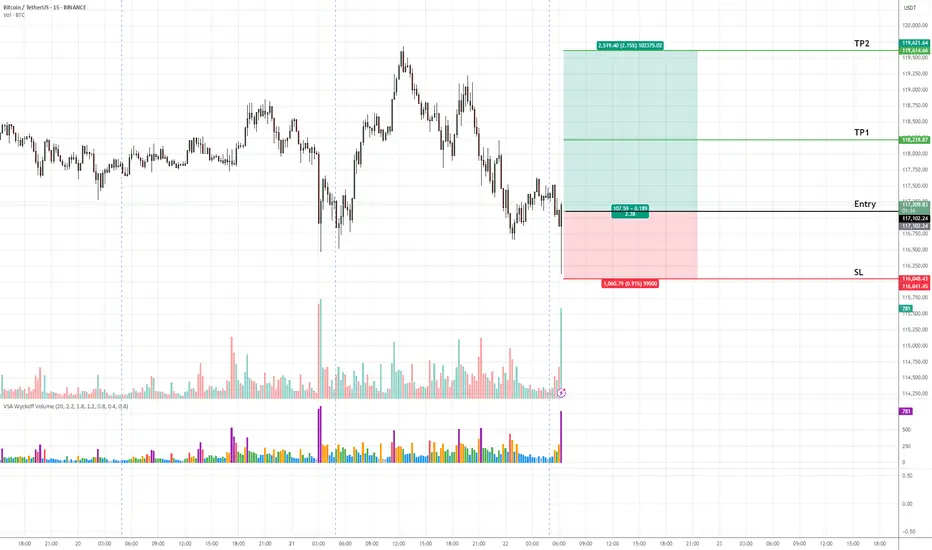
BTCUSD (Bitcoin) Buy Setup – VSA & Market Structure Analysis✅ Entry: As marked on chart
🎯 Take Profit 1 (TP1): Highlighted zone on chart
🎯 Take Profit 2 (TP2): Highlighted zone on chart
🛑 Stop Loss (SL): Defined below recent demand zone
📊 Technical Insight (VSA & Market Structure):
The recent decline into the support zone occurred on diminishing volume, indicating a lack of selling pressure.
A climactic volume spike (stopping volume) followed by a wide spread bullish candle suggests strong professional buying activity.
Subsequent bars show narrow range candles with low volume, characteristic of an absorption phase, hinting at smart money accumulation.
Price is now attempting to break above the previous minor resistance, which would confirm demand overcoming supply.
The broader market structure aligns with this setup: Bitcoin is in a higher timeframe accumulation range, and this move could initiate a markup phase as per Wyckoff/VSA principles.
📍 As long as price holds above the stop loss zone, we expect a bullish leg towards TP1 and TP2, in line with the emerging demand dominance.
Guys. Thoughts?Just having a conversation with a trading jedi master and then they taught them to set a buy stop with heavy risk above the lower high at the top of the market cycle in the sell side of a previously resolved block after exceeding the statistical high of the dealers range for the day. Just for some more insight, this all happened while venus was in retrograde. Hopefully that paints a clear enough picture. Don't hesitate to ask questions.
Signing off, yours faithfully,
ChartCharmer.

BTCUSD BTCUSD still expecting some good run within to the up side as there’s a new higher price that’s not been touched
BTC - LTF Breakout? Here is an update to our last post:
After monitoring for a breakout we are seeing early signs of just that.
We saw a rejection from yesterday's test but this morning have broken above our white dotted line with the first breakout candle. Now with this 4H candle we could be seeing the confirmation breakout. After wicking down the bulls have pushed price back up where the candle is holding support above the white dotted trendline.
Technically this current 4H candle would be considered a bearish candle, but due to the circumstances it could easily be negated.
If price does fall in the next 4H period and we do not see another close above the white dotted line, then this would be considered a fakeout and we would most likely see much lower prices. However, what we want to see is price push above this current candles 4H high which would negate the bearish candle and most likely start the rally towards our yellow line target.

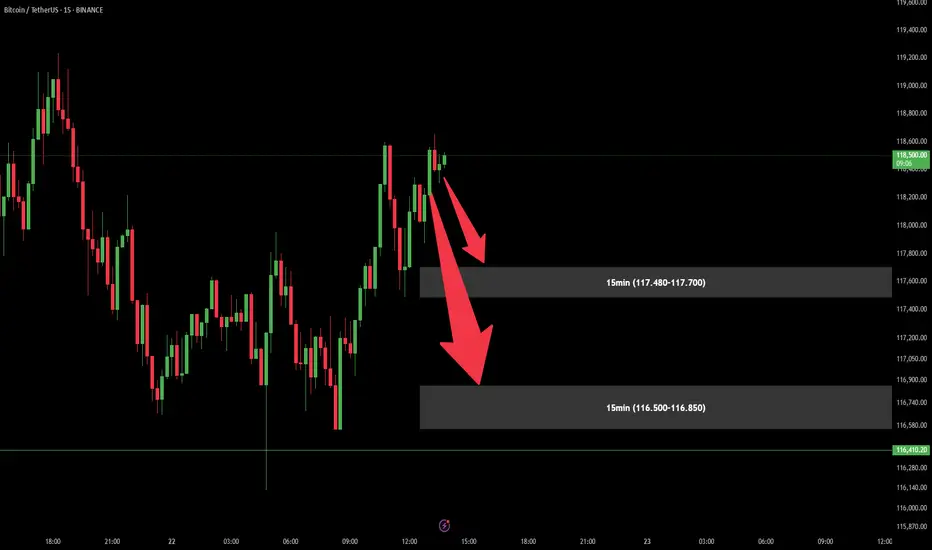
2 Possible Scalps for BITCOINThere are 2 Demand areas which have specified on the chart,
Both could be good for some scalps.
As long as price keeps 116.400 area UpTrend is on the card.
Trading plan for BitcoinLast week, Bitcoin established a new ATH at $123k before entering a corrective phase. The price action has since developed into a clear consolidation pattern and currently trades below the weekly pivot point.
Key Observations:
Proximity to last week's low increases probability of a full ABC correction targeting $113k
Break above noted resistance could invalidate bearish scenario and suggest ATH retest
Critical Levels:
Resistance: $119,500
Support: $113,000 (ABC target)
Trade the range until the market declares its next direction.
