Crypto Market: What You MUST Know Today!⚠️ Crypto Market: What You MUST Know Today!
📌 Risk Management is 🔑
As we said yesterday, in a market like this, risk management, break-even planning, and timely profit-taking are essential. Every position should come with a clear and structured plan.
📰 Major Fundamental Updates
🔻 Bitcoin has dropped below $117,000 today.
👉 Main reason: Profit-taking after recent gains.
💸 Over $131 million has been withdrawn from Bitcoin ETFs in recent days, adding selling pressure to the market.
🎤 Jerome Powell is scheduled to speak today. The market is nervous he might hint that interest rates will stay high. Investors are on hold.
⚖️ Key crypto regulation bills in the US are facing setbacks. Legal uncertainty is keeping investors cautious.
💰 Capital is rotating from BTC into altcoins. Solana is up 🚀, while Ethereum and Ripple are slightly down.
📉 Technical indicators like RSI and MACD show overbought conditions. The market is correcting now, and the uptrend is weakening.
🏛️ A crypto policy report from the White House is expected today. Many are waiting for clarity before taking big steps.
📊 US inflation remains high → The Fed is unlikely to cut rates soon. Crypto markets need looser monetary policy to thrive.
💥 A large number of leveraged long positions are concentrated around $115,000. If BTC falls further, liquidations may cause additional selling pressure.
♦️ BTC Technical View
The weekly chart shows both buying and selling pressure.
Strong buy wicks indicate active buyers around the $114K–$116K zone.
If price breaks below this level sharply, expect a deeper drop.
If the price approaches this zone slowly, buyers (both takers and makers) may step in to defend it — potentially triggering the next leg up.
⚠️ Important Note
❌ No short positions in our strategy.
Even if price drops, our plan is: “No problem, we missed it 😄”
Our approach = No shorting at these levels. Stay disciplined. 💪
♦️ BTC Dominance (BTC.D)
📉 After a sharp drop, a bounce to 62.15–63.63 is possible.
Once this correction completes, we’ll watch for altcoins that are still ranging and getting ready to break out.
📈 If BTC starts printing green candles with rising volume:
➡️ Focus on altcoins in your watchlist near breakout levels.
📌 Two Main Scenarios:
• ✅ BTC breaks $120K and dominance drops → Early signs of altseason
• ❌ BTC drops and dominance rises → Altcoins likely to drop further
♦️ USDT Dominance (USDT.D)
🔁 Yesterday’s session didn’t break above 4.14 → No bullish confirmation for BTC or alts yet.
📈 If 4.26 breaks upward → Expect more correction across the market.
📉 If 4.14 breaks downward → We may stay in our positions with more confidence.
✅ What to Watch For Today
📊 Jerome Powell’s speech
📰 White House crypto policy report
📉 USDT.D movement at 4.14 / 4.26
🔍 BTC price action near the $114K–$116K zone
🚀 Altcoins approaching breakout levels
🚀 If you found this helpful:
👉 Tap the rocket to support
🔔 Follow for clear, no-hype market updates
💬 Drop your thoughts in the comments!
BTCUSDT trade ideas

Bitcoin (BTC) Analysis – July 21, 2025We’ve previously discussed the significance of the $110,000 level — a zone where long-term holders typically take partial profits.
After multiple pullbacks from that region, a new wave of short-term investors stepped in around $97,000, managing to push the price as high as $123,000.
⚠️ I know many traders are tracking Bitcoin dominance and expecting a correction from this zone — and I partly agree.
However, issuing a sell signal here feels premature and potentially risky.
✅ Instead, I’d suggest looking for a re-entry opportunity around $95,000, where market structure and buyer activity may offer a much better risk-reward ratio.
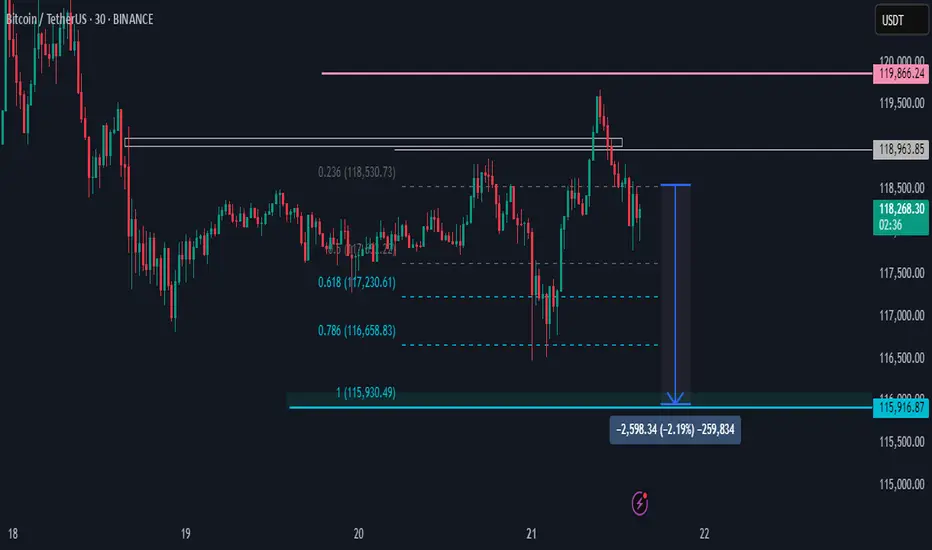
BTCUSDT Aiming LowsHi there,
BTCUSDT looks bearish at the M30 with one price target of 116 658.83 for a bias of 115 930.49.
The bearish price appears to be sustained by the H4 time frame.
Happy trading,
K.
Not trading advice
BTC-----Sell around 118100, target 116500 areaTechnical analysis of BTC contract on July 22:
Today, the large-cycle daily level closed with a small positive cross yesterday, and the price was below the moving average. The attached indicator was dead cross. The general trend is currently biased towards a downward trend. From the overall trend, we can see that the current trend is consistent and strong, but there is no room for rebound, and the continuous sluggish trend is also quite obvious, so the idea of selling down in the future market has become the main idea; the short-cycle hourly chart showed that the US market fell and rebounded yesterday, and the pressure continued to fall and broke down in the morning, and the correction high was near the 118000 area. The current K-line pattern is a single positive line. According to the trend rule, if the decline continues today, the rebound strength cannot be large, and the high point of the US market correction is resistance.
Today's BTC short-term contract trading strategy:
Sell at the current price of 118100, stop loss at 118500, and target 116500;

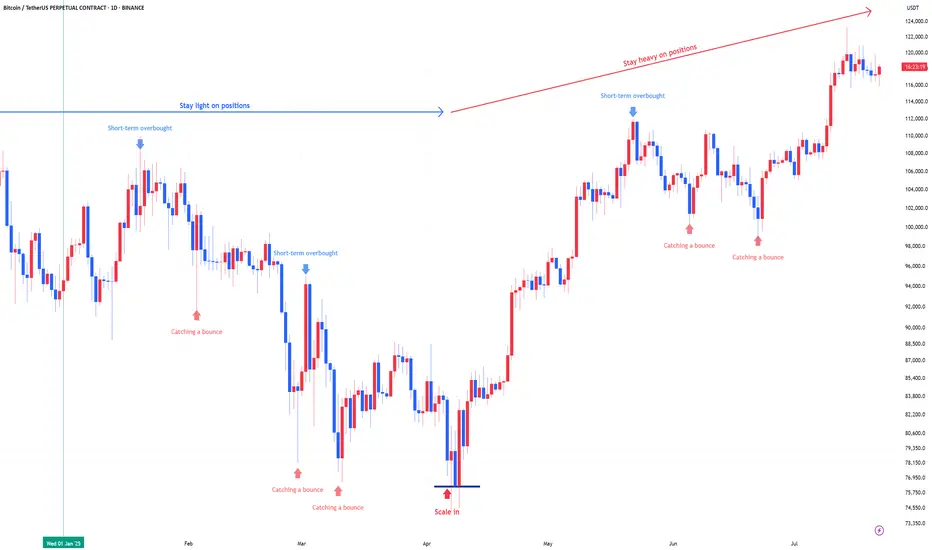
Bitcoin : Stay heavy on positionsApril was the scale-in zone:
Back in April, the US stock market flashed a split-entry buy signal—a classic zone for gradual accumulation.
That same setup applied to Bitcoin. Buying the fear worked again.
We’ve moved out of the fear zone:
Both Bitcoin and equities have left the extreme fear territory behind. Sentiment has shifted.
Short-term overbought now:
Bitcoin is currently in a short-term overbought phase. Some consolidation or cooling off is natural here, but no major trend reversal signs yet.
Stay heavy on positions:
I’m maintaining an overweight position in Bitcoin as long as the US stock market stays intact. The Nasdaq is holding up, so Bitcoin likely stays in risk-on mode.
Warning:
If US equities take a hit, expect Bitcoin to follow.
Negative moves in the stock market will likely translate directly into crypto weakness.
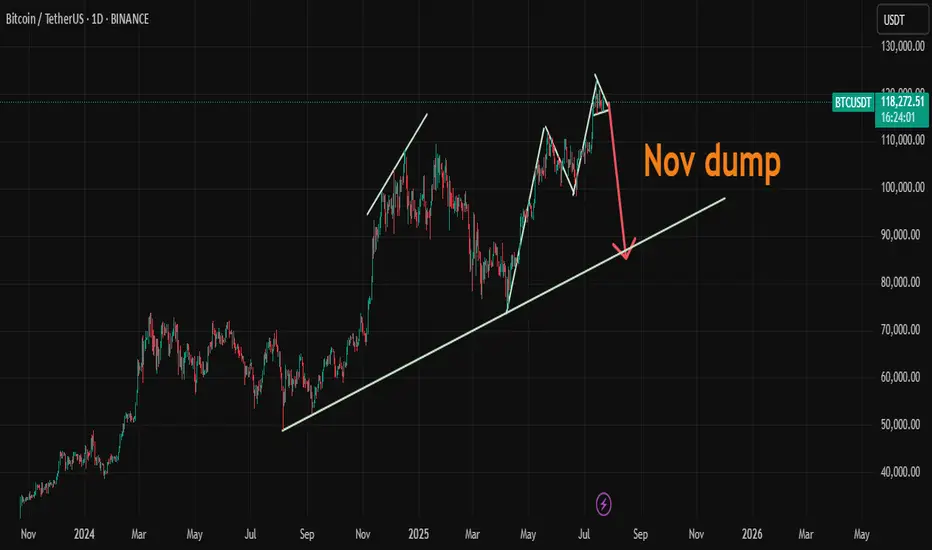
BTC/USDTHello friends, I hope you are well. We should probably expect a slight increase in Bitcoin after the big drop in the financial market, which will most likely start in November. What is your opinion?
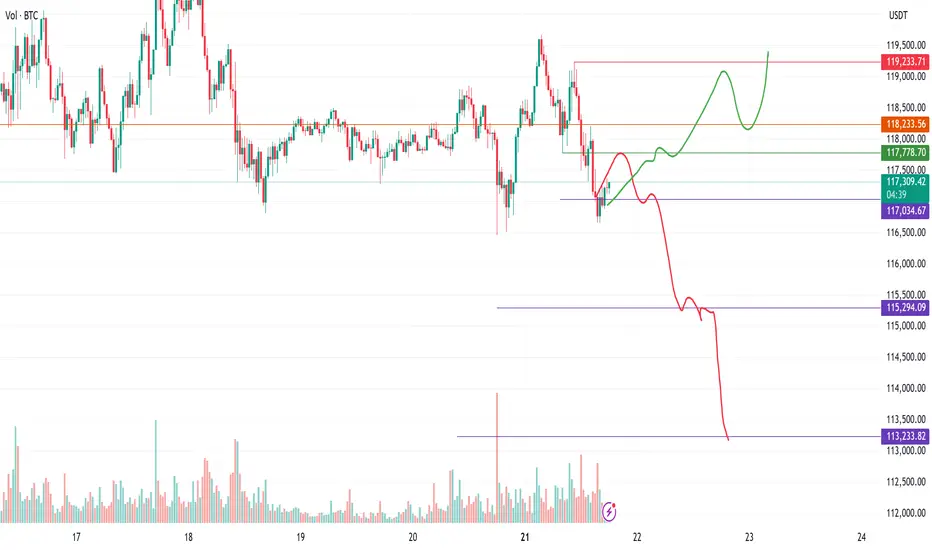
BTC/USDT – Breakout Watch🔹 Price rebounded strongly from key support at $116,400
🔹 Approaching breakout zone near $119,500
🔹 Descending trendline and multiple rejection wicks being tested
🔹 Bullish momentum building — RSI rising, MACD stabilizing, volume uptick visible
🔹 ADX shows trend strength picking up
📈 If breakout confirmed above $119,500:
🎯 TP1: $122,000
🎯 TP2: $127,000
🎯 TP3: $135,000
📉 Below $116,400 = invalidation
Bias: Bullish above $119,500, cautious until breakout confirms.

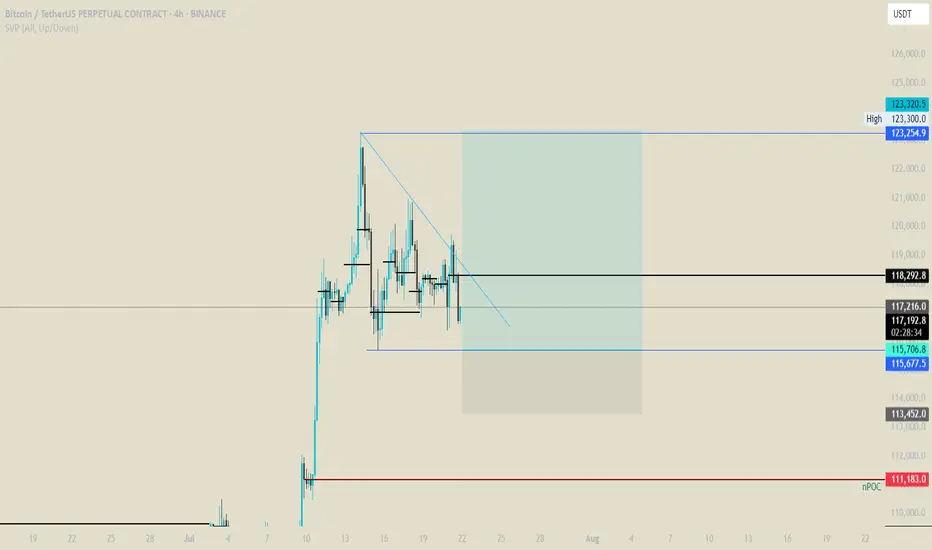
#BTC Update #9 – July 22, 2025#BTC Update #9 – July 22, 2025
As previously noted, Bitcoin is currently trading within both a horizontal range (box) and a tightening triangle formation. Although there was a drop last night, price didn’t pierce the lower boundary of the box and is now showing an upward reaction.
As long as BTC holds above this box, there’s no major risk. Bitcoin has already completed the 0.382 Fibonacci retracement from its previous impulsive move. If that correction is sufficient, the next upside target is $127,900.
However, one key point to watch: Bitcoin failed to break its previous high in its last three attempts — a clear sign of price compression and market indecision.
📌 No need to rush into Long or Short positions. It’s best to wait for a confirmed breakout before acting, as premature entries could carry elevated risk.

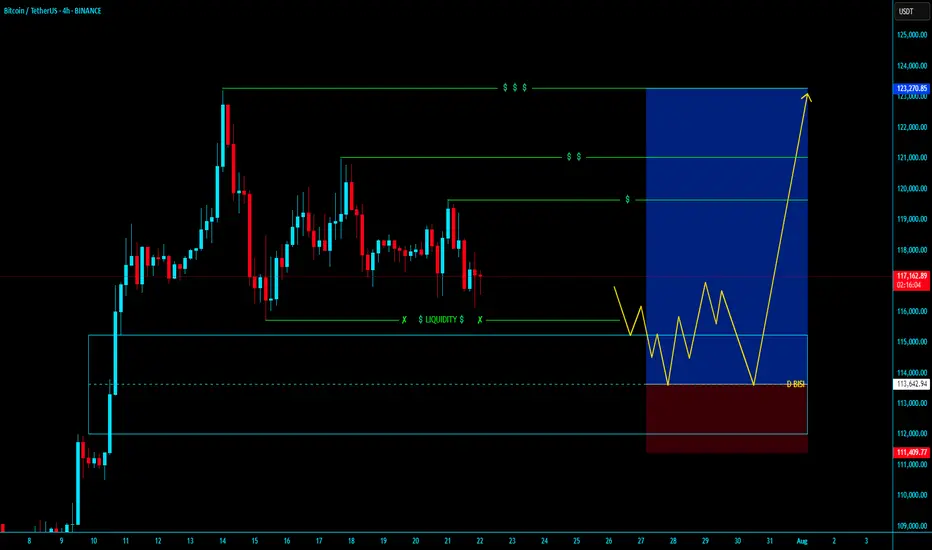
BTCUSDT BUY LONGBTCUSDT BUY LONG FROM DAILY BISI
- Market will fully Bullesh In Every TF with Bullrun with Already Starts
- In Daily TF our Long From Daily BISI
- In LTF after Valid MSS with Valid OBI and Mostly After Run On Stop
- Then our entry for Long time of Holding i think its going to over night holding and book profit Partially / Target is Nearly Liquidity pool
Hold and Enjoyyyyyyyyyyyyyy
~ KGB Priyabrta Behera ~
ICT Trader & Advance Mapping SMC Trader
Bitcoin Breakout Bonanza - Ride the Wave, BroYo, check this Bitcoin chart, fam! We’re sittin’ at 107,725, and it’s lookin’ like a wild ride. That break above 127,725 is screamin’ bullish—time to ride the blue arrow up! But watch out, a drop below could send us crashin’ to 107,475 with that red arrow vibe. Stay sharp, dude!

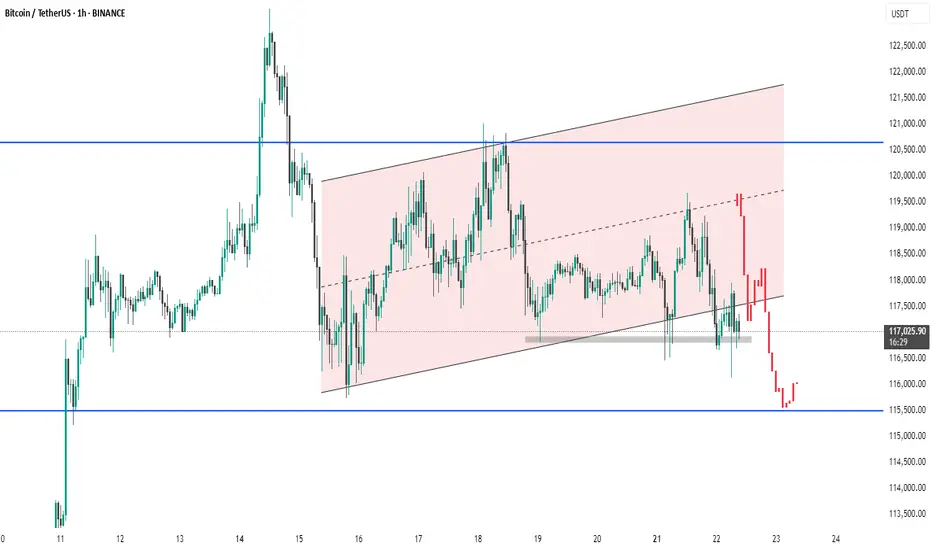
BTC # 1-hour Bitcoin/USDT chart This 1-hour Bitcoin/USDT chart from Binance shows a recent breakdown from a rising parallel channel (highlighted in pink). Price action broke below the lower trendline and a key support zone (grey area), indicating a bearish shift. The strong red candles signify increased selling pressure. The next major support lies near 115,500 USDT (blue horizontal line), which could act as a potential bounce zone.
thanking you
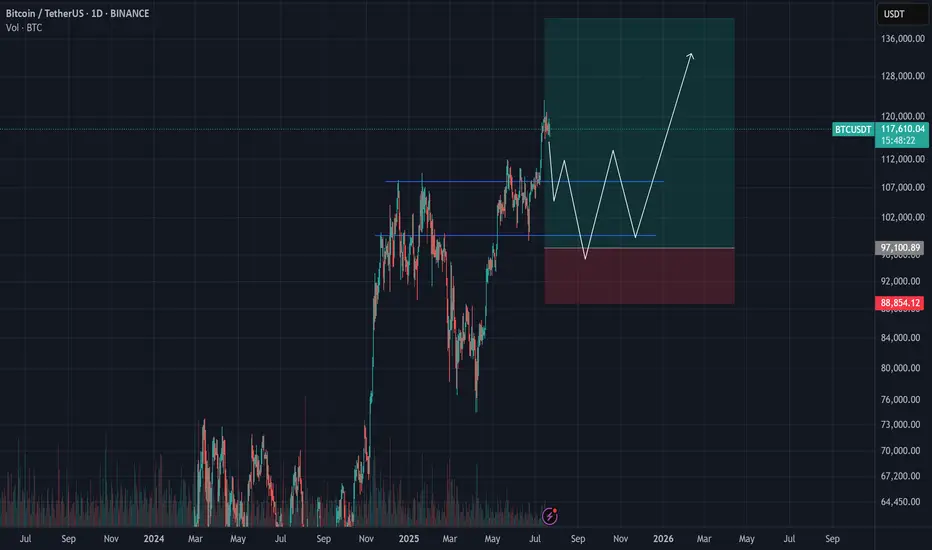
Bitcoin: Nothing Changed, Still BullishBitcoin: Nothing Changed, Still Bullish
BTC still maintains a strong upward momentum. Immediate strong support was found again near 116K.
It seems that the market has set a new low for BTC around this area for now. I think that as long as BTC stays above this area, there is a good chance that the increasing volume and buyers will increase further pushing BTC further, as shown in the chart, to 120,600; 122,400; 125,000 and 127,000.
If it moves below the red zone, we should be careful as it could undergo a major correction before taking a clear direction.
You may find more details in the chart!
Thank you and Good Luck!
PS: Please support with a like or comment if you find this analysis useful for your trading day

The 3-Step Rocket Booster Strategy Bitcoin Edition🚀 3 Key Features of Bitcoin
Decentralized Network – No central authority like a bank or government controls Bitcoin.
Limited Supply – Only 21 million bitcoins will ever exist, making it scarce and valuable.
Borderless Transactions – Send or receive money globally without needing permission or intermediaries.
✅ 3 Benefits of Using Bitcoin
Freedom from Inflation – Bitcoin resists inflation because of its fixed supply.
Fast & Low-Cost Transfers – Especially useful for international payments.
Financial Inclusion – You don’t need a bank to own or use Bitcoin—just a smartphone and internet.
⚠️ 3 Problems with Bitcoin
Price Volatility – The price can change rapidly in short timeframes.
Scams & Fraud – Many fake crypto projects use Bitcoin’s name to deceive people.
Technical Learning Curve – Beginners may find it hard to understand wallets, keys, and security.
🤔 3 Common Objections
“Bitcoin is too volatile—I might lose money!”
“It’s too complicated for me to use.”
“Governments will ban it eventually.”
💡 3 Ways to Overcome Objections
Use only what you can afford to lose. Start small and grow with knowledge and confidence.
Use beginner-friendly apps like Binance, Trust Wallet, or Paxful. These platforms make Bitcoin easier than ever.
Bitcoin is legal in most countries, and major companies are adopting it—its use is expanding, not shrinking.
🛒 Take Action Now!
Don’t wait for the price to explode again. Learn, test with small amounts, and start your Bitcoin journey today.
👉 Buy Bitcoin now and take control of your financial future!
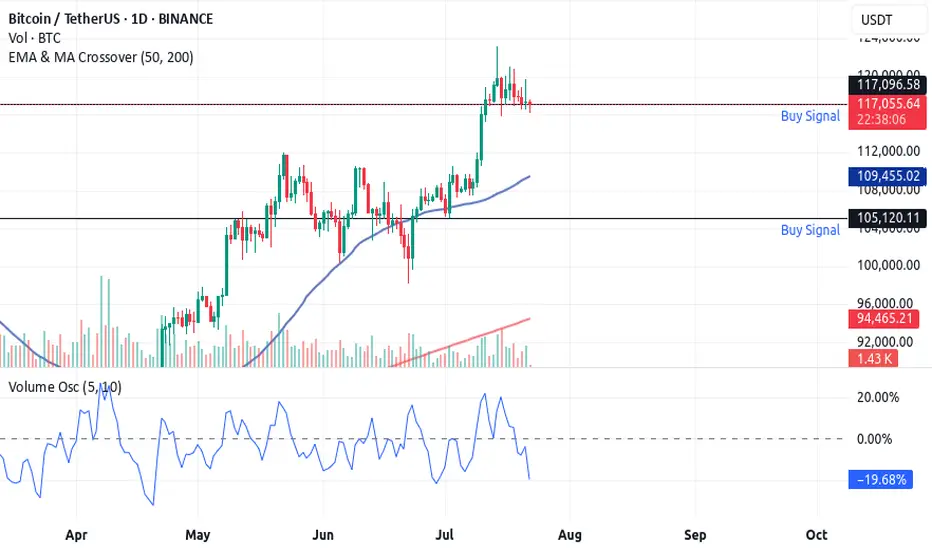
🚀 The 3-Step Rocket Booster Strategy
🔍 Step 1: Price Above the 50 EMA
What it means: The price is trending upward in the short-to-medium term.
Why it matters: This shows strength and upward momentum—price is above its recent average.
🔍 Step 2: Price Above the 200 EMA
What it means: The long-term trend is also bullish.
Why it matters: This confirms that the overall market direction is up, reducing the risk of fakeouts.
🔍 Step 3: Volume Oscillator Surge (Volume "Booster")
What it means: There is a spike in volume (measured using a volume oscillator).
Why it matters: Volume confirms that big players are involved. Price moves backed by high volume are more reliable and likely to continue.
✅ Optional Extra Filter: Check if the price has gapped up or if there's a bullish candlestick pattern (e.g. Marubozu, Engulfing, Morning Star) to increase confidence.
Rocket boost this content to learn more.
Disclaimer:Trading is risky please use a simulation trading account before you trade with real money.Also learn risk management and profit taking strategies.
BTC Correction in progress - Can it invalidate? BTC downside pattern triggered on 30 min chart. If it can get back above the green line it will invalidate, though right now the red downside path is looking more likely.
Bitcoin longLong from 115k region.
Sweep 4h lows and then i think it will show some strength to the upside.
BITCOIN → Consolidation, retest of 120K. Correction of dominanceBINANCE:BTCUSDT , after a rapid rally and touching 123K, rolled back and entered consolidation, giving altcoins a chance. At the same time, Trump signed new crypto laws, but will these laws open new doors?
On June 18, the GENIUS Act was signed. Information can be found in the sources, but there is no direct reference to BINANCE:BTCUSDT.P , except perhaps indirectly: increased confidence in the crypto market, increased liquidity, possible new rules, and pressure on decentralized assets. Bitcoin has not always grown on positive news; more often it has been a deep pullback and liquidation before the momentum.
Technically, Bitcoin is currently consolidating, and I would highlight several key areas: the upper range is 120K-120.9K. The zone between these levels is particularly important, as this is where buyers were previously liquidated and sellers gathered (liquidation is possible).
The bottom is 117K (confirmed) - 116.2K. There is a liquidity pool on the support side.
additional scenario if the market does not reach resistance and decides to form a long squeeze before growth
Theoretically, I am not yet expecting a breakout and growth of Bitcoin. I think that consolidation may continue for some time, especially against the backdrop of a pullback in altcoins and a deep correction in the dominance index.
Resistance levels: 120100, 120850
Support levels: 117000, 116230
Since the opening of the session, the price has been working off the liquidity capture from 117K. There is a reaction - growth, which could bring the price to the zone of interest at 120K. But the question is: will the price hold in the 120K zone? A false breakout of resistance could trigger a correction to 117-116K. Thus, I expect the market to remain in consolidation for some time or even expand the current trading range...
Best regards, R. Linda!

BTC Ranging After $123K Pump 📈 BTC Ranging After $123K Pump — Key Support/Resistance & Altcoin Outlook
After a strong rally to $123,000, Bitcoin is now ranging, and what’s important to note is that BTC Dominance was falling both during the pump and the consolidation — a sign of strength in altcoins.
🧠 Key Levels to Watch:
If $116,289.3 breaks, consider partial profit-taking, especially if you're in alt positions, or adjust your stop-losses upward.
The zone between $116,289 – $116,773 is critical. If it fails, we could see a drop toward $113,000 – $113,713.
As long as BTC is above $111,000, the bullish structure remains intact — I’m personally not shorting in this range.
The next bullish trigger I’m watching is around $120,538.6 — not confirmed yet.
🧭 Dominance Signal:
If BTC corrects, I expect BTC Dominance (BTC.D) to bounce to around 62.73%–63.17%.
But if BTC continues to range or goes higher while dominance drops, altcoins may outperform — keep your eyes on strong setups.
---
💬 What are your top altcoin picks in this BTC range? Let me know below!

BTC/USDtBTC is currently showing signs of short-term weakness. A break of $117k might give us a swift drop to $111k before we ramp back up. It will be a quick buy opportunity in my opinion. From there alts will move! I hope you are ready for one heck of a ride up on altcoins!

Bitcoin Technical Setup: Support Holds, Wave 5 in FocusBitcoin ( BINANCE:BTCUSDT ) filled the CME Gap($117,255-$116,675) and started to rise, as I expected in my previous idea .
Bitcoin is currently trying to break the Resistance zone($119,530-$118,270) . In the last week's movement, the price of $118,000 can be considered as one of the most important numbers for Bitcoin , with a lot of trading volume around this price.
In terms of Elliott Wave theory , it seems that Bitcoin has managed to complete the main wave 4 near the Support zone($116,900-$115,730) and Support lines . The structure of the main wave 4 is a Zigzag Correction(ABC/5-3-5) (so far). There is a possibility that the 5th wave will be a truncated wave because the momentum of the main wave 3 is high and Bitcoin may NOT create a new ATH and the main wave 5 will complete below the main wave 3.
I expect Bitcoin to start rising near the Potential Reversal Zone(PRZ) and Cumulative Long Liquidation Leverage($118,277-$118,033) , break the Resistance zone($119,530-$118,270) and reach the targets I have marked on the chart.
Note: Stop Loss(SL)= $116,960
CME Gap: $115,060-$114,947
Cumulative Short Liquidation Leverage: $121,502-$121,134
Cumulative Short Liquidation Leverage: $120,612-$119,783
Cumulative Long Liquidation Leverage: $116,810-$115,522
Do you think Bitcoin can create a new ATH again?
Please respect each other's ideas and express them politely if you agree or disagree.
Bitcoin Analyze (BTCUSDT), 1-hour time frame.
Be sure to follow the updated ideas.
Do not forget to put a Stop loss for your positions (For every position you want to open).
Please follow your strategy and updates; this is just my Idea, and I will gladly see your ideas in this post.
Please do not forget the ✅' like '✅ button 🙏😊 & Share it with your friends; thanks, and Trade safe.

BITCOIN FINAL WARNING BEFORE HUGE MOVE!!! (urgent) Yello Paradisers! I am Sharing with you my idea about #Bitcoin of what's going on with Bitcoin right now: be very careful because the Fear and Greed Index, a special one, is at "Greed". We are seeing funding rates, the accumulated funding rates, as extremely positive. We are seeing bearish patterns forming.
In this video, I'm describing the confirmations we are waiting for that will confirm that Bitcoin is about to make a huge movement. Make sure that you are trading with professional trading strategies and that you are waiting for confirmations before any trade execution. Also, make sure that you have tight risk management because only the best, most professional traders will win long-term in this game.
Don't be a gambler. Don't try to get rich quick. Make sure that your trading is professionally based on proper strategies and trade tactics.

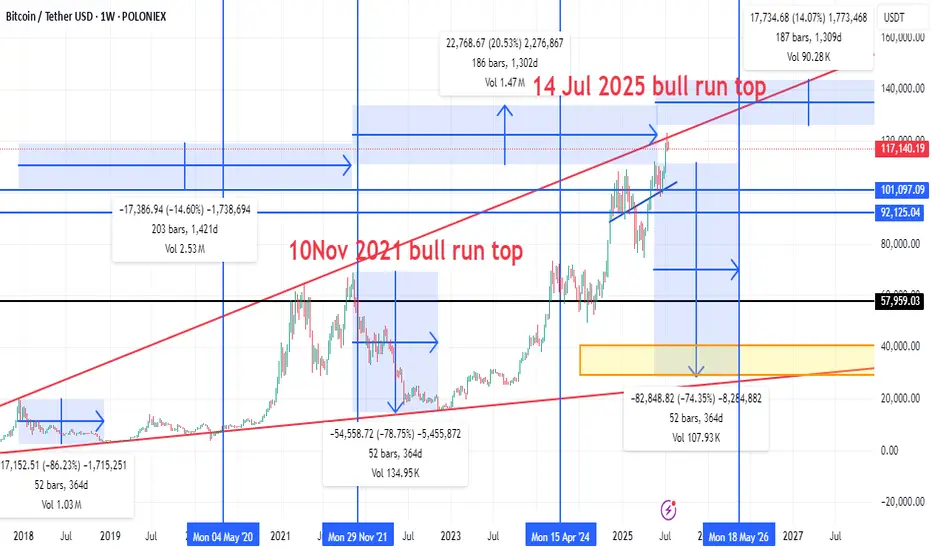
Bitcoin’s “four‑year” halving‑cycle rhythm by overlaying three c🔍 Key Highlights from the Chart
🟢 Bull Market Peaks
10 Nov 2021: Previous cycle top around ~$69,000.
14 Jul 2025 (Projected): Potential new bull market top (approx. $120K–$125K zone based on red trend line projection).
🔴 Bear Market Drops
2021–2022 Crash:
Drop of -78.75% from the 2021 top.
Lasted 52 bars (364 days).
Next Projected Bear Market:
Projected from July 2025 to May 2026.
Expected drawdown: -74.35%, possibly taking BTC down to the $30K–$40K range (orange box support zone).
📉 Correction Zones
Mid-cycle corrections like the one from Apr 2024, showing smaller drops (~20%).
📈 Trend Channel
Red diagonal lines form an ascending channel for bull market tops.
Current price (~$117,872) is nearing upper resistance of this long-term trend channel.
📊 Support/Resistance Levels
$120K & $125K: Horizontal resistance zones.
$57,959: Major historical support (former resistance).
$30K–$40K: Bear market bottom zone based on history and trendline confluence.
⏳ Cycle Timing
Historical cycles span about 4 years:
Peak → bottom → new peak = ~1,300–1,400 days.
This cycle’s timing aligns almost perfectly:
Nov 2021 → Jul 2025 = 1,300+ days (same as past cycles).
Suggests potential top is in or near.
📌 Summary & Outlook
Phase Estimate
Current Price ~$117,872
Projected Top ~$120K–$125K (likely topped 14 Jul 2025)
Next Major Drop -70% to -75% (target: $30K–$40K)
Next Cycle Low Mid 2026 (May–July 2026)
Strong Support Zone $30K–$40K (orange box)
🧭 Strategic Notes
If this chart pattern holds, major profit-taking should already be done or initiated.
Watch for weekly close rejections at trend channel top for confirmation of top formation.
Reentry in mid-2026 would historically offer a high reward/risk zone.
HOW-TO: Auto Harmonic Screener - UltimateXHello Everyone,
In this video, we have discussed on how to use our new Auto Harmonic Screener - UltimateX. We have covered the following topics.
Difference between Auto Harmonic Screener - UltimateX (Current script) and Auto Harmonic Pattern - UltimateX and how to use both the scripts together
Difference between Auto Harmonic Screener - UltimateX (Current script) and the existing screener Auto Harmonic Pattern - Screener which is built on request.security calls. We have discussed how the limitations of old script and how using the new script with Pine screener utility will help overcome those problems.
We have gone through the indicator settings (which are almost similar to that of Auto Harmonic Pattern UltimateX
Short demo on how to use the script with Pine Screener
Also check our existing video on How to use the new Pine Screener Utility.

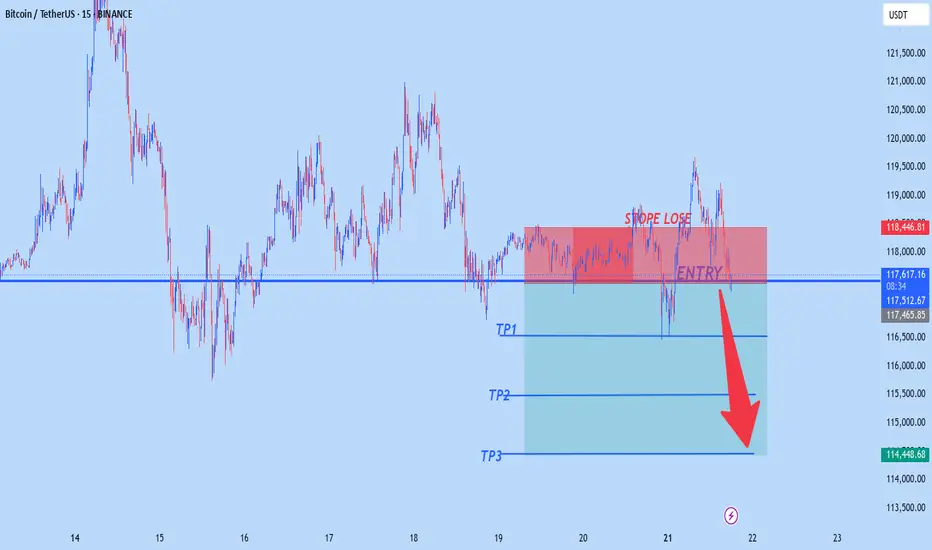
BTCUSD NEW LOOKBtc sell from117,500
tp 116,500
tp2 115,500
tp3 115,500
Stopelose 118,500
Trade at your own risk