BTC-USDT ShortHI
This is my idea aboute BTC zone , i'm lookine for Sell position in this zone , i think the market needs correction for next run ;)
this is my personal idea , and not commrtial advice .
MKHZ
BTCUSDT trade ideas
BTC - LTF Pattern IdentifiedIn our previous posts we were outlining the levels for a potential BTC pullback, but after some price development in this region it may be signaling a different story.
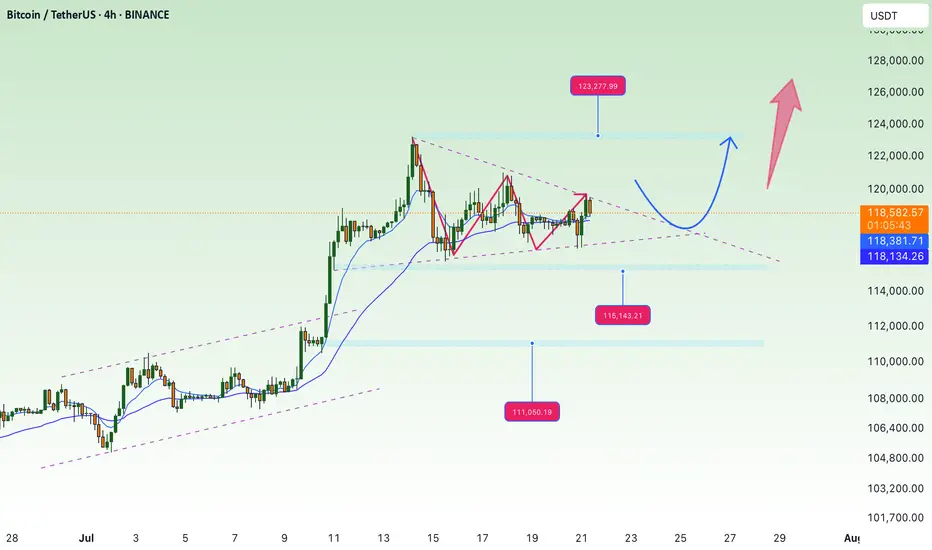
Since our high of $123k we have been forming a downwards sloping trendline of sell pressure (dotted white line). At the same time we have seen bulls continue to buy up the dips in our green box.
This has put price in some sort of symmetrical triangle that is currently testing the upper resistance level for a breakout.
If this breakout is successful then the first target would be $122.8k followed by a potential extended move up to around $130k.
If price fails to breakout and we drop below the LTF accumulation zone then the lower levels outline in the previous posts are still valid. For now monitor for a breakout to the upside.

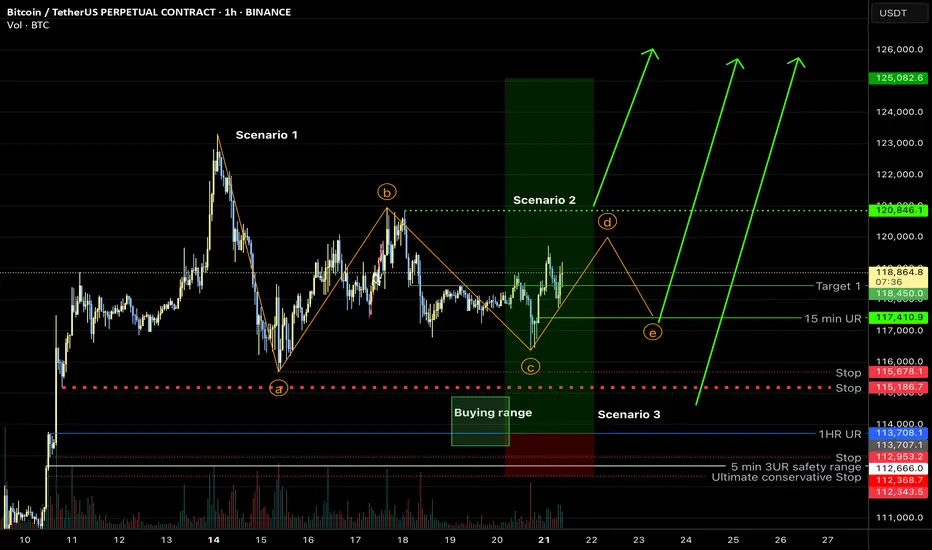
Bitcoin overall: sideways range, new ATH soonMy previous hypothesis of a sharp correction (scenario 3) looks to be incorrect. I believe the most likely corrective structure is a contracting triangle at this point (scenario 1), and the last leg should be bought for new ATH, however, it is also possible we had the last major low for this correction and new ATH are imminent (scenario 2)—which will be on the table if the indicated line gets taken out. In any case, new ATH should occur shortly!
BTC/USDT LONG SET UP (BITCOIN)Entry Price 1: $118,000
Entry Price 2: $116,500
Stop Loss: $115,000
Take Profit 1: $121,000 (Close 25%)
Take Profit 2: $124,000 (Close 50%)
Take Profit 3: $127,000 (Close 75%)
Take Profit 4: $130,000 (Close 100%)

Urgent Bitcoin Prediction: Longs Beware!!! Bitcoin longs should be careful, as we are below an important resistance and the market looks bearish. Wait for the confirmations I’ve shown in the video before making any moves! Trade professionally with a proper strategy and well-defined entry tactics!

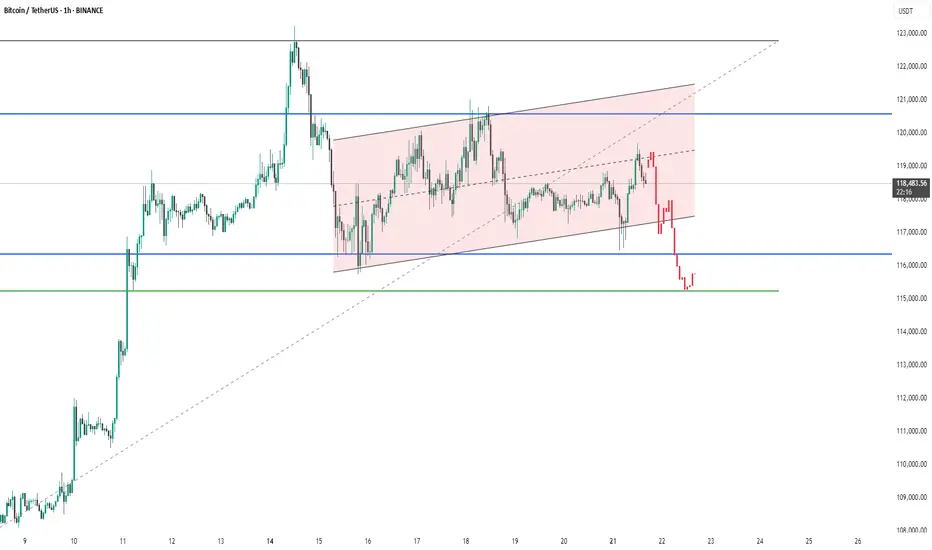
BTC #Bitcoin (BTC/USDT)chart shows on a 1-hour timeframeThe chart shows Bitcoin (BTC/USDT) on a 1-hour timeframe experiencing a breakdown from an ascending channel (highlighted in pink). After reaching resistance near $120,800, price sharply declined, breaking below both the channel support and the key horizontal support around $117,000 (blue line). It is now testing the next support zone around $115,000 (green line). This suggests strong bearish momentum, and if $115K fails to hold, further downside could be expected.
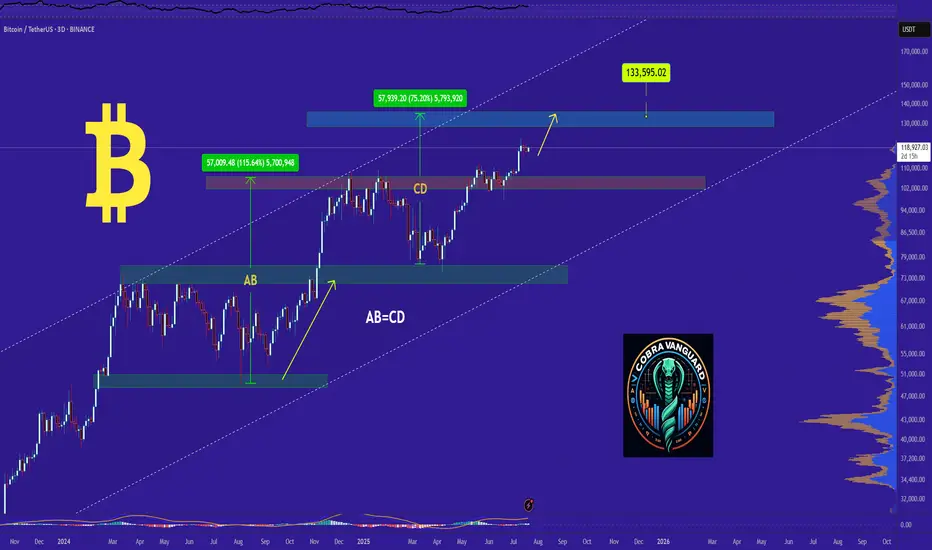
Bitcoin Eyes $145K, $195K, $255K in 2–6 YearsHello✌
Let’s analyze Bitcoin’s upcoming price potential 📈.
BINANCE:BTCUSDT , I expect a long-term upward bullish trend.
This analysis includes three main targets: $145,000, $195,000, and a final target of $255,000, which could potentially be reached within 2 to 6 years.
The price may form parallel channels at different stages, which are shown on the chart. I also expect the current upward bullish channel to remain valid and continue moving higher.
✨We put love into every post!
Your support inspires us 💛 Drop a comment we’d love to hear from you! Thanks , Mad Whale🐋
🐋Many of the points and levels shown on the chart are based on personal experience, feeling, and over 7 years of research and daily study of crypto charts.
Some of the lines, channels, and price zones are drawn to make the chart easier to understand and to help imagine possible future price movements.
I’ve also included one very big drop in price even bigger than the others because in the crypto market, it’s common for prices to suddenly fall hard and push out small investors and traders with positions.
The targets on the chart are not guaranteed; they might be reached, or they might not.📚
📜Please make sure to do your own research before investing, and review the disclaimer provided at the end of each post.

BTC AI Prediction Dashboard - 6h Price Path (21.07.25)
Prediction made using Crypticorn AI Prediction Dashboard
Link in bio
BTCUSDT Forecast:
Crypticorn AI Prediction Dashboard Projects 6h Price Path (Forward-Only)
Forecast timestamp: ~11:00 UTC
Timeframe: 15m
Prediction horizon: 6 hours
Model output:
Central estimate (blue line): -118,199
Represents the AI’s best estimate of BTC’s near-term price direction.
80% confidence band (light blue): 117,911 – 119,052
The light blue zone marks the 80% confidence range — the most likely area for price to close
40% confidence band (dark blue): 117,725 – 119,983
The dark blue zone shows the narrower 40% confidence range, where price is expected to stay with higher concentration
Volume on signal bar: 151.81
This chart shows a short-term Bitcoin price forecast using AI-generated confidence zones.
Candlesticks reflect actual BTC/USDT price action in 15-minute intervals.
This helps visualize expected volatility and potential price zones in the short term.

accumulate, continue to aim for new ATH💎 Update Plan BTC (July 21)
Notable news about BTC
CEO of Charles Schwab, Rick Wurster, said the company plans to deploy Bitcoin and Ethereum transactions for customers.
This company aims to compete with Coinbase, where customers buy BTC.
This development takes place after the progress of cryptocurrencies when President Donald Trump signs the Genius bill into law.
In an interview on Friday, the CEO of Charles Schwab, Rick Wurster, said the company plans to launch Bitcoin (BTC) and Ethereum (ETH) to compete with Coinbase cryptocurrencies. The move took place after President Donald Trump signed the Genius bill, officially confirming the first cryptocurrency law in the United States.
Technical analysis angle
🟠 Main trend:
BTC is sideway accumulated in the amplitude of 117,000 - 122,000 after a sharp increase.
The chart shows the descending triangular model - a potential sign for Breakout.
🔍 important areas:
Resist:
122,000 - 122,700: Strong resistance area, fibonacci mold 1.0.
130,600 - 131,100: The expected area if Breakout is successful (Fibonacci extension 1.618).
Support:
116,000: Support close, coincide with EMA 200.
111,100: The support area is stronger if the current support breaks.
✅ Scenario 1 - Rise:
If the price turns from supporting 116k → Test the resistance area of 122k.
If the 122K break is definitive, the next goal is 130k - 131k.
❌ Scenario 2 - Discount:
If the 116k area is lost, the possibility of falling will fall more deeply at 111k.
This is also the strong EMA area Fibo 0.382 of the previous wave.
Please follow the channel to receive the latest and continuous updates on XauUSD, currency and BTC
Bullish Multi-Timeframe Alignment, Macro Risks & Key Levels__________________________________________________________________________________
Technical Overview – Summary Points
__________________________________________________________________________________
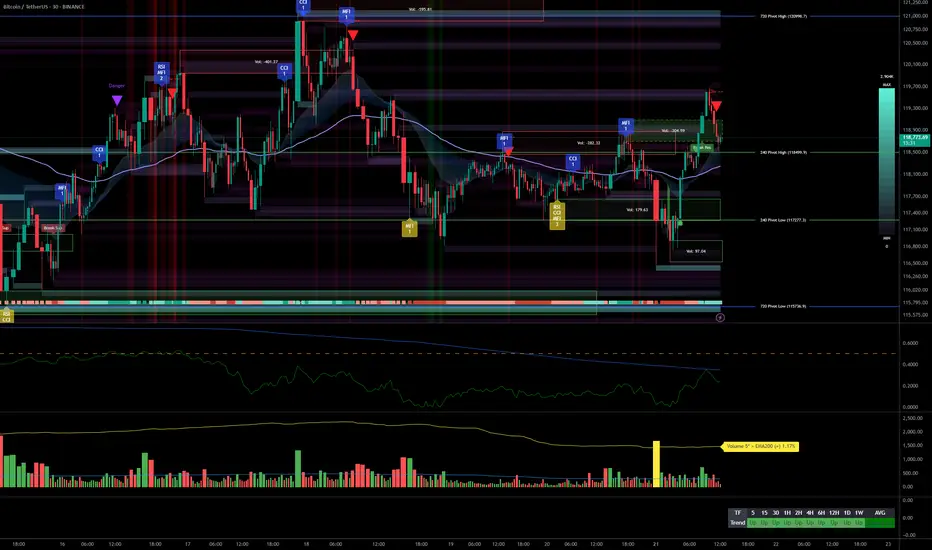
Momentum: Strong bullish trend across all timeframes.
Major Supports: 115796/117277 (720/240 Pivot Low).
Key Resistances: 119000–123200 (240/D Pivot High), watch for potential extension or profit-taking.
Volume: Healthy participation, no marked anomalies.
Risk On / Risk Off Indicator: Strong sector momentum except 15min (neutral), risk appetite confirmed.
Multi-TF Behavior Synthesis: No "behavioral sell" warning, ISPD DIV neutral, no climax.
__________________________________________________________________________________
Strategic Summary
__________________________________________________________________________________
Global Bias: Clearly bullish, all timeframes aligned, no notable technical divergences.
Opportunities: Buy on pullback (HTF support) or on breakout/consolidation above 123200 with increasing bullish volume.
Risk Zones: Drop below 115796 invalidates scenario; watch for “sell” behavioral signals (ISPD red/extreme volumes) or persistent sector divergence.
Macro Catalysts: Next Fed meeting (July 21st), ongoing geopolitical tensions.
Action Plan: Closely monitor supports/resistances, strict stops below 115796, dynamic adjustment to upcoming macro volatility.
__________________________________________________________________________________
Multi-Timeframe Analysis
__________________________________________________________________________________
1D: Bullish breakout, leading tech/growth sector, stable volume.
12H: Bullish signal, price held above all key HTF pivots.
6H: Consolidation below key resistance 123218, no distribution, strength intact.
4H: Sideways just below resistance, controlled pause, possible push upwards.
2H: Stalling under resistance yet bullish momentum still present.
1H: Supports defended, rising volume on rebounds, no excess.
30min: Intraday momentum positive; no signs of reversal, strong indicator consensus.
15min: Testing pivots, slight momentum decline, neutral on Risk On / Risk Off Indicator.
__________________________________________________________________________________
Technical confluence: All timeframes aligned upward, strong sector momentum, controlled volumes, no behavioral excess. Watch for resolution near the 119000–123200 resistance zone (potential supply), and monitor for alert signals on behavioral/volume side. Macro: anticipate volatility around July 21 (Fed).
__________________________________________________________________________________
Macro & Decision Synthesis
__________________________________________________________________________________
News / Macro: Upcoming Fed meeting = caution period, expected volatility spike. Geopolitics: Middle East/Europe tensions, no Asian shock.
On-chain: BTC in price discovery, initial STH profit-taking, everyone in latent profit (interim top risk if overheated, reward up to $130k possible).
Actionable checklist:
Optimal entry: Pullback on 115796–117277 or strong breakout above 123200 with confirmed volume
Stop-loss: Below 115796 (major pivot); intraday swings below 117277
Imperative risk management, avoid leveraged trades ahead of macro event
__________________________________________________________________________________
Final Conclusion
__________________________________________________________________________________
Bitcoin is structurally bullish, supported by perfect multi-timeframe alignment, strong sector leadership (Risk On / Risk Off Indicator), and positive on-chain signals. However, proximity to historical resistances and looming volatility call for strict, active risk management. Targets: $123k/$130k; stops below 115796.
BTCUSDTBitcoin, in case of protection of the long zone, will go to the final breakout to this peak. My vision of the situation and possible risks of short positions from the current ones. The scenario changes when the 0.5 zone is broken

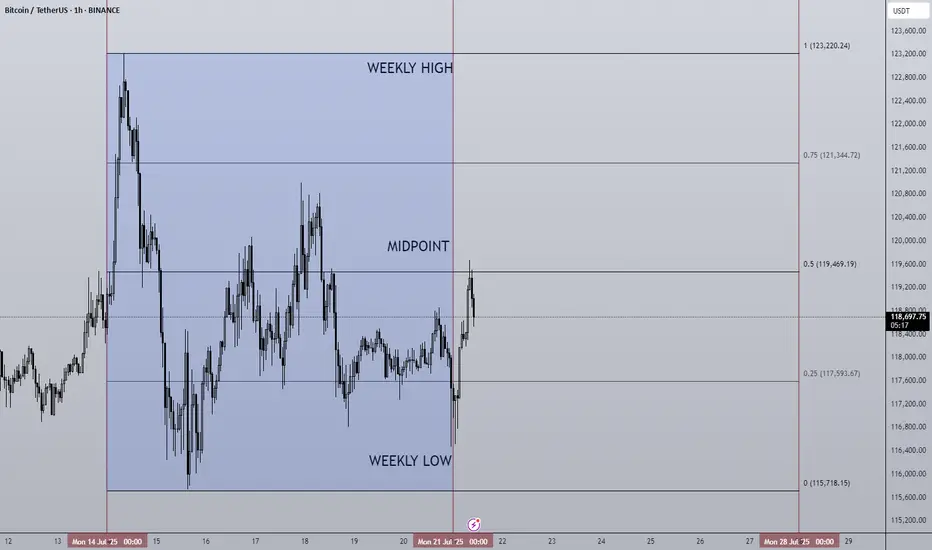
21/07/25 Weekly OutlookLast weeks high: $123,220.24
Last weeks low: $115,718.15
Midpoint: $119,469.19
New BTC ($123,220) & SPX ($6,315) ATH last week! We're really seeing progress being made on all fronts now, bitcoin saw its sixth week of net inflows into BTC ETFs ($2.39B).
The week began strong hitting the new ATH very early and then settled into a tight range to cool off. Altcoins however surged in relation to BTC to break out of HTF downtrends and begin to make up lost ground. One of the beneficiary's of this price movement has been ETH, breaking out from a multi year downtrend against BTC and hitting $3,800 in its USD pair.
For this week I do expect much of the same for BTC as momentum is with altcoins for now. However, as those altcoins reach HTF resistance levels it becomes very important for Bitcoins chop to be accumulation for the next leg up and not distribution for the way down. With so few pullbacks the threat of a sudden correction is present but the probability drops should BTC look to press higher with strong demand.
The ECB Interest rate decision takes place on Thursday but no changes to the 2.15% rate is forecast. In terms of news there are no planned upsets that I can see.
Good luck this week everybody!
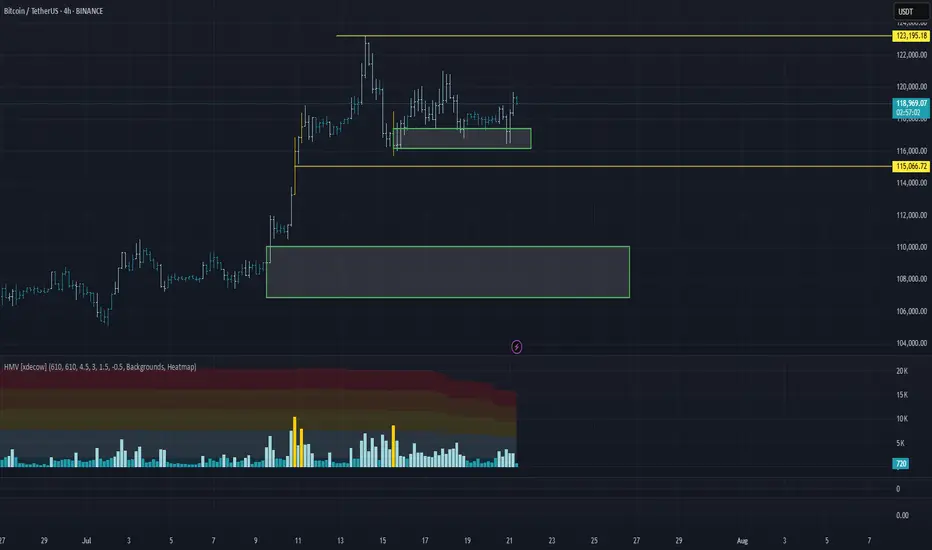
Bitcoin Trading Update: Consolidation, Patterns, and What's NextHey Fellow Traders! 👋
Bitcoin (BTC) has been on a wild ride after hitting its all-time high (ATH)! 📈 Since then, it’s been consolidating, generating liquidity, and setting the stage for the next big move. Meanwhile, altcoins are absolutely booming, stealing the spotlight! 💥 As we kick off the week, let’s dive into what’s happening with BTC and what to watch for.
📊 Technical Analysis Breakdown
Here’s what I’m seeing on the charts:
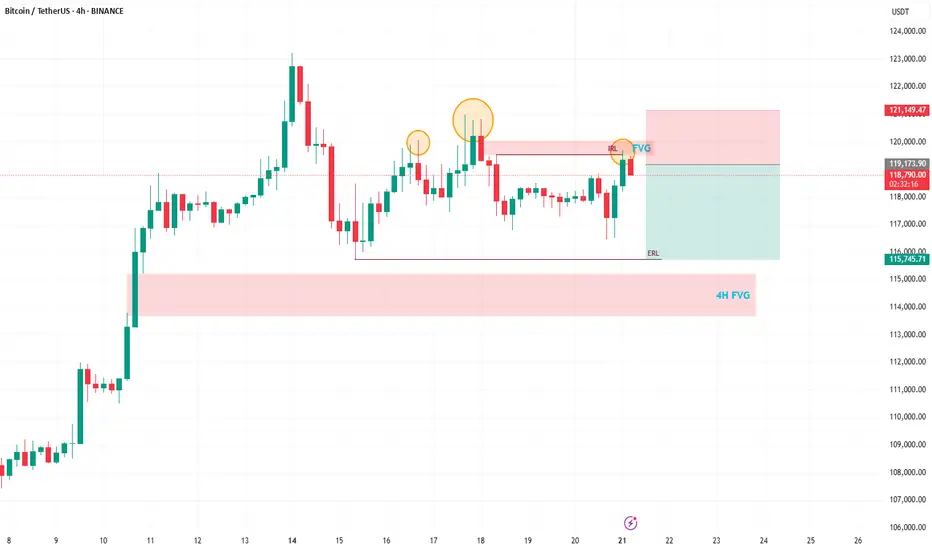
Head and Shoulders Pattern: A clear head and shoulders has formed on BTC, signaling a potential bearish move. 🐻
Daily Timeframe Order Blocks: These are in play, showing key levels of support and resistance.
Filled Fair Value Gap (FVG): A recent FVG on the daily chart has been filled, but there’s still a beautiful 4H FVG waiting to be tested below.
Liquidity Sweep: After the ATH, BTC needs to clear the liquidity from the past few days before it can push for new highs.
🔍 What’s Next for BTC?
I’m expecting a bearish reaction in the near term, with BTC targeting the sell-side liquidity around $115,800. This move should also fill the 4H FVG, setting the stage for a potential bounce and another shot at the ATH. 🚪 Keep an eye on these levels, as they’ll be critical for the next big move!
🔔 Stay in the Loop!
Let’s keep the conversation going! 💬 Follow for more updates, like if you found this helpful, and drop a comment with your thoughts or what you’re seeing in the markets. Are you trading BTC or riding the altcoin wave? Let’s hear it! 👇
Happy trading, and let’s make this week count! 💪
#Crypto #Bitcoin #Trading #TechnicalAnalysis
Market overview
WHAT HAPPENED?
Last week, after updating the historical maximum, bitcoin went into correction for the first time, after which it went sideways.
At the moment, the $117,300 – $116,300 zone has been retested (strong absorption of sales) and an active reaction from buyers has been received.
Within the current flat, the cumulative delta supports buyers, indicating the absorption of market sales. At the same time, the global wave structure on the 4H chart casts doubt on the last wave of buys, as we’ve rapidly adjusted back to its beginning.
💼 WHAT WILL HAPPEN: OR NOT?
We expect to exit the sideways at $116,000 – $121,000 in an upward direction from the current levels, either through capturing liquidity and testing the pushing volume zone at $115,000.
The target is the last ATH, which is $123,200. A re-correction is possible near $123,200, resulting in a wider flat range of $123,200 to $115,000. If there is a true breakout, we can expect the continuation of the global long trend.
Buy Zones:
~$115,000 (zone of initiating/pushing volumes)
$110,000–$107,000 (accumulated volume)
📰 IMPORTANT DATES
Macroeconomic events this week:
• Tuesday, July 22, 12:30 (UTC) — speech by Fed Chairman Jerome Powell;
• Wednesday, July 23, 14:00 (UTC) — publication of data on US second-hand housing sales for June;
• Thursday, July 24, 12:15 (UTC) — announcement of the deposit rate for July and the interest rate decision in the Eurozone;
• Thursday, July 24, 12:30 (UTC) — publication of the number of initial applications for unemployment benefits in the United States;
• Thursday, July 24, 12:45 (UTC) — press conference of the European Central Bank;
• Thursday, July 24, 13:45 (UTC) — publication of business activity indices (PMI) in the manufacturing and services sectors of the United States for July;
• Thursday, July 24, 14:00 (UTC) — publication of data on new home sales in the United States for June.
*This post is not a financial recommendation. Make decisions based on your own experience.
#analytics
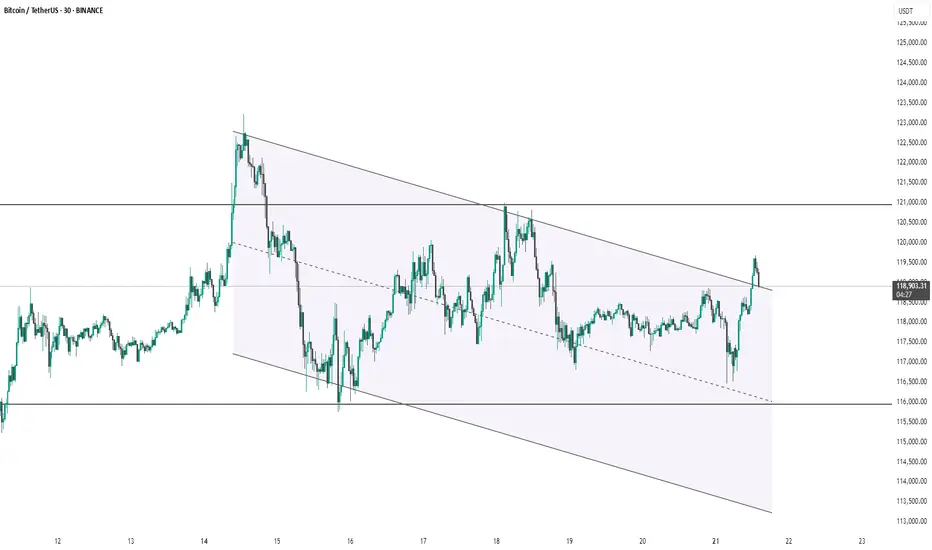
BTC #Bitcoin (BTC/USDT) 30-minute chartThis Bitcoin (BTC/USDT) 30-minute chart shows price action within a descending parallel channel. Recently, the price broke out above the channel's upper boundary, suggesting a potential bullish breakout. However, the price has slightly pulled back, now retesting the breakout zone near $119,000. Holding above this level may confirm the breakout and lead to further upside, while failure to hold could signal a false breakout and potential return into the channel. Key support and resistance levels are marked around $116,000 and $121,000 respectively.
thanking you
Bitcoin (BTC): Bullish Start of Week | Aiming For $150KChoppy weekends resulted in a bullish Monday. Once again, we are seeing strong buyside dominance at the start of the week, which is indicating a potential new ATH that we might be going for.
Now as the price is at the $119-120K zone, we are most likely going for a retest today of the current ATH, where we are going to look for some kind of breakout and upward movement.
Markets are on fire, so stay informed and do not FOMO—there will always be plenty of opportunities to gain something from markets, but to lose all it takes is just one stupid decision, so don't FOMO.
Swallow Academy

BTC 4H Structure Break – Long Bias with Conditions🚀 BTC (Bitcoin) has clearly broken bullish market structure on the 4-hour timeframe.
📈 My bias is to ride the momentum and look for a pullback to enter long.
✅ I follow a specific entry criteria — price must pull back into the imbalance, find support, and then form a bullish break of structure on a 15m chart to trigger an entry.
❌ If that setup doesn't play out, we simply abandon the idea.
⚠️ This is not financial advice.

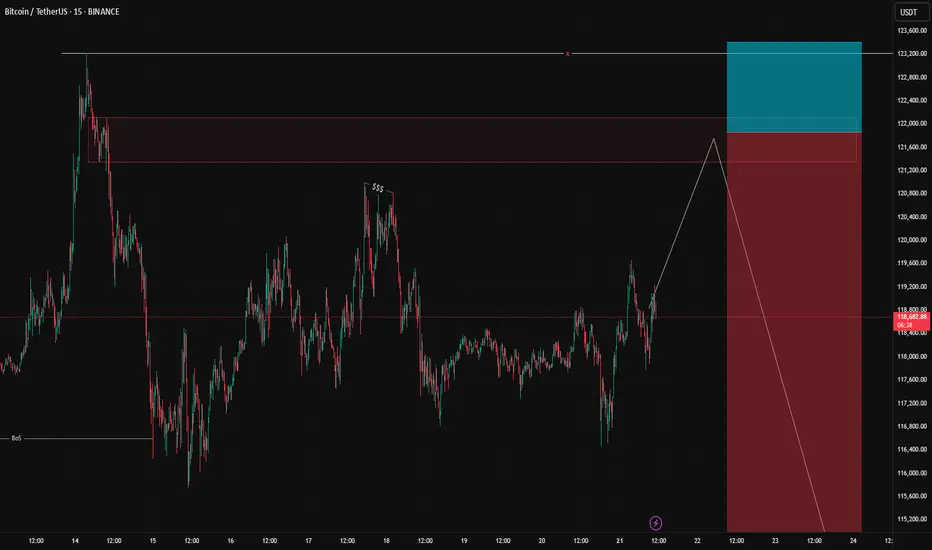
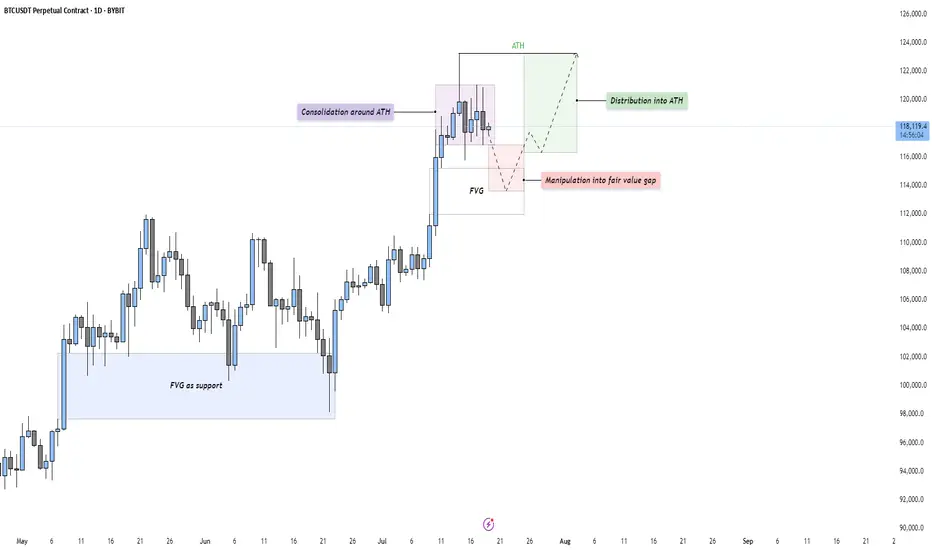
BTC - Consolidation, Manipulation & DistributionMarket Context
After a strong impulsive rally, Bitcoin is currently consolidating just beneath its All-Time High (ATH). This type of consolidation following an extended move higher often indicates indecision in the market — a pause that either leads to continuation or reversal. The current structure suggests that price is building energy for the next leg.
Consolidation and Liquidity Above ATH
The price action is tight and sideways around the ATH, which likely means liquidity is building above. Many stop-losses and breakout orders are sitting just overhead — classic conditions for a Buy Side Liquidity Sweep. This range may serve as a trap for early breakout traders, providing an opportunity for smart money to manipulate price lower before taking it higher.
Fair Value Gap Retest Scenario
Below the current range, we see a Daily Fair Value Gap that aligns with prior bullish imbalances. A move down into this Gap would represent a manipulation phase — shaking out weak longs before rebounding. The Gap also acts as a potential support level where buyers might be waiting. If price reaches into this zone and reacts strongly, it may offer a high-probability long setup.
Distribution or Reaccumulation?
While this could be interpreted as distribution beneath resistance, it’s equally valid to consider it a reaccumulation phase — a temporary markdown into demand before a fresh expansion. If the market dips into the Gap and quickly reclaims the range, it opens the door for a clean breakout above the ATH and continuation toward the 124,000–126,000 region.
Final Thoughts
Price rarely moves in a straight line. It pauses, retraces, and often tricks participants before making the real move. This type of consolidation presents opportunity — but also demands patience and clarity.
If you found this breakdown insightful, a like would be much appreciated! And I’d love to hear your thoughts in the comments — are we about to sweep down into demand, or is the rocket already on the launchpad?
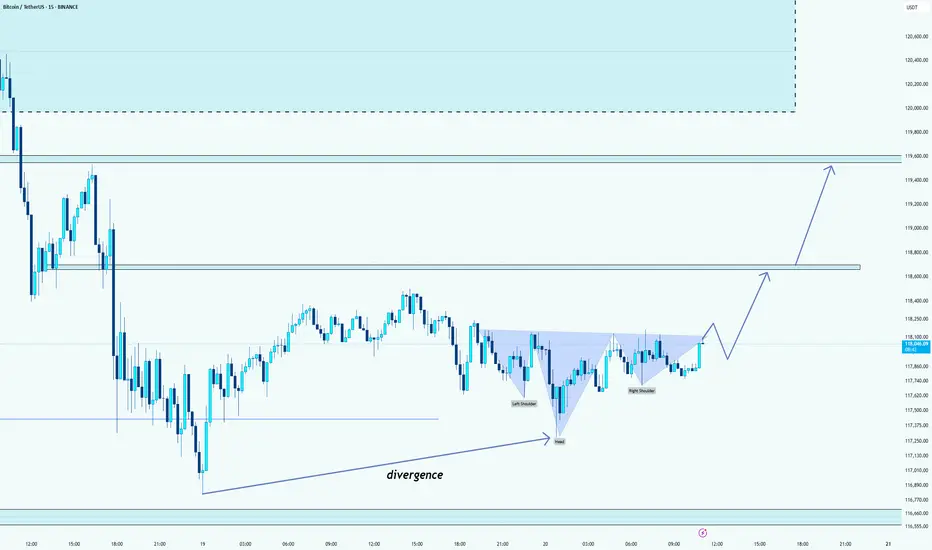
BTC: a Head and shoulders patternHello guys!
As you can see, a Head and shoulders and a divergence formed!
We can expect the price to rise until those two levels that I pointed out!
If the neckline breakout gets a long in retracements!
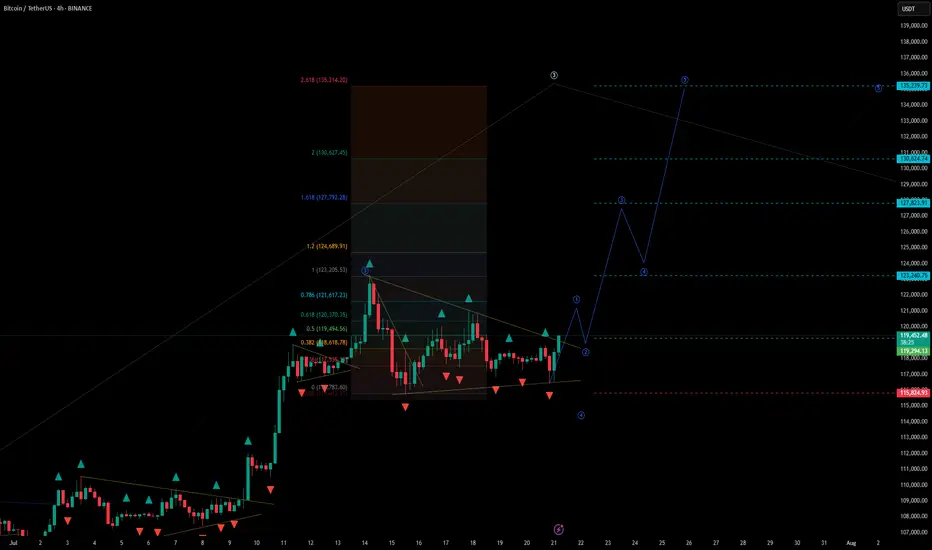
BTCUSDT - UniverseMetta - Signal#BTCUSDT - UniverseMetta - Signal
H4 - Formation of a triangular formation in continuation of the trend, for a more confident entry you can wait for a retest and formation of the 3rd wave. Stop behind the minimum of the 1st wave.
Entry: 119294.13
TP: 123240.75 - 127823.91 - 130624.74 - 135239.73
Stop: 115824.93
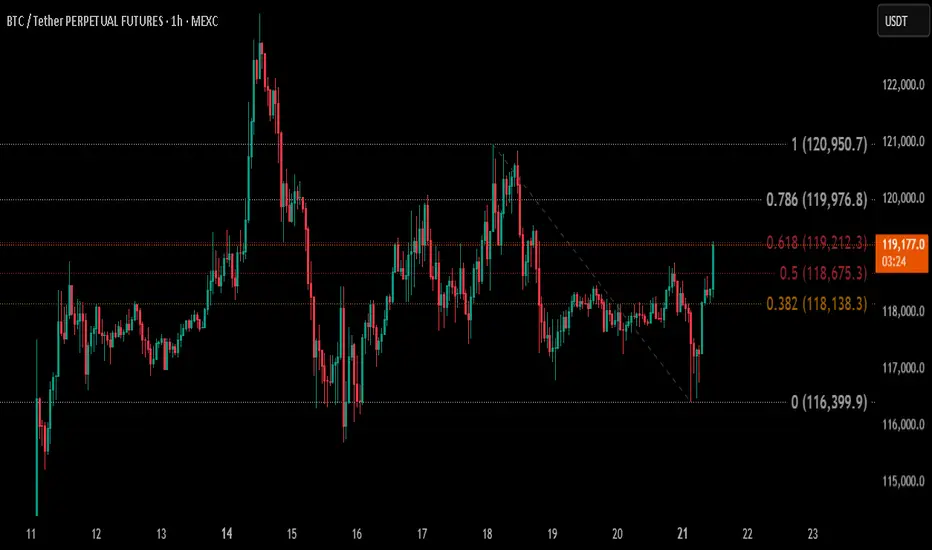
BTC/USDT – Fibonacci Levels in PlayMEXC:BTCUSDT.P
🔹 Price pushing through key resistance zones
BTC just tapped the 0.618 Fibonacci level (119,212) after breaking above 0.5 — signaling strength in short-term momentum. If bulls can hold above this level, the next logical targets are:
➡️ TP1: 119,976 (0.786)
➡️ TP2: 120,950 (Full retracement)
🔸 Key Support: 118,675
🔸 Invalidation below: 118,500
Holding above the golden zone (0.618) increases the probability for a full move toward 121K. Watching price reaction closely here — breakout or rejection will decide the next leg.
🔄 Keep supporting by sharing and dropping your thoughts!
🚀 And don’t forget to hit that Boost button – it helps and motivates me to keep bringing top-level analysis for you all 🙌
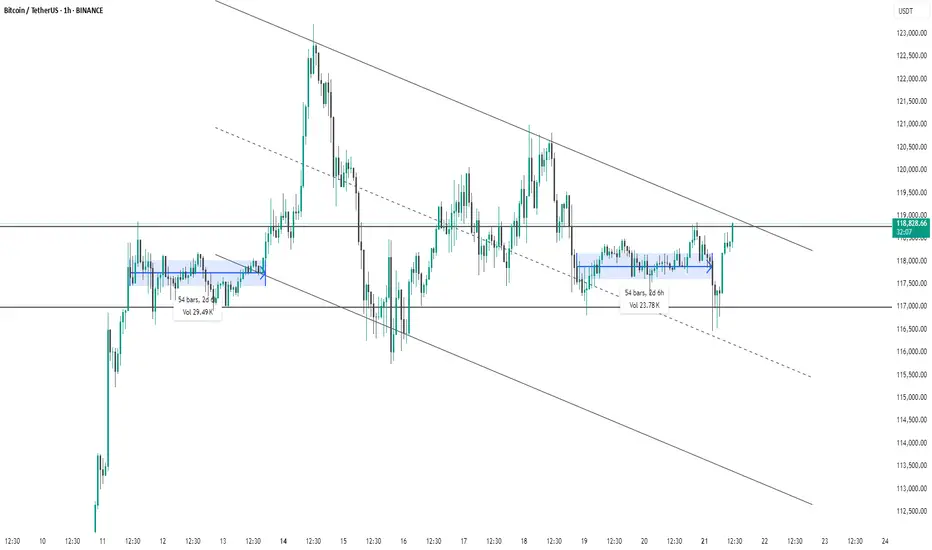
BTC #1-hour chart of Bitcoin/USDTThis 1-hour chart of Bitcoin/USDT (Binance) shows a descending channel pattern with clearly defined upper and lower trendlines. Price has recently broken out of a consolidation zone (highlighted in blue) and is now testing the upper boundary of the descending channel near $119,000. The breakout from the recent range (lasting 54 bars / 2d 6h with 23.78K volume) suggests bullish momentum. However, for confirmation of trend reversal, a strong breakout above the channel is needed. Until then, the broader downtrend structure remains intact.
thanking you