BTC Weekly Recap & Outlook 20/07/2025📈 BTC Weekly Recap & Outlook
Market Context:
Price continued its bullish momentum, fueled by institutional demand and supportive U.S. policy outlook.
We captured solid profits by following the game plan I shared earlier (see linked chart below).
🔍 Technical Analysis
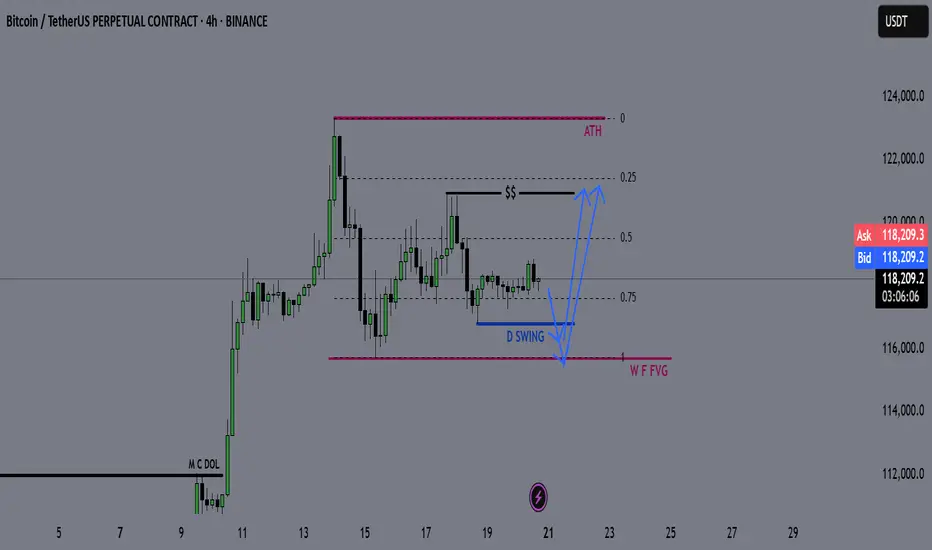
✅ BTC made a strong bullish move, breaking into new all-time highs.
📊 The daily RSI entered overbought territory, which signaled the potential for a short-term retracement or consolidation.
Currently, price is ranging, and RSI is cooling off. That tells me the market is likely building energy for the next leg up — but not before a significant liquidity run.
🎯 Game Plan
I'm watching for one of two potential setups:
1️⃣ Liquidity Sweep to the Downside
- A run of the daily swing low
- Into the most discounted range (0.75 Fib zone)
OR
2️⃣ Tap into the Weekly FVG Zone (marked with the purple line)
Either move would create the liquidity and energy needed to fuel a breakout above the equal highs (EQHs) marked by the black line.
🚀 Target
First Target: EQHs (Black Line)
Second Target: Price Discovery (new ATHs)
💬 Let me know your thoughts or drop your own chart ideas below!
📌 Follow for Weekly Recaps & Game Plans
If you found this useful, make sure to follow for weekly BTC updates, market outlooks, and detailed trade plans based on structure and liquidity.
BTCUSDT trade ideas
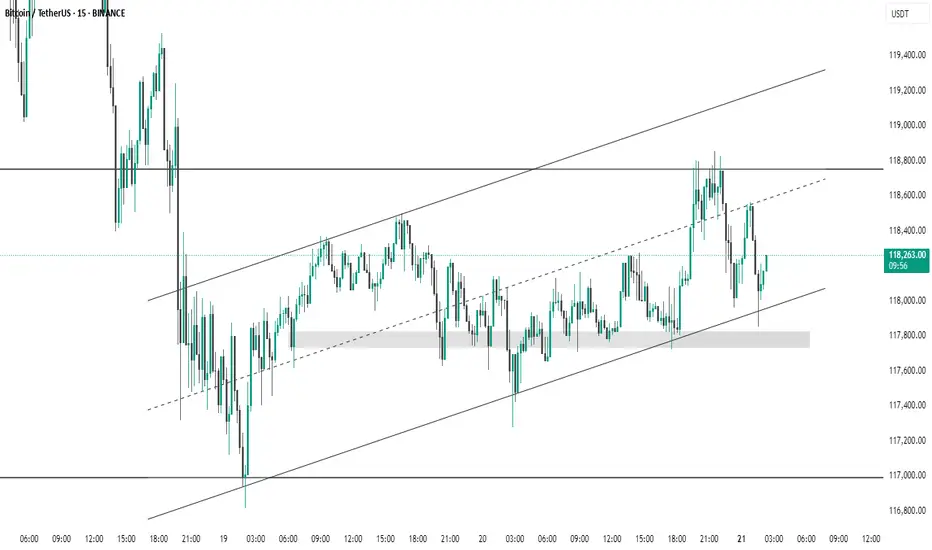
BTC #15-minute BTC/USDT chart This 15-minute BTC/USDT chart from Binance shows Bitcoin trading within an ascending channel. Price recently bounced off the lower trendline and a highlighted demand zone around 117,800 USDT, suggesting strong support. The upper channel and resistance near 118,800 USDT may act as potential targets. Short-term momentum appears bullish as long as price holds above the support trendline.
BTCUSDTBTCUSDT Updated in H1 :
The gold signal is marked on the chart based on the latest price changes and the supply and demand in the market. These points include the entry point, stop loss, and take profit

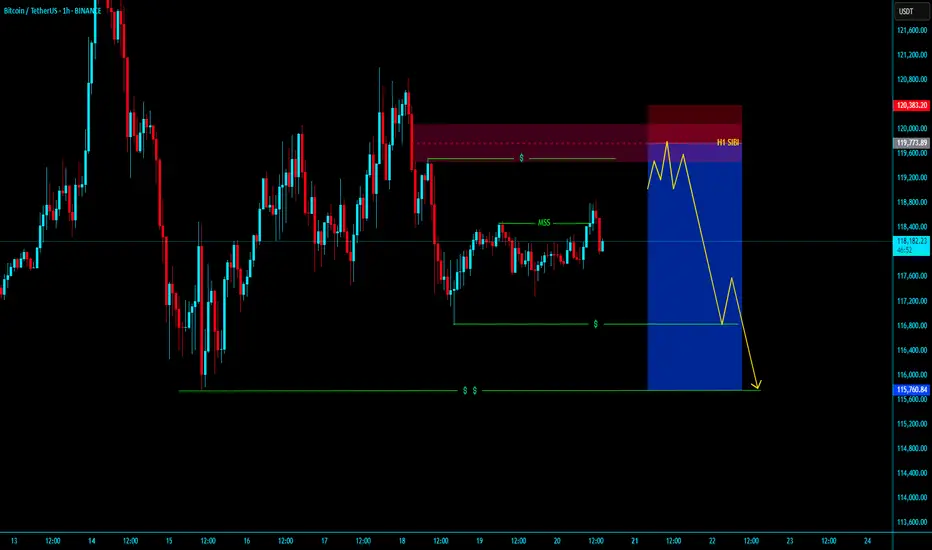
BTCUSDT BEARISH H1 SIBI SELL SHOTBTCUSDT BEARISH H1 SIBI SELL SHOT
Market is Bullesh Right now market is going to h1 sibi in LTF with valid mss with valid obi
entyr with tight sl and Target is our nearest Liquidity .....enjoyyyyyyyyyyy
KGB Priyabrat Behera
ICT Trader & Advance Mapping SMC Trader
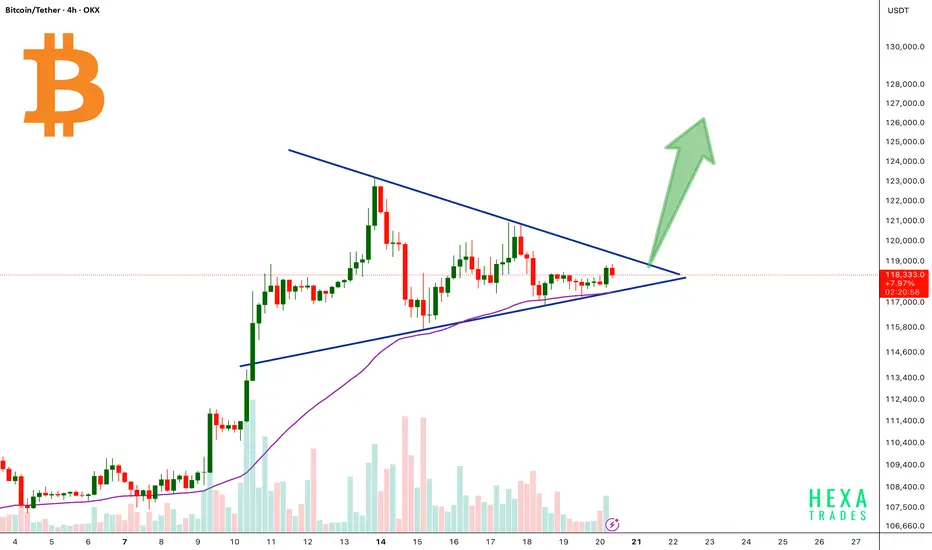
BTC Forming Bullish Triangle!Bitcoin is currently consolidating inside a symmetrical triangle pattern after a strong bullish rally. The price is approaching the apex of the triangle, signaling a potential breakout soon.
The 50 EMA is acting as dynamic support, perfectly aligned with the triangle’s lower trendline, reinforcing the bullish structure.
A confirmed breakout above the triangle resistance could trigger a strong upward move, with a potential target near the $125,000–$130,000 zone.
Cheers
Hexa
BINANCE:BTCUSDT CRYPTOCAP:BTC
Bitcoin Price Could test resistance 120K After DeclineBitcoin is consolidating within a range — not showing strong directional momentum yet — and is testing the resistance zone between 120K and 121K.
This is a critical supply zone, where buyers were previously liquidated. It’s a psychological level and might trigger profit-taking or heavy resistance from sellers. If BTC fails to break and hold above the 121K zone, there’s a high probability of a pullback toward the 116.2K–117K area to grab liquidity before a new move.
Former President Donald Trump signing new crypto laws could introduce market-moving fundamentals. However, the impact on price will depend on the content of those regulations:
You may find more details in the chart Ps Support with like and comments for better work.

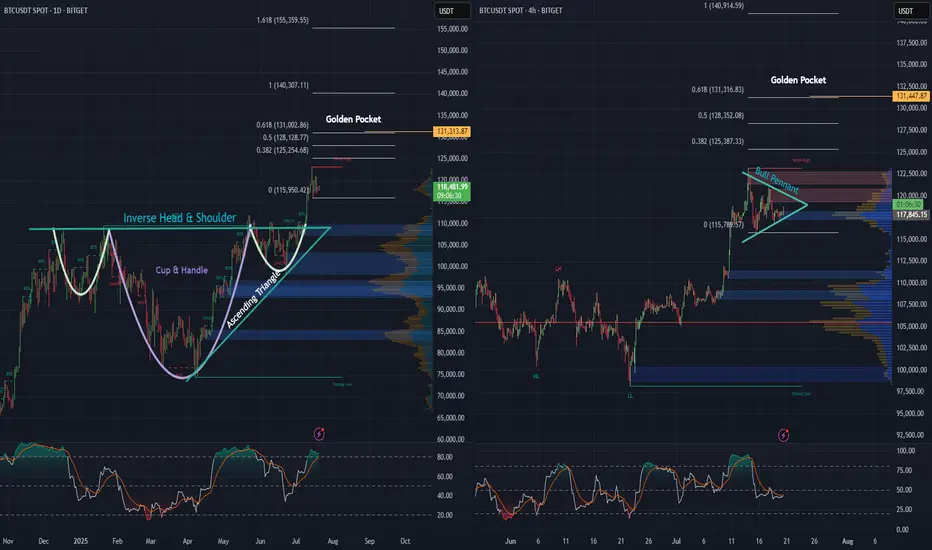
BTC daily, and 4 hr. Bullish Patterns Stack Up!Looking at the Daily and 4-hour charts for BTC, we can see multiple bullish formations unfolding.
An inverse head and shoulders - daily
A cup and handle - daily
An ascending triangle - daily
Price action looks strong, as we’ve begun the breakout from the neckline on the inverse H&S, as well as the cup and handle and ascending triangle simultaneously, and momentum is building fast.
Also, on the 4-hour chart, there’s a pretty substantial bull pennant taking shape. A breakout here could be the next leg up, and the push needed to keep momentum alive.
Zooming out, when we apply the trend-based Fibonacci extension, it reveals a $131,000 golden pocket, on both the the daily as well as the 4 hr. And that could be a major upside target if these bullish structures hold.
Stay tuned to see if BTC continues its move and sets a new all-time high.
Bitcoin: Promising Patterns and Potential BreakoutBitcoin's recent price action has been nothing short of captivating for traders and analysts alike. On the daily chart, we've observed the formation of an Inverse Head & Shoulders and a Cup & Handle pattern, both of which have now transitioned into a Bull Flag. These bullish signals suggest a strong potential for upward movement.
Zooming into the 4-hour and 1-hour charts, we can see prominent Ascending Triangles taking shape. These patterns are often harbingers of significant breakouts, and it appears that Bitcoin is winding up for a substantial move.
Moreover, when utilizing a Trend-based Fibonacci Extension on the daily timeframe, the golden pocket points to a target of $126k, with the next pocket at $185k. This aligns with historical data and technical indicators, suggesting that Bitcoin might be poised to rewrite history once again.
Stay tuned as we monitor these developments and anticipate what could be a historic breakout for Bitcoin!


Btcusd trade ideaWen those candles moves like that they just wanna fill those imbalances on htf and use the opportunity to grab fuel for the next move, no cause for alarm just my pov tho

TradeCityPro | Bitcoin Daily Analysis #132👋 Welcome to TradeCity Pro!
Let’s dive into the Bitcoin analysis and key crypto indices. As usual, in this analysis I’ll review the futures triggers for the New York session.
📅 1-Hour timeframe
On the 1-Hour timeframe, as you can see, Bitcoin is still holding the key support at 116829 and has been ranging between 116829 and 118440 since yesterday.
✨ Today, if the 118440 level breaks, we can open a solid long position. However, I still believe that due to Bitcoin Dominance being in a downtrend, altcoins are a much better choice for opening positions.
✔️ If you're only planning to trade Bitcoin, this trigger is suitable. The next entry points would be 120594 and 122733. If we open positions at all three triggers and the market moves upward, we can get strong risk-to-reward setups since we’ve entered with significant volume across three positions.
📊 If the 116829 level breaks downward, we might see sharper corrections. In that case, the next supports will be the 0.5 and 0.618 Fibonacci levels.
👑 BTC.D Analysis
Looking at Bitcoin Dominance, as you can see, the trend is heavily bearish and moving downward.
⭐ The downtrend in dominance is quite steep, and the next support we have is at 60.49. There’s still room for dominance to drop to this level.
📅 Total2 Analysis
Moving to Total2, yesterday the 1.46 trigger was activated and price moved to 1.5, and it is now sitting just below that level.
💫 If this level breaks, another bullish wave towards 1.62 could form.
📅 USDT.D Analysis
Looking at Tether Dominance, this index is also in a downtrend similar to Bitcoin Dominance, which shows that money is exiting both Bitcoin and Tether and entering altcoins.
🎲 So keep a close eye on altcoins in the coming days, because a lot of capital is flowing into them and they could see significant pumps.
❌ Disclaimer ❌
Trading futures is highly risky and dangerous. If you're not an expert, these triggers may not be suitable for you. You should first learn risk and capital management. You can also use the educational content from this channel.
Finally, these triggers reflect my personal opinions on price action, and the market may move completely against this analysis. So, do your own research before opening any position.

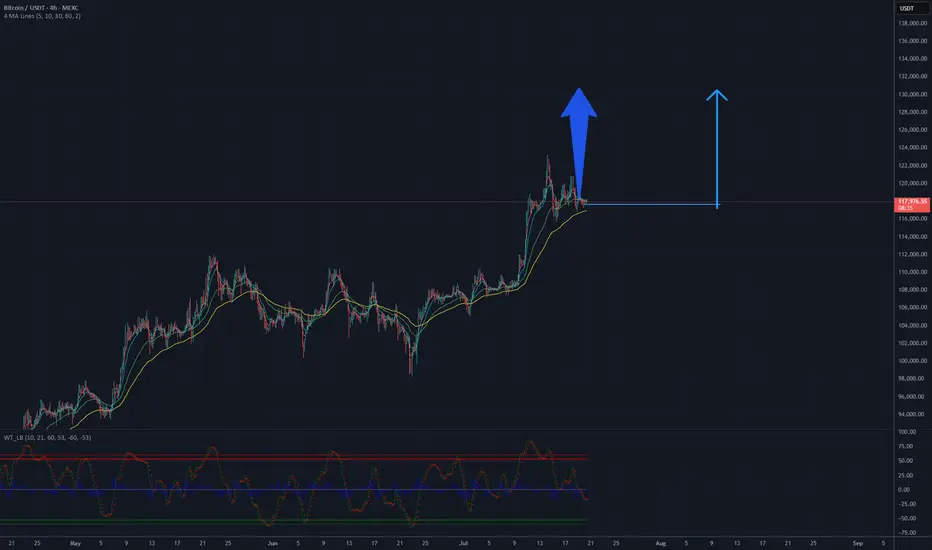
BTC will be 130 K USD? Potential target 130 000 USDAnalysis of the Bitcoin (BTC/USDT) chart on the MEXC platform indicates a positive upward trend. The price is currently hovering around $117,823, with clear support at approximately $100,000, as confirmed by the lower channel line. Moving averages (MA) suggest a sustained upward trend, and the trend line drawn from the lows points to potential for further growth. The current resistance is in the $120,000-$125,000 range, but if momentum holds and this level is breached, the price could head toward $130,000 in the short to medium term. It is recommended to monitor volume and key support and resistance levels to confirm further upward movement.
Potential TP: 130 000 $
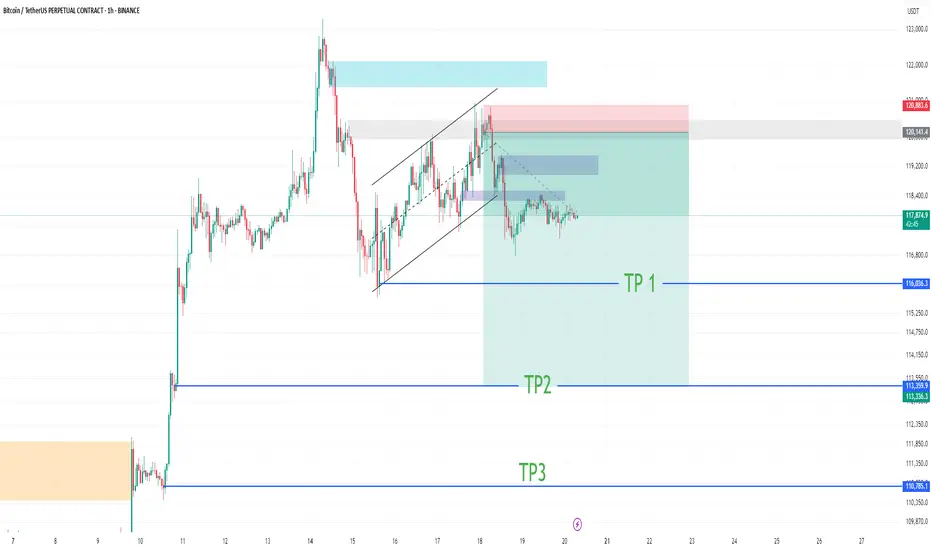
BTCUSD SHORT POSITION = SELLWe can see that BTCUSD consolidated a and ended up given us a possible sell.
To my point of view, we can take a sell position at an Entry = 117878.44 with a proper calculated risk of a SL = 118285.00.
With this short position we can expect to take our profits at the following zones:
TP1: 117509.65
TP2: 117386.65
TP3: 117267.62
TP4: 117066.41
The takes profits are a calculated Risk Reward Ratio of 1.00 to 2.00
It is advisable to use a small lot size or according to your account

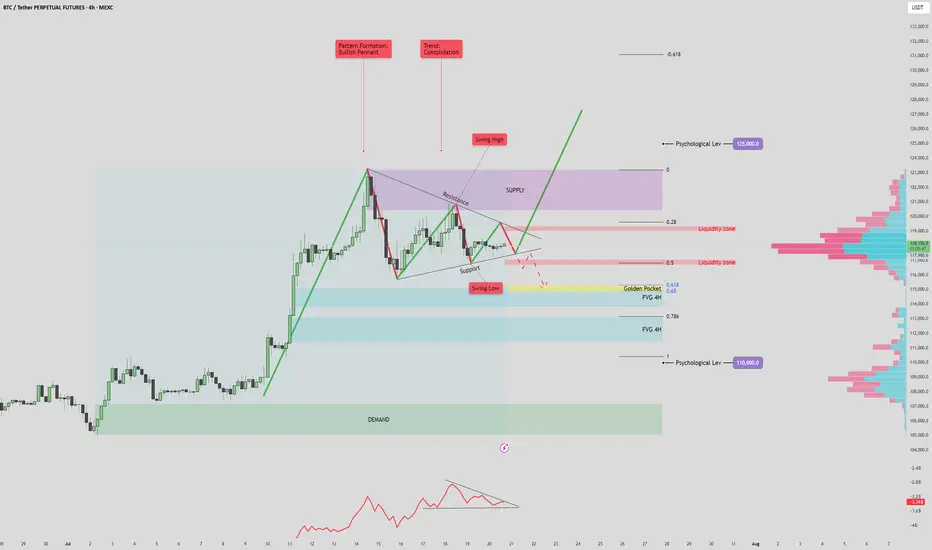
BTC/USDT 125k? or 110k fall again?BTC/USDT 4H Analysis – July 20, 2025
The current market structure shows a bullish pennant forming after a strong impulsive move upward, with price consolidating between key support and resistance levels. This pattern, combined with volume signals and key price zones, suggests a potential for a high-volatility breakout.
🔷 Volume Profile & OBV Insights
The On-Balance Volume (OBV) indicator is forming a symmetrical triangle, indicating a volume squeeze. This suggests a potential sudden spike in volume that could confirm the next major move.
Anchored Volume Profile (VPVR) on the right shows a notable low-volume area between 112K–115K. If price breaks below this zone, it could lead to a rapid selloff toward deeper fair value areas due to reduced liquidity support.
📈 Bullish Scenario
If price breaks above the pennant resistance and 119.5K liquidity zone, it may signal bullish continuation.
A successful retest of the breakout level as support would confirm strength, opening the door to:
Short-term target: 123K (supply zone and previous swing high)
Mid-term target: 125K (key psychological level and potential ATH)
Watch for confirmation via OBV breakout and strong bullish volume. Failure to sustain above the 118K–119K area could signal a bull trap.
📉 Bearish Scenario
A breakdown below pennant support and the 115K level would likely trigger a move into the low-volume range.
First key downside target: 114.7K–115.7K, which aligns with the Golden Pocket (Fib 0.618 zone) and a 4H Fair Value Gap (FVG).
This zone may act as a support or a liquidity grab reversal area.
If this zone fails to hold, deeper downside targets become likely:
FVG 2 (~112K)
Psychological support at 110K, which aligns with strong historical demand and a major VPVR node.
This bearish move may either confirm further downside momentum or present a fakeout opportunity if price sharply reverses from one of these deeper levels.
✅ Summary
BTC is coiled within a bullish pennant, with both bullish continuation and bearish breakdown scenarios in play. Volume confirmation and breakout direction will be key. Traders should monitor how price reacts around the 115K–118K zone for directional clarity. A move beyond this range, especially with volume support, will likely define the next trend leg.
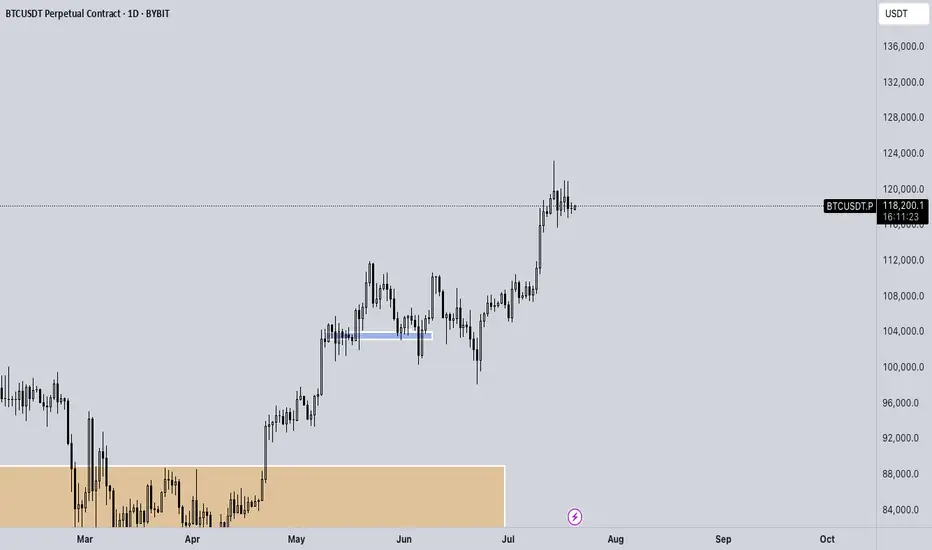
BTC - Ranges overview (update) BTC has been moving nicely lately so let's see where we go from here.
As previously mentioned, we should expect an aggressive move upwards towards 110K and eventually new ATH. As expected we got the move and are now trading around 120K.
IF we fail to hold the sellside at 115K expect us to trade back towards 110K.
IF we hold our current levels expect further upside towards new ATH.
No NEED TO FRONTRUN THE MARKET. BE PATIENT AND TRADE WITH IT.
Stay safe and never risk more than 1-5% of your capital per trade. The following analysis is merely a price action based analysis and does not constitute financial advice in any form.
BTC ShortI think Bitcoin will experience a small correction and then return to the uptrend.
Maybe Bitcoin will achieve the third target.
Entering Green Markets or Getting Close to Liquidation?They told you it’s a green market, time to buy... but something’s off.
Most major losses begin with a green candle, not a red one!
Before jumping in, ask yourself: why does everything suddenly look so clear?
Hello✌
Spend 3 minutes ⏰ reading this educational material.
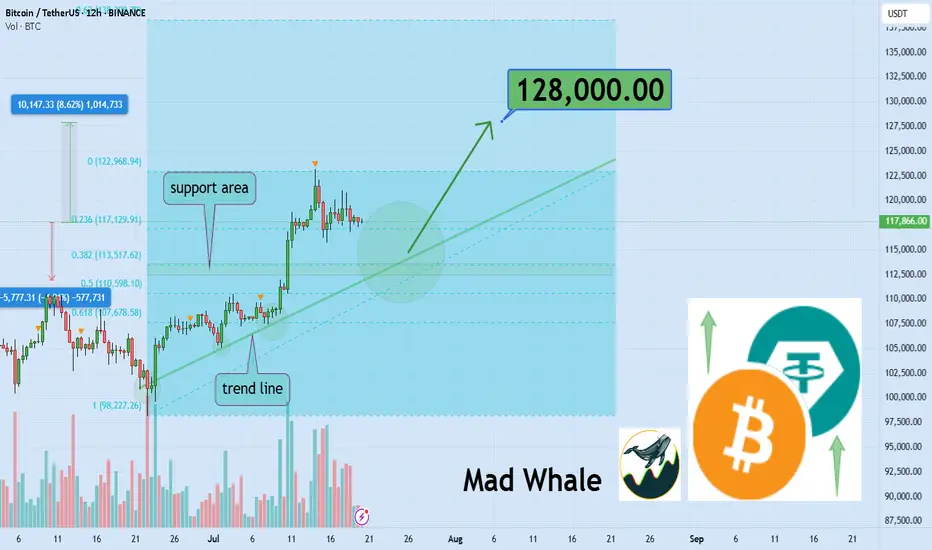
🎯 Analytical Insight on Bitcoin:
Strong volume confirming daily trendline and Fibonacci support signals a potential 8% upside, with a key target near $128,000 📈. This confluence could offer a solid entry opportunity for BINANCE:BTCUSDT traders 🧭.
Now , let's dive into the educational section,
📉 Green Doesn’t Always Mean Safe
Many traders jump into green candles, feeling they’re missing out. But most pumps end where excitement begins. The market isn’t always bullish it’s often just using collective emotion against you.
🧠 They’re Targeting Your Mind, Not Just Your Capital
Whales don’t need your money they need your mind first. The moment you think you're "too late" and must enter now, is often when they’re selling.
💡 You’re Fueling Their Profits, Not Your Trade
Those who bought early are waiting for someone like you. If you enter now, you're not beating the market you’re just helping others close in profit.
🔍 Why Most Liquidations Happen After Green Moves
Contrary to belief, major liquidations often come after green runs. That’s when confidence is high, stops are forgotten, and greed kicks in perfect timing for a rug-pull.
📊 History Doesn’t Repeat It Rhymes (Loudly)
Go back and look at Bitcoin’s chart since 2017. Nearly every major drop followed a smooth-looking pump. It’s not a warning. It’s a recurring pattern.
🎯 Hidden TradingView Tools for Spotting Green Traps
The market looks bullish. But the truth is, many pumps are just emotional traps built to bait late entries. TradingView has tools that, if used right, help you spot these traps before you step into them:
✅ Volume Profile (Fixed Range):
Use this to identify where the most trading volume occurred. If price rises on weak volume, be suspicious. It could be a fakeout or engineered pump by whales.
✅ RSI + Manual Divergence Drawing:
RSI seems simple, but traps often hide when RSI climbs while price action lags. TradingView allows manual drawing spot bearish divergence before the fall.
✅ On-Balance Volume (OBV):
If price is rising and OBV is flat or falling, warning lights should flash. A rally without money inflow is often a visual illusion.
✅ Session Volume HD (from Public Library):
See when most liquidity enters. Many fake bullish moves happen during the Asia session when volume is low and price is easier to manipulate.
✅ Multi-Timeframe Analysis:
If you're looking at the 15-min chart while the 4-hour sits in resistance, you may just be playing into a bull trap. Cross-reference your timeframes.
🧭 How to Avoid the Green Traps
Watch volume, not just candle color
Wait for level confirmations, not hype
Use TradingView’s combo indicators
Always ask: who profits if I enter right now?
✅ Final Thoughts
Not every green candle is hope sometimes it’s bait. The market is after your emotions, not your charts. Step back, zoom out, and use the right tools before you act.
✨ Need a little love!
We pour love into every post your support keeps us inspired! 💛 Don’t be shy, we’d love to hear from you on comments. Big thanks , Mad Whale 🐋
📜Please make sure to do your own research before investing, and review the disclaimer provided at the end of each post.
Bitcoin is still bullish (4H)Bitcoin appears to be in a dual bullish structure, currently in the second bullish phase following wave X.
Considering the expansive nature of the correction in the second pattern, it seems we are within an expanding triangle or a diametric structure.
Based on the duration of wave C, it appears that the bullish wave of the second structure is not yet complete.
We expect such fluctuations for Bitcoin in the coming period.
A daily candle close below the invalidation level would invalidate this outlook.
For risk management, please don't forget stop loss and capital management
Comment if you have any questions
Thank You

BTC #Bitcoin (BTC/USDT) on the 1-hour timeframeThis chart shows Bitcoin (BTC/USDT) on the 1-hour timeframe, highlighting two periods of sideways consolidation (marked in blue).
Both zones lasted 64 bars (2d 16h), indicating similar market indecision or accumulation/distribution phases.
The first consolidation (left) was followed by a strong bullish breakout, while the second (right) is currently unresolved.
Price is trading within a tight range between ~117,600 and ~118,400 USDT, suggesting potential for an imminent breakout or breakdown.
Volume during the current consolidation is lower than the previous one, hinting at reduced momentum.
This setup may signal a key move once the price exits this range.
thanking you

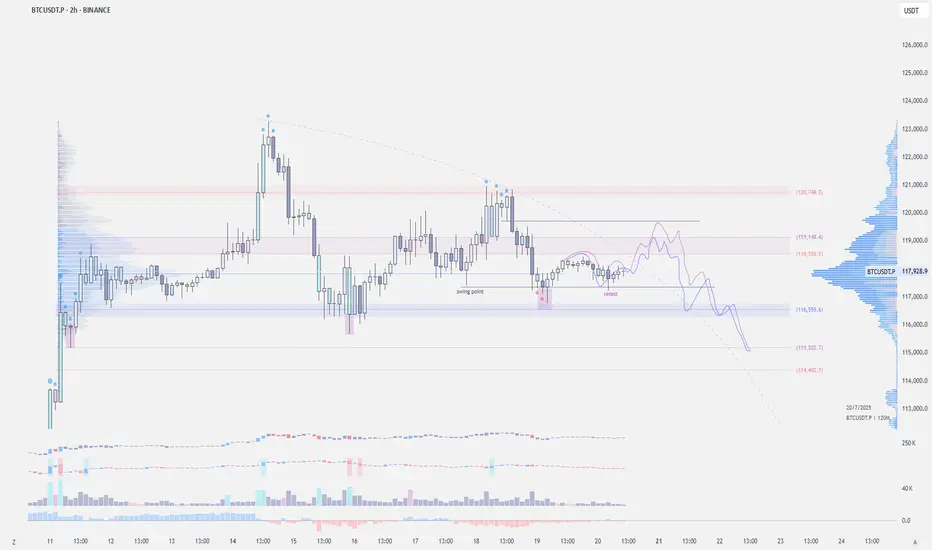
Bitcoin price analysisPossible LTF setup:
We got the 2h swing point retest. If base support holds, I’m looking for a potential move back to 119k — possibly even a gap fill to 119.7k before taking out the local lows.

Buy Signal at 117k, Eyeing 118.5k BreakoutDescription:
Bitcoin is consolidating just above the 200 EMA on the 1H timeframe, forming a slight ascending triangle. A buy around 117,000 with TP set at 118,421. With RSI near neutral and QQE MOD potentially flipping bullish, we are watching for a breakout above 118,500 for continuation. SL sits below the recent swing low at 116,485.
Trade Setup
Long Entry: 117,000 (as signaled)
Take Profit: 118,421 or higher (watch 118,800 zone)
Stop Loss: 116,485
Alternate Trigger: Break and close above 118,500 with increased volume = breakout entry
Invalidation:
A break below 116,400 (below SL zone and 200 EMA) could invalidate the bullish thesis and open downside toward 114,000.
Confirmation to Watch
Breakout candle above the 50 EMA with volume spike
QQE MOD crossover with histogram flipping blue
RSI moving above 50 confirming strength

$BTC - Weekend LTF SetupCRYPTOCAP:BTC | 2h
Possible LTF setup:
We got the 2h swing point retest. If base support holds, I’m looking for a potential move back to 119k — possibly even a gap fill to 119.7k before taking out the local lows.
BTC/USDT – 4H Chart Technical AnalysisBTC/USDT – 4H Chart Technical Analysis
Market Structure & Trend
Overall Trend : Bearish (clearly defined by a consistent downtrend channel).
Current Structure : Price is in a corrective downtrend within a descending channel, after multiple rejections from the supply zone.
Key Technical Zones
1. Supply Zone
Strong rejection zone where the price previously reversed sharply.
Still acting as resistance, located around the upper range.
2. Demand Zone
Currently being retested for the fifth time, weakening its strength.
Recent price action shows liquidity sweep and swing low break inside this zone, potentially trapping early longs.
Fair Value Gaps (FVG) & Fibonacci Levels
1D FVG sits below the current demand, aligning with:
Golden Pocket (0.618–0.65 Fib).
Acts as a high-probability bounce zone for long entries if demand fails.
A break below this FVG could open up deeper downside toward the 0.786 Fib or beyond.
Psychological Levels
105,000 – Major resistance & potential take-profit area for long positions.
100,000 – Key support and liquidity magnet if the demand zone fails.
Volume Profile
High Volume Node: 102,000 – 106,800 — price tends to gravitate here, indicating potential consolidation or resistance.
Low Volume Area: Below 100,500 — suggests thin liquidity, which may cause sharp moves if price drops into this range.
Scenarios & Trade Ideas
Bullish Scenario
If price holds above the demand zone (after multiple retests) and confirms on LTF:
Potential Long to local resistance.
On breakout, target the 105,000 psychological level.
Confluence: High volume area offers both support and a magnet.
Bearish Scenario
If price fails to hold the demand zone:
Enter short position targeting the 1D FVG and 100,000 psychological level.
If that breaks, expect sharp continuation due to low volume below.
Conclusion
Price is at a pivotal point — currently balancing on weakened demand after multiple retests. Watch for LTF confirmation:
Above demand = bullish recovery setup.
Below demand = bearish continuation toward 100,000 and the FVG.
Manage risk tightly due to the proximity of both key zones.
