TECHNICAL ANALYSISI BTC 1 HR TIME FRAME 📊 Technical Analysis – BTCUSDT.P (1H Chart)
✅ 1. Overall Trend:
The market is in a strong bullish trend on the 1-hour chart, confirmed by multiple CHoCH (Change of Character) and BOS (Break of Structure) points.
📌 2. Price Structure:
🔹 First CHoCH:
Indicates weakness in the prior downtrend.
The following BOS confirms a structure shift to the upside.
🔹 Second CHoCH:
After a minor correction, buyers regained control.
Another BOS confirms continuation of bullish momentum.
🟢 3. Demand Zones:
Multiple demand zones are marked in green.
The most relevant zone right now is between 113,100 – 113,600, still untested.
A bullish reaction is likely if price pulls back into this area.
⚠️ 4. Current Price Action:
Price has reached around 115,487 after the latest BOS.
A minor bearish reaction is visible, suggesting a possible short-term correction.
As long as the BOS level holds, the overall structure remains bullish.
🔍 5. Candlestick Signal:
No clear Engulfing candle yet, but if:
A strong red candle forms followed by a full bullish engulfing candle within the demand zone,
→ that would be a valid Bullish Engulfing pattern and a potential reversal signal.
🎯 Conclusion:
Market structure is currently bullish.
Watch for pullbacks to the 113,100–113,600 zone.
Ideal entries come with confirmation (e.g., engulfing candle or strong rejection).
Always apply strict risk management.
❗️Disclaimer:
This analysis is for educational purposes only and does not constitute financial advice or a buy/sell signal.
Please do your own research and trade based on your personal strategy and risk tolerance.
BITGET:BTCUSDT.P
BTCUSDT trade ideas

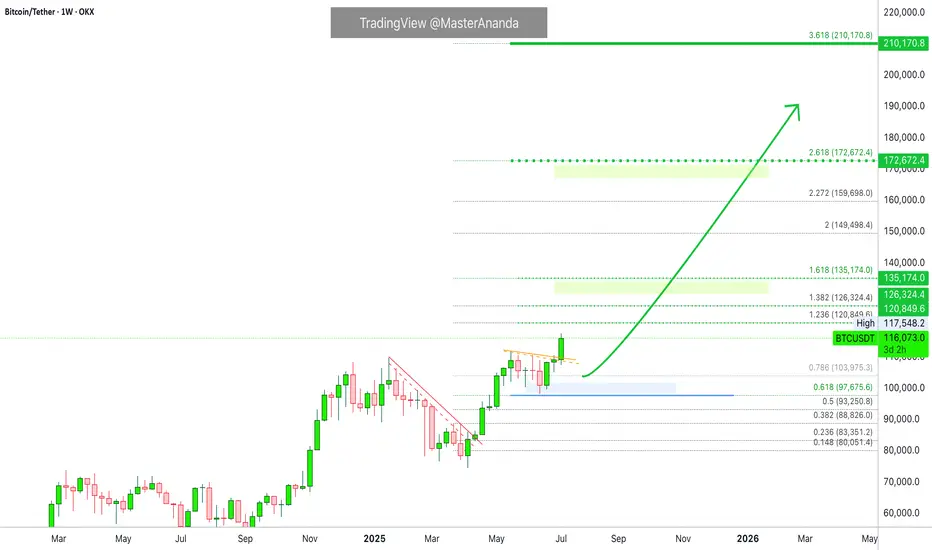
Bitcoin's Next Target Based on a 210 Days Long ConsolidationAfter each 210 days long consolidation phase Bitcoin advanced 137% on average, from bottom to top, since the November 2022 bear market low. Such an advance would put Bitcoin at a price of $170,000 next.
Now, the 137% is just the average. In one occasion Bitcoin rose 83% while in another occasion total growth amounted to more than 200%. We are counting the rise from the consolidation phase lowest point.
Let's look at some numbers:
» An 83% rise would put Bitcoin just above $135,000.
» A 128% rise would put Bitcoin right at $170,000.
» A 202% rise would put Bitcoin at a price of around $225,000.
~200% is how much Bitcoin grew between late 2023 and early 2024.
How much will Bitcoin grow exactly? We don't know. What we can know for sure is that there is plenty of room available for growth.
We are aiming for at least 100% growth starting from 100K, that is, a target of $200,000. Can be $180,000 just as it can be $220,000. That's the cycle top.
Do you agree with this target?
Leave a comment with your number.
Thank you for reading.
Namaste.
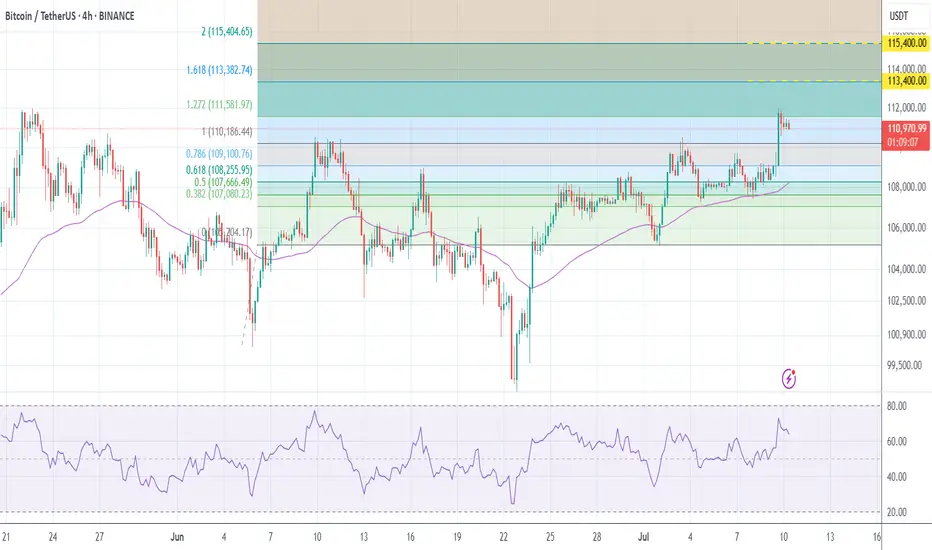
#Buy Bitoin @ H4This trading system is based on the divergence between the price and the RSI indicator and Fibonacci levels.
In the H4 chart, it can be seen that level 1 was broken and the price reached level 1.27. Levels 1.62 and 2 at prices 113,400 and 115,400 are the next targets.
Of course, the breakdown of level 1 may have a pullback.
I will post a short-term analysis on the 15-minute time frame in other posts.
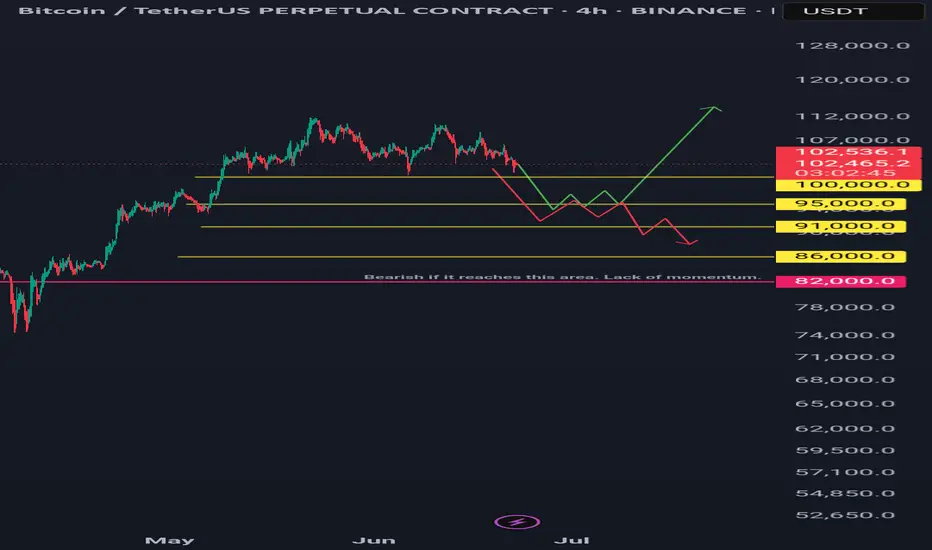
Btcusdt 4hr tf scenarios.Two scenarios: green and red lines.
Green Line: A bounce and sustained recovery above the 100-day and 200-day daily moving averages is bullish.
Red Line: A bounce followed by a lack of momentum and a break below a previous low is bearish.
Long Horizontal Red Line: If the price reaches this area, it could signal the start of a downtrend unless new bullish fundamentals emerge.
My Point of View (POV): I am bearish, primarily due to the ongoing war, similar to the conflict that began between two other countries a year ago.
However, it's important to note that every crisis and recession has historically presented a buying opportunity for institutions and 'whales.' Therefore, be prepared with funds for dollar-cost averaging (DCA), then simply hold and forget. It is recommended to conduct backtesting and research to identify optimal buying areas. DCA is key. Only invest money you can afford to lose.
Do you think I'm joking ???The price is currently forming the second corrective wave, and a slight price drop to reach higher levels is normal.
Best regards CobraVanguard.💚

If take a look at weekly time frameIf we take a look at weekly time frame btcusdt has formed a bullish cup and handle/ iH&S pattern and the nearest take profit area is the 120k. It is a good tp area for short term traders.

Bitcoin Wave Analysis – 10 July 2025- Bitcoin broke round resistance level 110000.00
- Likely to rise to resistance level 120000.00
Bitcoin cryptocurrency recently broke the round resistance level 110000.00 (which stopped multiple upward impulse waves from the start of this year).
The breakout of the resistance level 110000.00 should strengthen the bullish pressure on Bitcoin in the coming trading sessions.
Given the strongly bullish sentiment seen across the cryptocurrency markets today, Bitcoin cryptocurrency can be expected to rise to the next resistance level 120000.00 (target price for the completion of wave (3)).

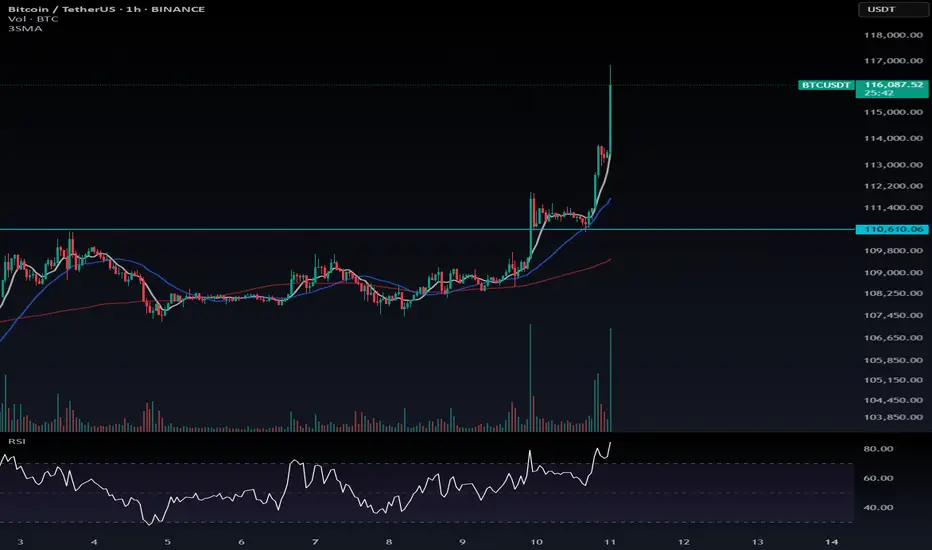
Hope you entered that long position!🚀 Hope you entered that long position!
I really tried to help you catch this move — and now it looks like Bitcoin has hit its first target.
If you want, you can take some profit here. But my suggestion? Hold that position with the mindset that some short-term profit might be missed, but the overall trend still looks strong.
📉 There’s a possibility of a minor pullback down to 110,610, even as a quick shadow — and then the upward move could continue.
📌 If you're holding altcoin positions, take profit on them. BTC dominance hasn’t dropped sharply yet, so alts are more likely to see pullbacks. Bitcoin still has more room to run in my view.
💬 Did you catch the trade?
🟢 In profit or waiting for higher targets?
Drop a comment 👇 Let's see how everyone's doing!
Bitcoin Breaks Out – Ultimate FOMO Unleashed Above $114,921🟢🚀 BREAKOUT POST
🚀🔥 Bitcoin Breaks Out – Ultimate FOMO Unleashed Above $114,921 🚀🔥
It’s happening. The breakout is real.
Bitcoin has just broken through the “HUGE-est Level EVER” — the infamous $114,921, marking the third macro test and final resistance in this structure.
This is not a small move. This is the unleashing of a new wave — the Ultimate FOMO zone is now LIVE.
📈 What Just Happened:
Third test confirmed ✅
Breakout through massive historical resistance
We are now in uncharted territory
🌪️ This Breakout Is Different:
Previous rejections (1 and 2) led to multi-week corrections
This time, price exploded through the level with force
Watch the parabola — we could be headed to the next ATH zone by end of 2025
🧠 Context:
The 2D divergences? Ignored. Structure wins.
This breakout invalidates the idea of sideways chop for now
It confirms strong bullish momentum across timeframes
⚠️ Caution Still Needed:
This move might trigger euphoric leverage — don’t be late, don’t chase blindly. Watch for a retest of the breakout zone for high-RR trades.
🧭 What To Watch Next:
Retest of 114.9K (support flip?)
New targets near 124K–128K
Long-term ATH projection still in play for late 2025
Full context in these breakdowns:
👉 Where Can Bitcoin Go? Part 8
👉 July 10th Market Outlook – Uncharted Waters
History is being written today.
One Love,
The FXPROFESSOR 💙
Disclosure: I am happy to be part of the Trade Nation's Influencer program and receive a monthly fee for using their TradingView charts in my analysis. Awesome broker, where the trader really comes first! 🌟🤝📈

BTC Leg2 115KBINANCE:BTCUSDT major movement from base 98K S to 106K $.BTC want to next movement to 115K $ but in middle of way 110K $ level there are sellers.
Support: 106.000 - 102.000
Resistance: 110.400 - 115.000
⚠️Control Risk Management

BTCUSDT - going to 113866.19$My analysis is based on numerology, all the numbers you see on the chart are from the same place. There is a certain numerological symbolism, which tells me that the price has already put the bottom 49(13) and will make a reversal from the zone 52260+- and then will fly strongly upwards with the target first 89k bucks, and after 113k. It's time to look for a good entry point.

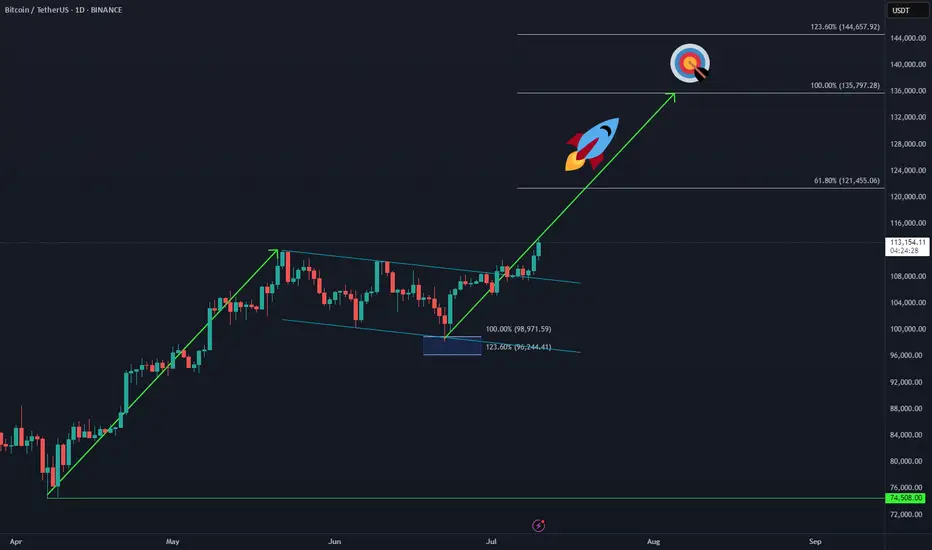
Bitcoin Makes New ATH – Next Sequence in Play 🚀 CRYPTO:BTCUSD has officially broken into new all-time highs, confirming the next bullish sequence is underway.
The upside projection now opens toward the $135K–$144K zone, aligning with long-term Fibonacci extensions and cycle projections.
📌 As always, it won’t be a straight line—expect step-by-step progress, with consolidations and pullbacks along the way. But the structure remains bullish, and the path is unfolding.
"Bitcoin, after breaking the resistance at $110,000"Bitcoin, after breaking the resistance at $110,000, could target $115,000 and $120,000 in the next steps."

07/07/25 Weekly OutlookLast weeks high: $110,529.95
Last weeks low: $105,108.81
Midpoint: $107,819.38
The "Big Beautiful Bill" was signed into law last week on the 4th July, a huge event in the financial world and undoubtedly the world of crypto. The debt ceiling is now instantly raised by $5T making risk-on assets even more appealing than ever, incoming demand shock will likely help BTC but also the struggling altcoin market as well.
Last week the BTC ETFs saw a net inflow of $294m. This takes the total 30-day inflows to nearly 50K BTC and this is before the big beautiful bill was passed. PA wise, BTC is still struggling to break the $110k level and flip ATH, however the consolidation just under ATH with increasingly shallow pullbacks suggests a run at the highs is in the near future IMO.
For this week US CPI & PPI data are the important release for the week. It's hard to tell if the data releases will actually provide any volatility this time around, they usually do but the FEDs refusal to act has made the last few CPIs very flat in terms of volatility for BTC.
Key battleground for me this week would be the midpoint, clearly last week provided good support, however a larger area of inefficiency rest just under that it so there is a natural pull for price to revisit those areas. Could be a choppy week once again...
Good luck this week everybody!

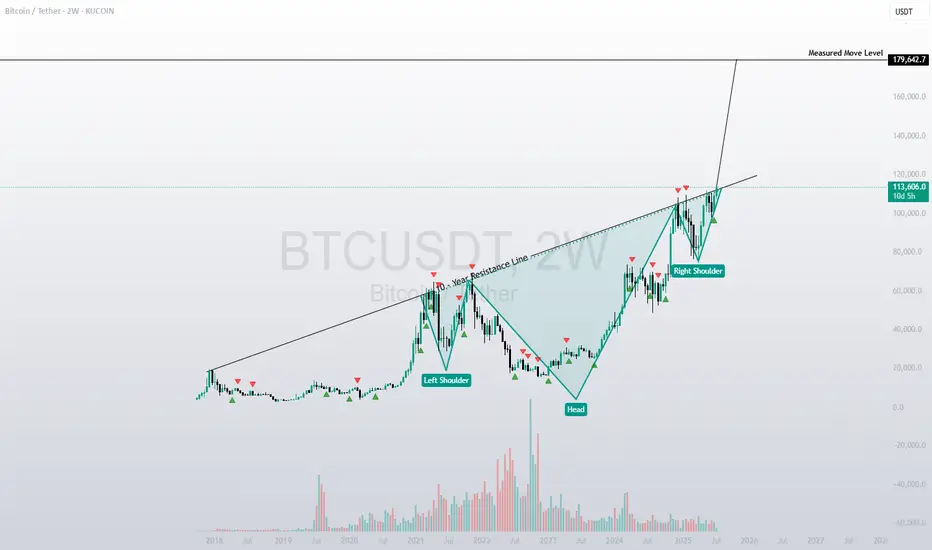
BTC Bull Run Idea - 10 Year Resistance Line BreakIf we break through that 10 Year Resistance Line - 180k is the measured move
Where Can Bitcoin Go? Part 8 –(Major Chart Update')First of all guys – I made the video! 🎥🔥 Watch the full breakdown before diving into the details below.
It explains everything visually, level by level. Don't miss it.
Now let’s get into the core of the analysis...
🚀📊 Where Can Bitcoin Go? Part 8 – The Final Test is Near! 🔥🔍
Welcome to Part 8 of “Where Can Bitcoin Go?” – the update of this long-running series. Since mid-2023, not much has changed in the structure. That’s the power of solid technical analysis – levels don’t lie.
🟨 The Setup
Bitcoin is now approaching a third test of a major structural resistance. If you’ve followed my 1-2-3 strategy, you know this is where decisions are made:
✅ Test 1: Rejection
✅ Test 2: Rejection
⏳ Test 3: Now pending… the TERMINAL and DECISIVE 'Breakout or Rejection', and this will change everything.
But here’s the deeper layer:
We’re not just testing one sequence. We now have two separate sets of 1-2 rejections —
🔹 One set from 2021 (the Red 1 and 2)
🔹 And a recent one in 2025 (the white 1 and 2)
This upcoming test is the third rejection attempt on both timeframes, making it a rare and extremely significant technical moment.
📐 Price is now near a critical ascending trendline around $115K–$116K, which has been the gatekeeper to parabolic moves in previous cycles.
🔄 Based on historical halving cycles:
548 days post-halving in 2016 → ATH 2017
565 days post-halving in 2020 → ATH 2021
Halving #4 was in April 2024 → 👀 Could this point to a new ATH by end of 2025?
📊 Probabilities
🔹 83% chance we see the third test before year-end
🔹 57% chance of breakout
🔻 43% chance of rejection
⚠️ And here’s the reality check:
If we see that breakout — the market unleashes itself. We’re talking major pumps, potential follow-through moves, and price discovery into untouched zones like $188K, $197K, and beyond.
But... if we get rejected, it won’t be pretty. We could retest major levels like $66K or worse, and lose momentum that took years to build.
And unfortunately — this isn’t like 18K, or 40K, or even the 79K retest.
Things are much more complicated now.
The sentiment, the structure, the risk profile — they’ve all evolved. We cannot afford to have the same blind bullishness we had in those earlier phases. This is a mature part of the cycle, and it demands discipline over emotion.
💬 What’s your take?
Will Bitcoin finally break through?
Is this just another fakeout in disguise?
Are you feeling this same tension in the market?
Let’s talk structure. Let’s talk price. Let’s talk reality.
One Love,
The FXPROFESSOR 💙
Disclosure: I am happy to be part of the Trade Nation's Influencer program and receive a monthly fee for using their TradingView charts in my analysis. Awesome broker, where the trader really comes first! 🌟🤝📈

July 10th Market Outlook –Charted Waters & Uncertain Momentum🗓️📊 July 10th Market Outlook – Charted Waters & Uncertain Momentum 🌊⚠️
Today’s breakdown is a reality check for traders navigating a market full of setups but short on clarity. Resistance is stacking across the board, but that doesn’t mean we can’t break through — it just means we need to stay sharp and keep our charts close.
🔎 Highlights from the 19-minute video:
Bitcoin is approaching a third and crucial resistance test. A breakout could trigger ultra-FOMO, but failure here could send us lower.
Ethereum is in a pressure zone — the "Symplegades" setup from Greek mythology reflects today’s narrow trading path.
Bitcoin Dominance is clinging to support — if it breaks, altseason could be on. If it holds, alts may stay sidelined.
NASDAQ & Nvidia have delivered massive runs, but signs of exhaustion and reversal risk are showing.
Dollar Index (DXY) showing a Golden Cross, but unresolved rate expectations could catch markets off guard.
💬 I also speak candidly about market manipulation, being someone else’s exit liquidity, and why we might be heading toward a formative trap before any true breakout.
🎥 Watch the full video to catch all the details — from long-term setups to real-time chart reactions.
📌 Stay tuned for detailed updates today on Bitcoin, Ethereum, Bitcoin Dominance, NASDAQ and more.
One Love,
The FXPROFESSOR 💙
Disclosure: I am happy to be part of the Trade Nation's Influencer program and receive a monthly fee for using their TradingView charts in my analysis. Awesome broker, where the trader really comes first! 🌟🤝📈

BITCOIN Bitcoin (BTC) has reached a new all-time high, trading around $111,000 to $112,000 per coin.
Key Highlights:
Bitcoin hit an intraday record high surpassing its previous peak of about $111,970 set in May 2025.
market capitalization exceeding $2 trillion.
The rally is attributed to a combination of factors including:
A weakening US dollar, which reduces opportunity cost for holding Bitcoin.
Increased demand from institutional investors, with nearly $1 billion net inflows into Bitcoin and Ethereum ETFs in early July.
Positive market sentiment following statements on monetary policy and expectations of potential Fed rate cuts.
Recent significant moves include the transfer of 20,000 BTC from wallets inactive for 14 years, highlighting long-term holder activity.
Price Data Snapshot:
Current Price: Around $111,000
Day’s High: Approximately $112,152
Market Cap: About $2.02 trillion
Volume (24h): Over $57 billion
Year High: $112,021 (intraday)
Summary:
Bitcoin continues its strong upward momentum in mid-2025, breaking new records amid supportive macroeconomic conditions such as a softer dollar and growing institutional adoption. The cryptocurrency remains volatile but shows robust demand as a digital asset and inflation hedge.
#BTC

BTC-USDT Analysis for the Past 24 HoursOver the past 24 hours, BTC showed excellent price action — I personally entered a long position at 110,000 and captured a clean +2.59% move, locking in profits without being greedy.
🚀 Price Action
Bitcoin climbed confidently from around 109,485 to 113,472 USDT — a gain of roughly 3.6%. The strongest impulse came between 00:00 and 01:00, with the candle surging from 111,341 to 113,685. It was a sharp and confident move with no signs of weakness.
📊 Market Observations
• Trading volume significantly increased during the night, especially from 03:00 to 01:00 — typical behavior during an aggressive short squeeze.
• Daily high: 113,757 USDT; low: 109,443.
• Technically, the market is continuing its uptrend after holding the key support level at 105,200 USDT last week.
📰 Fundamental Signals
• Kimchi premium is negative (-0.69%) — Korean investors seem to be in risk-off mode.
• Upbit listed BABY BTC, and activity in altcoins is picking up.
• Institutions are still cautious — even after BTC broke above 109,700, there’s no strong bullish sentiment from their side.
📌 My Take
The rally is strong, but not euphoric. There’s clear interest in BTC, and volume confirms the trend’s strength. However, the ETF flows and ongoing USDT discount in China signal the need for caution. Now is the time to avoid greed, take partial profits, and closely monitor how the market reacts to upcoming resistance levels.
BTC/USDT Multi - time frame analysis and {4HR }BTC/USDT Multi-Timeframe SMC Analysis – July 8, 2025
1. Top-Down Analysis:
Daily Timeframe (Macro Market Structure & Narrative - Inferred from chart context):
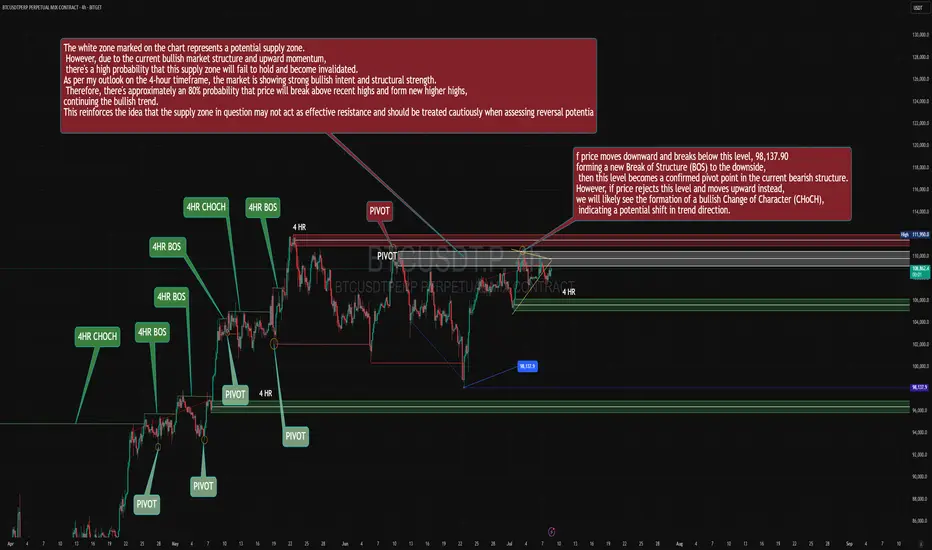
The broader market structure indicates a prolonged consolidation phase, initiated around mid-June, characterized by defined support and resistance levels. The identified supply zone, ranging approximately from $108,000 to $109,500 and labeled as "Potential Supply Zone" on the chart, is a key daily-level area.
Crucially, despite entering this daily supply, the strong underlying bullish order flow suggests a high probability that this supply zone may not act as an effective distribution point. The overarching narrative from higher timeframes indicates robust institutional buying pressure, implying a potential shift in the broader trend to unequivocally bullish upon a clear breach of this daily supply.
4H Timeframe (Swing Structure, Internal BOS/CHoCH):
The 4H swing structure explicitly displays a very clear bullish order flow. We observe a series of consecutively confirmed CHoCH (Change of Character) and BOS (Break of Structure) to the upside (indicated by "4HR CHOCH" and "4HR BOS" annotations). This unequivocally establishes a decidedly bullish 4H swing bias.
The most recent 4H BOS occurred around the $107,000 level, after which price has continued its upward trajectory.
Price is currently engaging with a 4H supply zone (marked by the white box). However, given the dominant bullish order flow on the 4H, there is a high probability that this supply zone will be invalidated, allowing price to extend its bullish movement. This phenomenon often signifies an "Imbalance Fill" or "Liquidity Grab" by smart money to fuel further upside.
1H Timeframe (Entry-Level Structure & POIs):
The 1H timeframe currently reflects a phase of consolidation or minor correction following the recent bullish impulse.
In alignment with the decisive bullish 4H bias, any retracement observed on the 1H timeframe is to be considered a buying opportunity.
The "PIVOT" marked around $105,000 serves as a potential 1H demand area, which could be a target for a deeper retracement before the continuation of the bullish move. However, considering the current market strength, price might not even reach this level and could resume its ascent from current or slightly higher levels.
The current "PIVOT" at approximately $108,500 represents a temporary internal resistance. A decisive break and sustained close above this pivot would provide stronger confirmation for the continuation of the bullish trend.
2. Identification:
Clean Breaks of Structure (BOS) and Changes of Character (CHoCH):
4H: Multiple clear bullish BOS and CHoCH events, indicative of strong bullish order flow.
1H: Internal structure currently shows consolidation prior to a likely bullish BOS to new highs.
Valid Supply & Demand Zones (Unmitigated only):
Unmitigated 4H/1H Supply Zone: Approximately $108,000 - $109,500 (marked by the white box). However, as noted, it is anticipated to be invalidated due to the overall bullish order flow.
Unmitigated 4H/1H Demand Zones: Lower down, around the $105,000 PIVOT and the green-shaded regions on the chart (potential demand areas that would activate upon a deeper retracement).
Internal and external liquidity pools (buy/sell-side):
External Buy-side Liquidity: Above the all-time highs or previous "High" (observed at $111,900 on the prior chart).
Internal Buy-side Liquidity: Above current range highs (approx. $109,500) and above recent pivots.
Internal Sell-side Liquidity: Below recent 1H pivots, particularly below $107,000 and $105,000 (which could act as inducement).
Inducement patterns and liquidity grabs (internal sweeps):
Any minor retracement or downside fluctuation from the current supply zone could act as inducement to draw in sellers, before price resumes its bullish trajectory.
Previous sweeps to the downside have served as confirmation of liquidity accumulation for prior bullish moves.
Order blocks, FVGs, mitigation blocks, and imbalance zones:
Given the impulsive nature of the bullish moves, bullish FVGs and OBs should be considered in retracements (e.g., around the $105,000 demand area).
The current supply zone (white box) also contains OB/FVG, but as mentioned, its invalidation probability is high.
Active market range and internal liquidity engineering:
The active 4H market range encompasses the recent bullish move from $102,000 to current highs.
Internal liquidity engineering currently involves drawing sellers into the supply zone and subsequently invalidating it for continued bullish advancement.
3. Delivery:
Directional Bias with Contextual Narrative:
Strongly Bullish. The 4H order flow is unequivocally bullish, with repeated confirmations of bullish BOS and CHoCH. While price is entering a supply zone, the overall bullish strength suggests it is highly probable this zone will be invalidated, leading to further upside to target new highs. The market narrative points towards a continuation of the uptrend, targeting external buy-side liquidity.
Actionable Setup (Long):
Asset: BTC/USDT Perpetual Futures
Entry Level (POI, OB or FVG):
Scenario 1 (Aggressive Entry - given market strength): Enter long within the $107,500 - $108,000 range (upon confirmation of bullish price action on the 1H or 15-minute timeframe within the supply zone, indicating its invalidation). This entry presumes the supply zone will be breached.
Scenario 2 (Conservative Entry - upon retracement): Enter long within the $105,000 - $105,200 range (the pivot area and potential demand zone). This point would activate upon a deeper retracement into a discount area.
Given the chart and current strength, Scenario 1 appears more probable, but price action confirmation is critical.
Stop-Loss (Invalidation Structure):
For Scenario 1: Place stop-loss below the last valid 1H structural low that confirms the bullish impulse, or below $106,500.
For Scenario 2: Place stop-loss below the demand zone and below the $104,500 pivot, e.g., $104,000.
Target Level (Minimum 3R+):
Target 1 (1R): $109,500 (Break of current supply range high and liquidity grab).
Target 2 (2R): $111,000 (Retest of previous "High").
Target 3 (3R+ / Primary Target): $112,500 - $113,500 (Formation of new highs and targeting fresh buy-side liquidity).
R-multiple Calculation Example: If for Scenario 1, entry is $107,700 and stop is $106,500 (1200 points risk), a 3R target would be $107,700 + (3 * $1200) = $111,300, which aligns with our targets.
Confluences:
Multi-Timeframe Alignment: Decisive bullish 4H order flow provides strong support for a bullish bias, treating any retracement as an opportunity.
Liquidity: New highs and external buy-side liquidity serve as clear targets.
Supply Zone Weakness: Despite price entering a supply zone, the underlying bullish strength suggests its probable invalidation.
Pivot Price Action: Repeated bullish pivots and structural breaks confirm the trend.
This analysis presents a high-conviction long setup for BTC/USDT. However, close attention to price action confirmations on lower timeframes (e.g., 1H or 15-minute) within the current supply zone will be crucial for aggressive entry. Should price retrace, anticipate a bounce from lower demand zones.
Disclaimer: This is a market analysis based on current price action and structure. It does not constitute a buy or sell signal. Always conduct your own research and risk assessment before taking any trades
BITGET:BTCUSDT.P
BTC 1 hr technical analiysis Asset: BTCUSDT.P (Bitcoin Perpetual Futures)
Timeframe Provided: 1-Hour (1H)
BITGET:BTCUSDT.P
1. Higher Timeframe Bias (Assumed for 1H Context):
Based on the observed price action, specifically the strong impulsive bullish move around July 2nd-3rd, followed by a corrective pullback, it is reasonable to assume a bullish bias from the higher timeframes (Daily/4H). This assumption is crucial, as the 1H timeframe should ideally align with the dominant higher timeframe trend for high-probability setups. The strong push above previous resistance and the subsequent retracement suggest the potential for a continuation of an uptrend.
2. 1-Hour Structure Analysis:
Initial Structure: The price was generally ranging or in a slight downtrend until around July 2nd. We observe multiple internal bearish Break of Structures (1H BOS in red).
Change of Character (CHoCH): A significant bullish 1H CHoCH is observed around July 2nd, indicating a shift from a bearish to a bullish internal structure. This shift was followed by strong bullish momentum.
Break of Structure (BOS): After the CHoCH, the market showed clear bullish 1H BOS, confirming the new bullish impulse.
Current Structure: The market has recently pulled back significantly after the strong bullish impulse. This pullback has tested a key demand zone. We are looking for a continuation of the bullish trend from this pullback.
3. Liquidity and Inducement:
Sell-Side Liquidity (SSL): Prior to the bullish CHoCH, there were clear areas of sell-side liquidity that were swept, fueling the subsequent upward move.
Inducement: The current pullback, while corrective, may be acting as an inducement, drawing in early buyers or trapping sellers, before potentially continuing the upward movement. Price has swept some internal liquidity during this retracement.
4. Valid Demand/Supply Zones (1H):
Primary Demand Zone: The most prominent demand zone of interest is located roughly between $107,000 and $107,300. This zone represents an unmitigated order block (or a clear area of strong institutional buying) that initiated the significant bullish impulse. It also aligns with previous resistance that was broken and is now potentially acting as support (a "flip zone"). This is our primary point of interest for a long entry.
Mitigation: Price has begun to tap into this demand zone, indicating a potential mitigation phase.
5. Trade Setup Proposal (High Probability Long Setup):
Considering the assumed higher timeframe bullish bias and the current 1H structure, a long setup from the identified demand zone presents a high-probability opportunity.
Bias: Bullish
Entry Strategy: We are looking for confirmation within the demand zone. Given the 1H chart, a refined entry could be sought on a lower timeframe (e.g., 15M or 5M) for further confirmation (e.g., an internal CHoCH, aggressive entry within the order block). However, based on the provided 1H chart:
Proposed Entry Price: Around $107,150 - $107,250. This is within the heart of the unmitigated demand zone. The visual suggests an entry around $107,200.
Stop Loss (SL): Slightly below the low of the demand zone/order block, and crucially, below any structural low that would invalidate the bullish short-term structure.
Proposed SL Price: Around $106,750 - $106,900. The visual places the SL at approximately $106,900. This allows for some wick hunting but protects capital if the demand fails.
Target (TP): We will target the high of the recent bullish impulse, and potentially higher if the higher timeframe bias confirms a sustained uptrend.
Proposed TP Price: Initial target at the recent high around $110,900 - $111,000. The visual suggests $110,950.
Rationale for TP: This target represents the next logical liquidity pool (buy-side liquidity) and a significant structural high that, if broken, would confirm further bullish continuation.
Risk to Reward Ratio (RRR):
Entry: ~$107,200
SL: ~$106,900 (Risk: $300)
TP: ~$110,950 (Reward: $3750)
Calculated RRR: Approximately 1:12.5. This is an exceptional RRR and highlights the potential of this setup.
6. Important Considerations & Trade Management:
Confirmation: While the 1H demand zone is strong, for institutional-level entries, further confirmation on lower timeframes (e.g., a CHoCH or clear bullish momentum shift on the 5M/15M chart once price enters the demand zone) would be ideal.
Market News/Events: Always be aware of upcoming high-impact economic news (e.g., CPI, FOMC minutes, NFP) that could induce high volatility and invalidate technical setups. For crypto, major exchange news, regulatory announcements, or large whale movements can also impact price. As of Saturday, July 5th, 2025, there are no immediate high-impact economic data releases on the calendar for this weekend, but traders should always check the economic calendar for the upcoming week.
Partial Take Profits: Consider taking partial profits at intermediate highs or psychological levels to secure gains and reduce risk.
Trailing Stop Loss: Once the trade moves significantly in profit, consider trailing your stop loss to break-even or beyond to protect capital.
This detailed analysis, even with the limitation of a single timeframe, provides a clear, high-probability long setup based on advanced SMC principles. Monitor price action closely at the entry point and manage risk diligently.
Disclaimer: This analysis is purely for educational and analytical purposes and does not constitute a buy or sell recommendation or financial advice. All trading decisions must be made based on individual analysis, proper risk management, and careful consideration of market conditions by the trader themselves. As an AI model, I bear no financial responsibility for the outcomes of your trades.

Bitcoin Breaks All-Time High: What’s Next?Bitcoin (BTC) has once again captured the world’s attention by smashing through its previous all-time high (ATH). This milestone has sparked excitement and speculation across the crypto community and beyond. But the key question remains: Will BTC continue its upward trajectory, or is a correction on the horizon?
Long-Term Outlook: The Bullish Case
In the long run, the fundamentals for Bitcoin remain strong. Several factors support a positive outlook:
Institutional Adoption: More institutional investors are entering the market, providing greater liquidity and legitimacy.
Scarcity and Halving Cycles: Bitcoin’s fixed supply and periodic halving events historically drive long-term price appreciation.
Macro Trends: Ongoing concerns about inflation and fiat currency devaluation continue to make BTC an attractive hedge.
Given these dynamics, we believe Bitcoin’s long-term trajectory remains upward.
Short-Term Caution: A Correction May Be Coming
While the long-term view is optimistic, the short-term picture may be less rosy:
Overheated Market Indicators: Rapid price surges often lead to overbought conditions, increasing the likelihood of a pullback.
Profit-Taking: After breaking ATH, some investors may lock in gains, adding selling pressure.
Technical Resistance: Historical patterns suggest that corrections often follow major breakouts.
We anticipate a potential correction, possibly pulling BTC back to the $90,000 range. This adjustment could unfold in the coming week or weeks as the market digests recent gains.
What Should Investors Do?
Stay Calm: Volatility is part of the crypto landscape. Corrections are healthy for sustainable growth.
Focus on Fundamentals: Remember why you invested in BTC in the first place.
Consider Dollar-Cost Averaging: Spreading out purchases can help mitigate the impact of short-term swings.
Conclusion
Bitcoin’s break above its all-time high is a testament to its enduring appeal and the growing confidence of investors. While a short-term correction may be likely, the long-term case for BTC remains compelling. As always, prudent risk management and a focus on fundamentals are key to navigating the exciting—and sometimes turbulent—world of crypto.
Do not consider it as investment advice.
#crypto #bitcoin #analysis

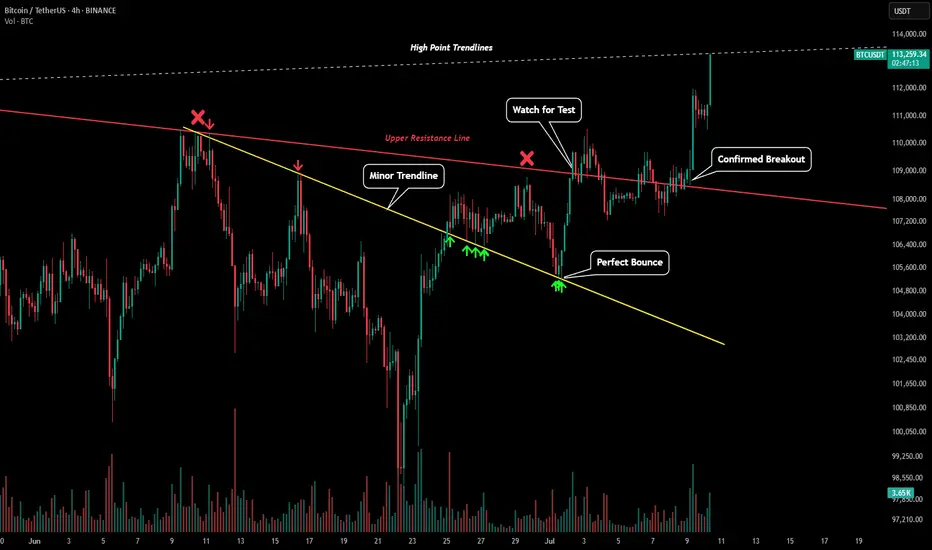
BTC - ATH After Perfect PredictionPlease refer to our previous post:
After a picture perfect test of our lower trendline of support price rallied back to our red trendline.
Price chopped back and forth around this trendline for a few days before finally confirming the breakout. Now BTC has hit a new all time high and is currently at our white upper high point trendline. Looking for confirmation closes above to continue the rally.