Don't take a short position BTCUSDT"Don't take a short position, but be prepared for a temporary drop before the market goes back to ranging. Right now, we're in one of the most exciting moments in the BTC market. "
BTCUSDT trade ideas
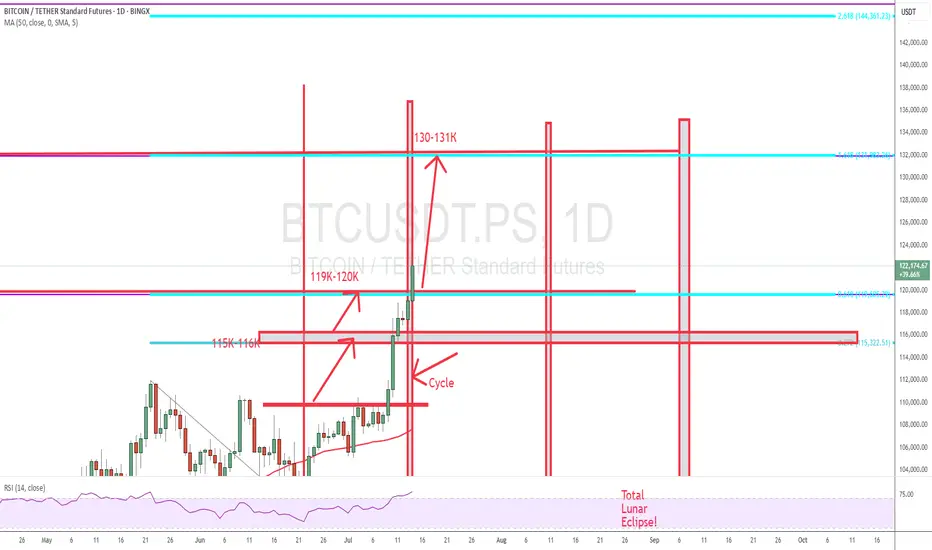
Can Bitcoin reach new highs?Bitcoin reached around 121722, close to the expected target of 130,000. There are two current expectations:
1. Black line: 5-wave rising structure, currently in the 3rd wave rising, and there will be a 5th wave rising after the correction.
2. Purple line: abc rising structure, currently in the last wave c rising, will end the rise ahead of time.
The rise is not yet complete. If it falls below the lower track of the channel, the rise will end.

BTC/USDT bullish with reverse head and shoulderBTC/USDT completed the reverse head and shoulder pattern.
It could be bullish by the pattern.

Bitcoin Fractal, increase to $116k Hi Everyone☕👋
BINANCE:BTCUSDT
Been such a long time since I posted. Today I'm looking at BTCUSDT, and I'm looking at the previous all time high cycle and what we were seeing (the pattern aka fractal).
Here's why we're likely going a little higher.
First correction of -32%
Followed by first peak, ATH
Correction, then the second peak and the REAL ath. Which is where we likely are:
Interesting to note that the previous time, the second ath was NOT THAT MUCH HIGHER. This should be considered to manage expectations in terms of how high we can go. Anything above +6% is a bonus.

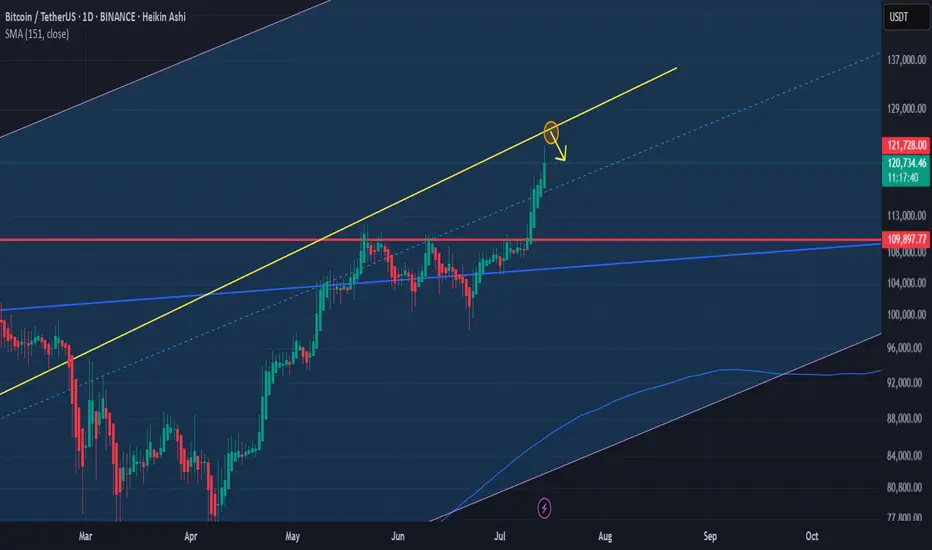
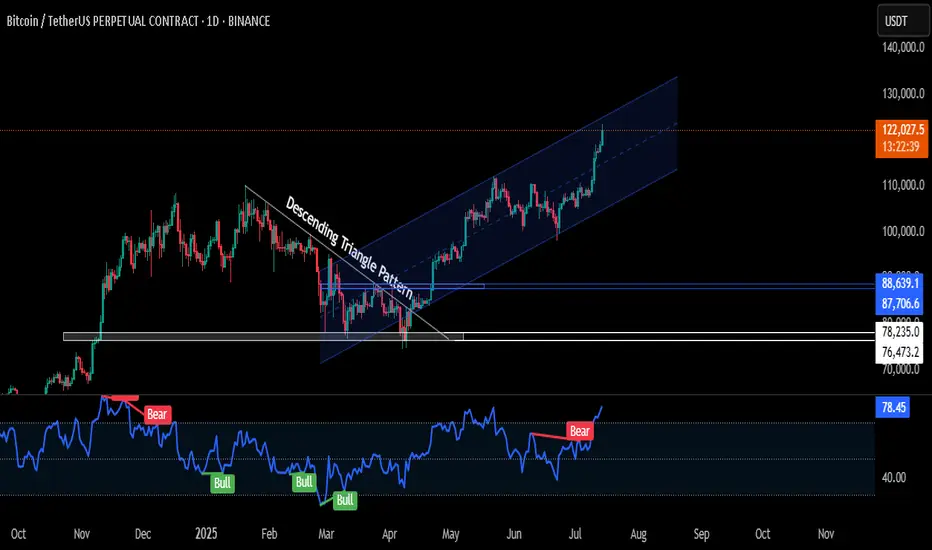
BTC Hits Channel Ceiling – Smart Money Taking ProfitsBINANCE:BTCUSDT.P
🚨 BTC has cleanly broken above $120K, tagging $123,300 today (ATH) — pushing the top boundary of a well-respected rising channel that’s been in play since April.
🔍 Analysis:
Structure & Trend:
Price broke out of a Descending Triangle back in March — that move initiated a trend, not just a spike. Since then, BTC has followed an ascending channel, showing institutional-style demand: controlled, aggressive, and layered.
Current Price Action:
We’re at the upper edge of the rising channel, where many traders either:
- Exit early out of fear of reversal,
or
- Chase breakout longs, often just before a shakeout.
Smart trading now = discipline, not FOMO
If BTC fails to hold above $120K, expect a cool-off to the channel midline around ($111K–$112K) or even lower.
🧠 What to Do as a Trader:
Already in from Lower?
This is your TP zone or trailing stop region. Don't get greedy.
Protect capital. Re-enter on retest or new setup.
Looking to Enter Now?
Not ideal. Let the chart either break and retest cleanly OR
pull back to mid-channel ($112K area) for a high-R:R setup.
📌 Summary
BTC is bullish — no denial. But this is the zone where pros reduce risk and wait for confirmation, while most retail enters blindly.
Don’t be the liquidity.
✅ Follow for more real-time updates
🔁 Share it with your fellow traders
🚀 And hit that Boost button to support the work!
Let’s trade smart, not emotionally. 💯
#CMPInsights
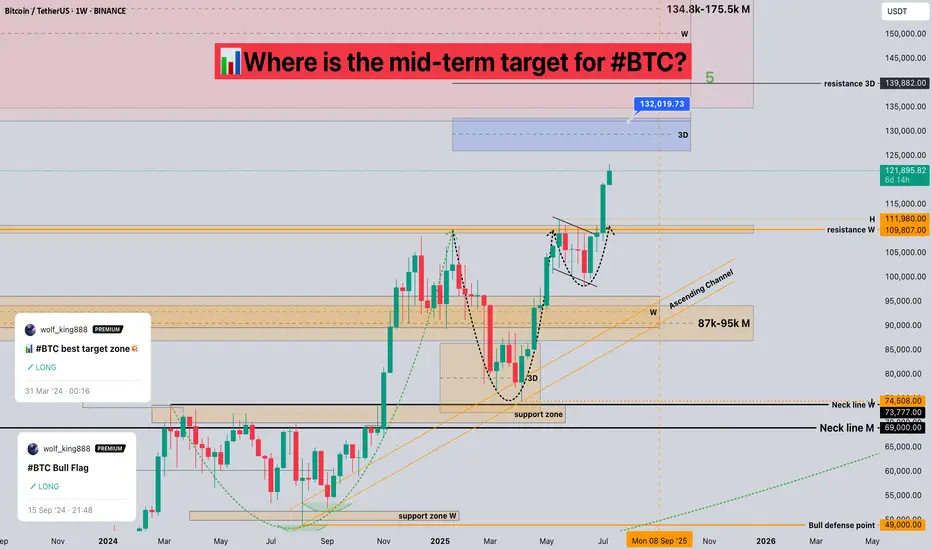
Where is the mid-term target for #BTC?📊Where is the mid-term target for #BTC?
🧠From a structural perspective, the bullish structure at the weekly and monthly levels is intact, so any increase is reasonable. We are approaching the target area of 132k-175.5k at the weekly and monthly levels. Please remember to lock in profits for spot trading.
➡️The weekly closing price is higher than the weekly resistance line, so the resistance line turns into a support line. If the price can return here again, you can look for bullish signals to participate in some long trades.
⚠️Short trading is a counter-trend trade, so we need to be cautious enough, and risk management is a must.
🤜If you like my analysis, please like 💖 and share 💬
BINANCE:BTCUSDT
Bitcoin at a Crossroadshello guys!
In the current 1D chart of BTCUSDT, a Head & Shoulders pattern has formed, suggesting potential for significant price movement in the near term. The structure includes a defined left shoulder, head, and right shoulder, with a descending trendline acting as a critical resistance level.
🔹 Bearish Scenario:
If the price respects the descending trendline and fails to break above the neckline (around $109,480) , a bearish reversal is likely. In that case, the target based on the pattern lies near the $93,500–94,000 support zone. This level aligns with a previous consolidation area, making it a strong candidate for a reaction or bounce.
🔹 Bullish Scenario:
On the flip side, if the price breaks above the neckline and the descending trendline, invalidating the pattern, a strong bullish continuation could unfold. The potential breakout target would be around $127,000–130,000, in line with the projection from the head of the pattern.

BITCOIN BREAKS YEARS LONG ASCENDING TRENDLINE RESISTANCEThe recent surge in the price of Bitcoin has led to the break of years long ascending trendline resistance as can be seen on Weekly BTC chart.
The price of BTC can soar higher above this resistance level and can take support from this level to mark a successful breakout.
Breakouts like this does create FOMO among traders but trading such breakouts must be done with caution as the price can still fall under the resistance level.
Best of Luck!!

Golden Bitcoin Signal: A Great Investment Opportunity🔔 Our Bitcoin Investment Bot has issued an exclusive signal! This signal, backed by 15 years of historical data analysis, marks the perfect time to enter the market. 🎯 Take Profit Target: $120,975 (equivalent to a potential 50.5% profit)
⚖️ Professional Risk Management: This signal comes with a Stop Loss at $66,835 (16.8% risk), offering an ideal balance of profit and risk. Our bot, with its advanced and data-driven strategies, identifies the most valuable investment opportunities.
⏳ Opportunities don’t last forever! This signal could be the start of a significant move. Now is the best time to act and take advantage of this precise analysis. With our bot, you’re one step closer to sustainable profitability. 🌟

BTC updateHere is the next upside Target. But - we're overbought, so better (for longs) wait for pullback. Also, better for safety.
Good Luck!
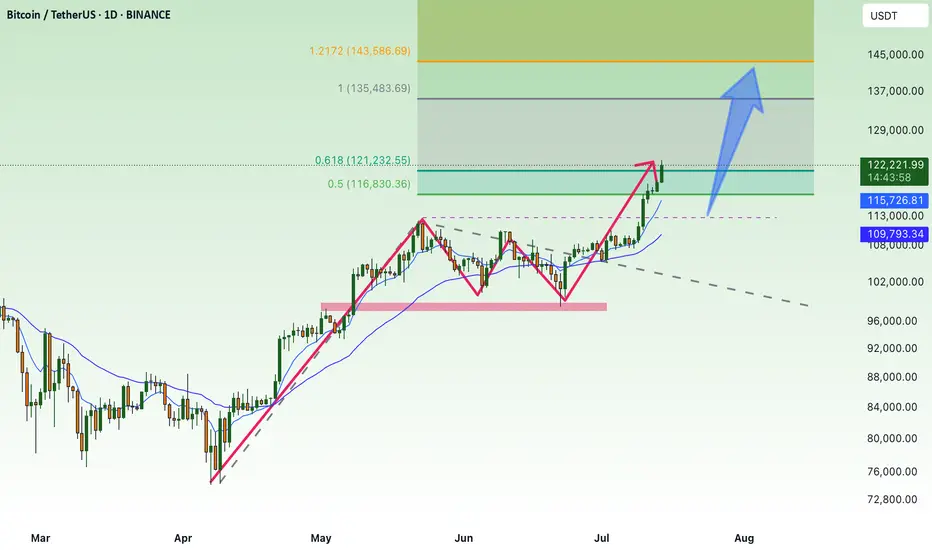
Lingrid | BTCUSDT strong Bullish Trend Continues The price perfectly fulfilled my last idea . BINANCE:BTCUSDT CRYPTOCAP:BTC broke out of a long consolidation range and confirmed a higher low at 98,200, initiating a new impulsive rally inside the upward channel. The price is now trading well above the 116,643 breakout level and holding near the mid-range of the next resistance zone. As long as the bullish structure holds, price is expected to target the upper resistance band near 130,000 in the coming sessions. Momentum and structure remain in favor of the bulls, supported by trendline and volume strength.
📉 Key Levels
Buy trigger: breakout and sustained move above 116,643
Buy zone: 116,643–120,000 (retest of structure and upper trendline)
Target: 130,000
Invalidation: drop below 116,000 breaks upward trend bias
💡 Risks
False breakouts around resistance zone may delay continuation
Macro uncertainty or ETF-related news can shift sentiment
Failure to hold above 116,643 would expose the trend to deeper correction
If this idea resonates with you or you have your own opinion, traders, hit the comments. I’m excited to read your thoughts!

BTC Era, continue to create new ATH💎 BTC WEEKLY PLAN UPDATE (14 July )
NOTABLE NEWS ABOUT BTC
Bitcoin (BTC) broke above a key milestone on Friday, setting a new all-time high of $119,999 with no signs of slowing down. The technical outlook supports further gains as momentum indicators remain strong and price action is solidly in price discovery mode, with the next potential target at $135.000
Bitcoin’s Next Stop: $135.000
Bitcoin entered price discovery on July 9, and since then, the king of cryptocurrencies has surged toward the $120,000 target—a key psychological level for traders. Early Monday during the Asian session, BTC climbed to a peak of $119,999, marking a new all-time high and the closest the asset has come to this milestone.
TECHNICAL ANALYSIS PERSPECTIVE
Two key momentum indicators on the daily timeframe signal underlying bullish momentum in Bitcoin, suggesting a potential for further upside. The Relative Strength Index (RSI) reads 76, and the Moving Average Convergence Divergence (MACD) is flashing green histogram bars above the neutral line.
However, if BTC undergoes a correction, it may extend its pullback to find support near the lower boundary of the Fair Value Gap (FVG) around $115,222.
Derivatives market data shows that $76 million was liquidated over the past 24 hours as BTC surged toward its new high. The long/short ratio, which is considered an indicator of bullish or bearish trader sentiment, is above 1—indicating that more derivative traders are optimistic about Bitcoin and are expecting further gains in the king of cryptocurrencies.
Stay tuned to the channel for updates.
Atomic Pump Exploded, You Missed It! Now What?Ever opened your charts after a few hours off and realized the market just exploded upwards without you?
That feeling of missing out, regret, and mental chaos is real.
But here’s the thing: if you missed the move, what should you do next?
This post is for you the ones who feel like the train left the station, but still want to win the next round.
Hello✌
Spend 3 minutes ⏰ reading this educational material.
🎯 Analytical Insight on Bitcoin :
Volume remains the decisive factor driving BINANCE:BTCUSDT toward higher price levels 📈. Across various scenarios whether it’s market battles, FOMO spikes, institutional capital flows, or extended periods of consolidation volume confirms the strength behind the move. Discussions about Bitcoin as the new global currency continue to fuel interest and momentum. In the short term, I’m targeting $129,000 for Bitcoin, representing roughly a 6% upside from current prices 🚀.
Now , let's dive into the educational section,
🧠 Understanding the Trader Psychology After Missing a Market Nuclear Explosion
When the market suddenly pumps, the first thought for many traders is: “I missed it.” That’s where the mental storm begins. Your mind starts blaming you, your analysis, or even bad luck. But all of that is just an emotional response.
The real question is can you use this moment to build your self-awareness and grow as a trader?
🧨 Turning Mistakes into Opportunities Without Self-Blame
Missing a pump isn’t necessarily a mistake it’s just an outcome. Maybe you didn’t check the charts, maybe fear held you back. What matters is: what did you learn?
A real trader documents every misstep, studies it, and adjusts next time. Turn that missed opportunity into a "pivot moment".
Keep a trading journal. Write why you missed it. What signs were there that you ignored? What can you do differently next time?
📊 TradingView Tools to Hunt the Next Big Move 🚀
When the market explodes, jumping in without a plan is a recipe for disaster. Step one? Turn off your emotions. Step two? Open up TradingView.
In moments like these, a few key tools can help you figure out whether the pump is over — or just getting started. One of the most powerful tools is Volume Profile Visible Range (VPVR). It shows you where volume is stacking up.
Heavy pumps usually lead to corrections, but if VPVR shows strong volume still holding higher levels, the opportunity may not be gone yet.
Next is the Relative Strength Index (RSI). If RSI is already above 70, chances are you're showing up late. But here’s the twist if there’s a small dip, RSI cools down, and then starts rising again… that might be your real chance to enter.
💥 When the Market Blows Up Like a Nuclear Bomb, How Do You React?
When green candles start stacking and everyone’s flexing profits, you’re left behind staring at a chart that feels like it betrayed you.
This is exactly when people make emotional decisions. But urgent hype is the enemy of good analysis. Your first job here: stay calm and look at the trend like a surgeon.
🧩 Greed vs. Logic Entering at the Top or Waiting for a Pullback?
The question isn’t whether to enter now. The real question is: why are you entering?
Because you feel left out? Or because your system gives you a signal?
If your decision isn’t based on a clean setup, you’re not trading you’re gambling. Logic must win over emotion. Every. Single. Time.
🧱 Coping With the Psychological Wall of Missing Out
The pain of missing out is real. It’s like arriving at the station just to see the train’s dust.
But here’s the truth: this wasn’t the last train.
One of the best traits of a great trader is the belief in future opportunities. If you chase what’s already gone, you’ll keep losing.
Instead, focus on rebuilding your mindset.
🎯 Smart Goal Setting: Prepare for the Next Wave, Don’t Chase the Previous One
Don’t chase a pump that’s already peaked. Instead, watch for early signs of the next one.
Look at coins that haven’t moved yet but are building momentum.
Focus on price action, volume behavior, hidden news, and reliable chart patterns. Let logic lead the way not FOMO.
🔄 What’s the Best Move After Missing a Pump? Maybe… Do Nothing
Sometimes, doing nothing is the best strategy.
The market isn’t a one-time lottery ticket. It gives out chances regularly but your impatient mind makes you believe you’re running out of time.
If your next move feels rushed, pause. Train your discipline to only trade with a cool head.
💡 Pro Tips to Come Back Stronger in the Next Big Move
Instead of regret, build a killer watchlist.
Set smart price alerts.
Go back to your past data and find recurring setups.
Sharpen your skills, study tools that help, and prepare for different scenarios.
Being prepared = staying ahead.
✨ Need a little love!
We pour love into every post your support keeps us inspired! 💛 Don’t be shy, we’d love to hear from you on comments. Big thanks , Mad Whale 🐋
📜Please make sure to do your own research before investing, and review the disclaimer provided at the end of each post.

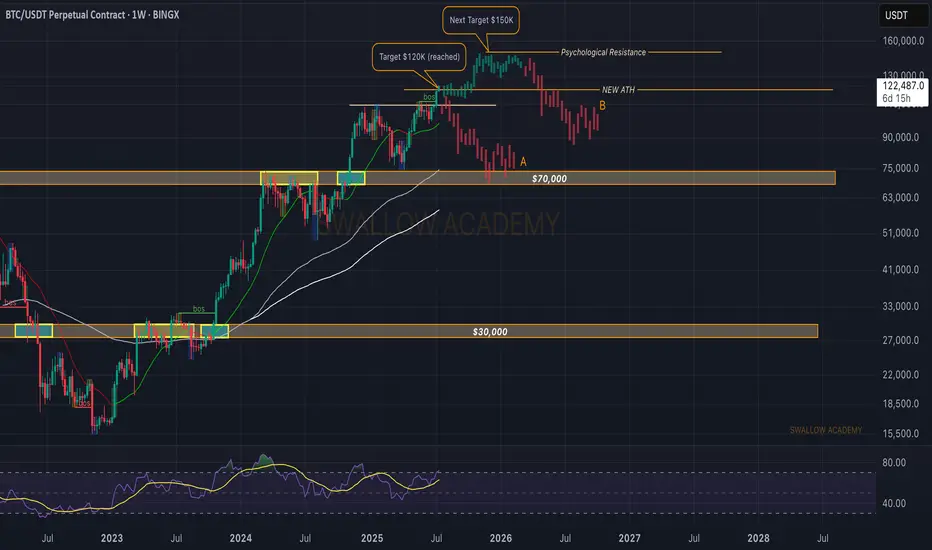
Bitcoin (BTC): Our Target Got Reached, Not Time To Just Watch!Buyers keep on pushing. As a new week starts, we are seeing a strong buy-side dominance and a new ATH to be formed, which broke our major target area of $120K.
Now to give a quick answer, our target is sitting at $140-150K, which we think will be the local top for this bull cycle, and as we recently reached major psychological resistance, we might see some sideways movement from here on, so there are a few things we are going to look for in order to get a potential trade from here.
1) Look for proper BOS (which should give us a good entry for long position)
2) if we see sideways channel, wait out for it to properly form on 30M timeframe, then try to trade inside the channel
3) If we see any kind of MSB (market structure break), we are going to look for a short position, as we might have a quick liquidity hunt there.
Swallow Academy
Overlaying AI forecast directly onto chart. Judge for yourself On the 27th of June I put through a prediction into my AI forecasting machine and this is what it said (image on screen)
I am SO impressed with the forecast so far, so I've overlayed the image onto the price action and will check in on it daily
This will give You the dominant trend direction for Bitcoin, and perhaps some extra capital in your accounts #you'reWelcome

SELL BTC 13.7.2025 (scalping M15)Counter-trend trade order: SELL at THE TOP
Type of entry: Limit order
Condition:
- If the price break down at 122,041 confirming the down trend.
Note:
- Management of money carefully at the price of bottom (122,041)
Set up entry:
- Entry sell at 122,821
- SL at 123,334
- TP1: 123,041
- TP2: 121,389
Trading Method: Price action (No indicator, only trend and candles)


BTC Bullish Setup: Two Long Positions Aligned for ContinuationHello guys!
Bitcoin is currently in a strong uptrend, consolidating after a sharp move up. The chart highlights a textbook bullish continuation pattern (pennant/triangle), suggesting momentum is building for another leg up.
Attention:
This is not an either-or setups. Both long entries are valid and could trigger one after the other, offering layered opportunities for bulls.
1- First Long: Breakout from Bullish Pennant
Price is tightening inside a triangle after a strong impulse move.
A breakout above the resistance around $118K would confirm continuation.
Entry on the breakout targets the upper liquidity zone near $122K.
2- Second Long: Pullback to S&D Zone (around $115K)
If the breakout happens and then retraces, watch for price to revisit the S&D zone at $115,200–$115,800.
This area will act as support and provide a second long opportunity.
target: around $122k

BTC Weekly Update -as of Jul14🕰 Timeframe:
📆 Date:
🔎 Market Overview:
💼 Massive Institutional Inflows:
▪️ Over $1.1 billion in net capital inflows have entered spot Bitcoin ETFs in recent days, bringing the total weekly inflows to $2.72 billion so far.
▪️ The total assets under management (AUM) across all Bitcoin ETFs now exceed $150 billion, representing over 6% of Bitcoin’s total market capitalization.
⚖️ Favorable Political and Regulatory Support:
▪️ The ongoing Crypto Week in Congress is reviewing key legislative proposals like the Genius Act and the Clarity for Digital Assets Act, both of which offer promising regulatory clarity for the crypto industry.
▪️ Additionally, former President Trump’s executive order to establish a “Strategic Bitcoin Reserve” signals strong official political support for Bitcoin adoption.
📊 On-Chain & Sentiment Indicators
📦 Exchange Reserves:
Bitcoin reserves on centralized exchanges are at their lowest levels in years, suggesting a trend toward long-term holding (HODLing) and reduced selling pressure.
🧠 Fear & Greed Index:
The sentiment index remains firmly in the “Greed” zone, even hitting its highest level since May, indicating strong bullish sentiment among retail and institutional investors.
🌀 Whale Activity:
Whale wallets continue to show heavy accumulation, with large and steady transfers into private wallets, further supporting a bullish on-chain trend.
📈 Technical Setup
🔵Trend: Ranging upward
🔸 Key Support: 118,000➖ 115,000
🔸 Key Resistance: 125,000➖ 130,000
🔸 Indicators Used: RSI above 70
🧭 Next Week – Key Points
🔹 Watch for the outcomes of Crypto Week legislation in Washington — this will be a key driver for market direction.
🔹Monitor ETF capital inflows — if daily inflows stay above $500M, the bullish trend will likely strengthen.
🔹 Track the Federal Reserve's interest rate policy and the USD outlook, especially in response to inflation or other macroeconomic factors.
🔚 Summary: Final Analysis
📌 After reaching a new all-time high above $122K on July 14, Bitcoin’s bullish trend has strengthened. Strong institutional inflows and political support have reinforced the foundation for growth.
● Key Level Ahead: $125,000
● Outlook: If price consolidates above resistance, we could see a move toward $135K and beyond.
● Weekly Bias: Bullish, with potential for a pullback before continuation upward.
✅ If you like this analysis, don't forget to like 👍, follow 🧠, and share your thoughts below 💬!

BITCOIN → Stopping after the rally? What next? 125K or 110K?BINANCE:BTCUSDT rose and updated its historical maximum to a new record of 118K with “kopecks” (different prices on different exchanges). Now the price has supposedly stopped and entered a consolidation phase, but it is too early to draw any conclusions based on this alone...
Fundamentally, Bitcoin rose following the SP500 and NQ100 indices. The reasons are clearly geopolitical. The correlation level is not high, but the flagship is following the stock indices, which are also updating their historical highs.
Technically, Bitcoin has emerged from a two-month consolidation and entered a realization phase. So what's next? Continuation of the phase or correction? Let's take a look.
On the daily chart, I would highlight two zones. The risk and sell zone is below 117,500. If the price closes below this zone today/tomorrow, we will most likely be able to look for signals for a possible correction. As part of the correction, we can expect a decline to 115,500, 114,300, or even to the old ATH of 112K.
The second zone is the buying zone. A closing price above 118,400–118,900 and consolidation with the gradual formation of a breakout of structure may hint at a possible continuation of growth toward psychological targets.
Resistance levels: 118,400, 118900
Support levels: 117100, 116700, 115500
In the chart above, I have highlighted the situations, levels, and zones that interest me more precisely.
Now I am waiting for Bitcoin to retest resistance or support and confirm certain levels, based on which decisions can be made. I think that in the near future, Bitcoin will show us where it is headed. Updates will be published as something interesting emerges...
Best regards, R. Linda!

Just Two Months Left: Navigating Bitcoin and Global ChangesGreetings to everyone reading these lines! Today, I want to share with you not just an analysis, but my personal reflections and feelings about the current situation in the financial and cryptocurrency markets, especially regarding Bitcoin.
Many of you already know that I have always been a firm believer in Bitcoin’s market cycles. Right now, we are approaching the final stage of another such cycle-the distribution phase. The past few months have seen considerable turmoil: Trump's election, escalating conflicts between India and Pakistan, Israel and Iran, rising tensions between Russia and Ukraine, and not to mention China’s increasingly assertive geopolitical moves. I can't shake the feeling that the world stands on the threshold of something significant, perhaps serious. I sincerely hope I'm mistaken, but signs of a global conflict or a substantial reset in the world order are undeniably in the air.
History shows us that after major upheavals and wars, the world undergoes profound changes. It seems we are nearing such a pivotal moment within the next couple of months. For a long time, I've highlighted September 2025 as a critical point in the current market cycle, and now everything confirms this scenario.
In these unstable times, participants in the financial markets face both risks and tremendous opportunities. The distinguishing factor today is the rapid integration of artificial intelligence into all areas of life. I firmly believe that if you don't begin incorporating AI into your activities now, you risk being left behind. Personally, I'm actively integrating artificial intelligence into my professional processes and everyday life, as I see it as inevitable in our near future.
Regarding the cryptocurrency market, I'll be frank: the past couple of years have significantly changed it and even somewhat disappointed me. Liquidity has become diluted, and the market has clearly become seasonal, with brief periods of explosive growth followed by long downturns. This has led me to return to trading Forex and gold, where the market is more transparent and predictable.
Many crypto projects that seemed promising in 2017 are now nearly forgotten and stagnating. Think of Dash, EOS, Litecoin, ZCash, and others-they haven't disappeared entirely, but they no longer play significant roles in the market. The battle for user attention has become overly aggressive, and competition has devolved into chasing short-lived hype. Nevertheless, there are exceptions, such as Solana—a project that achieved success thanks to a fortunate combination of factors. Yet such projects remain exceedingly rare.
Today, I see the most promising and powerful trend as the tokenization of real-world assets (RWA). It doesn’t matter so much which blockchain will be used-the concept itself has already proven effective. While this journey won't be easy, the involvement of giants like BlackRock indicates the trend is sustainable and promising in the long run.
Overall, I am confident that financial markets and digital currencies will continue to evolve and grow. However, in about two months, I plan to adopt a bearish stance. Unfortunately, there are few signs of a quick global economic recovery. The world needs significant restructuring and changes-new rules and agreements are inevitable, and the coming year promises many notable events.
Ask yourself: Are you ready for these changes? Are you prepared to adapt to new conditions, technologies, and realities? Personally, I'm fully ready, which is why I remain active in the market, continuing to share my thoughts, assist, and engage with each of you. If you have questions, ideas, or proposals for collaboration, I am always open to dialogue and eager for any interaction.
I sincerely thank each of you for your support, comments, and attention to my posts. I stay here because I believe in the enormous opportunities available even in the most uncertain times. We have an exciting journey ahead, and I invite you to travel it together with me.
Wishing you success, profits, and above all, peace and kindness on our planet. The time of change is already here. Let’s meet it together.
Warm regards,
Your EXCAVO.

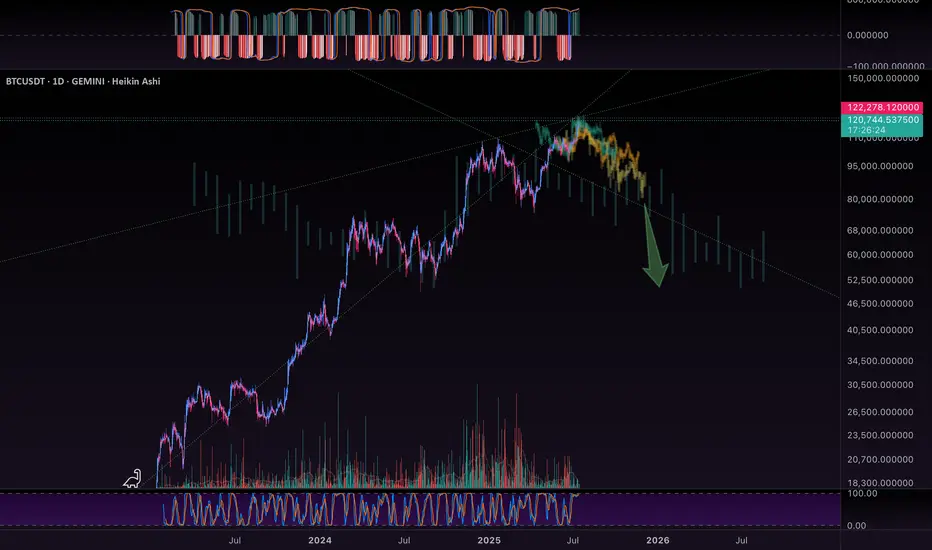
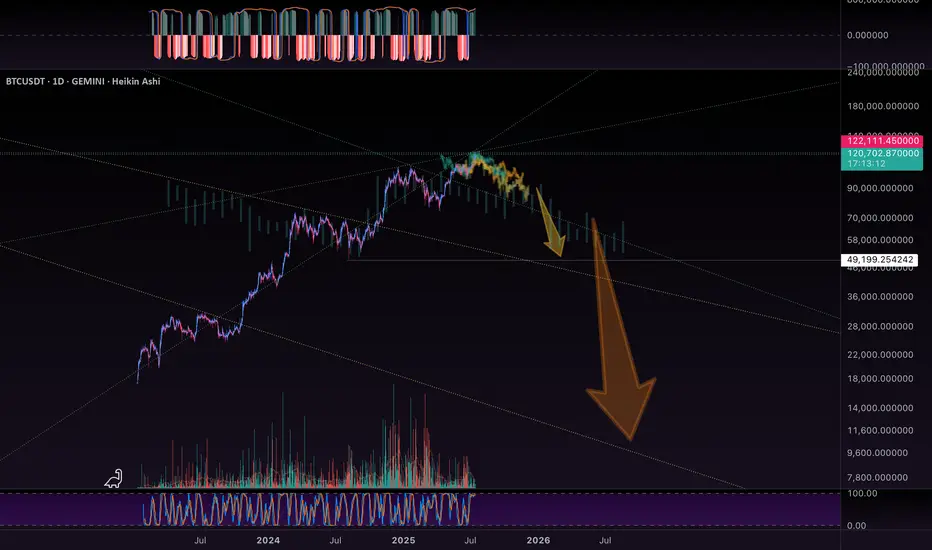
BTC - Historic Levels to CheckBTC has some checking in to do…. On historic resistance levels…
I drew in the major ones visible on this chart… and the initial bearish fractal, which was shown to us previously int he chart.
It will fractal for each arrow.
Pump and Dump!
Im going to run my DOGe.
See my linked post below for a bigger picture view of all this.
BTC - Topping outWow.. and look at those beautiful harmonic pattern fits! My eyeballs are so pleased with my work! Hehe!
These aggressive monsters like to propagate and fractal…
I met with another wizard of the charts yesterday… forecasted BTC to $5,000 !!! Holy crap!
Are you getting FEARFUL yet? Or still feeling GREEDY?
This is gonna be fun!
Check my linked idea for more insights.