BTCUSDT – Diametric G-Leg Underway?⏱ Timeframe: 4H / 1H
🔍 Method: NeoWave + Smart Money Concepts (SMC)
📍Posted by: CryptoPilot
⸻
🧠 NeoWave Progression Update
As outlined in our previous analysis, we are tracking a potential Contracting Diametric structure (A–G) originating from the March 2025 highs.
🚨 The G-Leg may now be actively unfolding.
Here’s what just happened:
• Price rejected sharply from the supply zone near 119,000–119,500, exactly where Wave F was expected to end.
• After a drop to 115,780 (minor trendline), price bounced, but failed to make a new high, stalling at 118,700, forming a lower high → classic signature of a developing G-Leg.
• This G-wave likely aims to break below Wave E low, seeking imbalance fills and structural resets.
⸻
📊 Smart Money Confluence (SMC / ICT)
• 🟥 Bearish Market Structure confirmed via MSS on 1H: Lower Highs + Internal BOS
• 🟨 Buy-side Liquidity above 120k was already swept
• 🔻 Price failed to reclaim OB block around 119.5k
• 🧩 FVGs remain open between 114.5k–113k, acting as magnet zones
• 📉 Expectation: Price may now break the ascending minor trendline and accelerate toward the major structure low
📌 Primary Scenario:
• Wave G of Diametric in motion
• Potential structure: Zigzag or Complex Combination
• Expectation: Bearish continuation to break below 113k
📌 Alternative Scenario:
• If price closes above 120.5k, diametric structure may be invalidated
• Watch for triangle/flat development instead
⸻
⚠️ Risk Management Note:
Price action near 118.7k–119.5k is crucial. Reclaiming that zone with strength changes the bias. Until then, sellers remain in control.
💬 Final Thought:
We’re tracking the final stages of a multi-month complex correction. The rejection at supply, combined with SMC signals and NeoWave symmetry, suggests sellers may push price into deeper demand zones soon.
⸻
📌 Follow CryptoPilot for advanced wave structure updates, market geometry insights, and ICT-style smart money traps.
💬 Share your views or alternate wave counts in the comments!
BTCUSDT trade ideas

The Great Trap: How Billionaires Are Winning, and You're Not!The Great Crypto Trap: How Billionaires Are Winning—And You're Not
The ETFs, Saylor, and all of Trump's billionaire friends are getting richer—thanks to crypto.
Meanwhile, most retail traders are just trying to stay above water. Leverage trades are wiped out, charts feel rigged, and the market makes you feel like you're swimming against a riptide.
Why?
Because these rich guys have a plan: manipulate you and take your money. That’s how they stay rich.
Understanding their strategy is the first step to stop being their exit liquidity.
🧠 The New Battlefield
Crypto is no longer a playground for cypherpunks and tech rebels. It’s fully institutional now. We're not just trading against whales—we're fighting the same entities that own the media, control Wall Street, and write the rules.
So forget the old ways of thinking. The tables have turned.
🗓 The Sunday Rekt Routine
To maximize destruction, they need to avoid friendly fire. So they pump on the weekend when retail is free and optimistic, then dump on Monday to close the CME gap—like clockwork.
The playbook:
Weekend: Pump. Trap your long.
Monday: Dump. “Fill the gap.” Liquidate everyone.
Response:
Don’t fall for weekend FOMO. Exit Sunday afternoon. Wait until Tuesday to re-enter, once Monday’s high and low are set. Trade smart, not emotional.
📈 Top-of-the-Market FOMO
You’ve seen it before. Just before the crash, the media frenzy begins. Influencers say “Don’t miss this pump!” or “99% will miss the next big move!” The ETF gods hint at new inflows. It's a setup.
They're not hyping it for your benefit—they're offloading their bags in your face.
Just look at the charts:
BlackRock bought billions to drive BTC to 121K.
Then, in 72 hours, they dumped billions.
Saylor? Silent. No new buys. That’s not coincidence—it’s coordination.
Response:
Check the MACD, RSI, and Stochastic RSI on daily or weekly timeframes. If they're maxed out and the influencers are screaming green—it’s probably too late.
When they stop buying, the dump is already planned.
🧰 How to Outsmart Them
Watch the MACD for crossovers and divergence.
Monitor RSI zones—don’t long into extreme overbought conditions.
Use Stoch RSI to anticipate momentum shifts.
Rule: When everything is overheated, and FOMO is peaking—step back. Let them dump into each other. You’ll get your entry later, cleaner and cheaper.
⚔️ This Is War
Make no mistake: this is a war for your money.
They want yours. You want theirs.
Only the smart survive.
To be continued.
DYOR.

Understanding Wedge Patterns - A Real Bitcoin Case Study🎓📊 Understanding Wedge Patterns - A Real Bitcoin Case Study 🧠📈
Hi everyone, FXPROFESSOR here 👨🏫
From this moment forward, I will no longer be posting targets or trade setups here on TradingView. Instead, I’ll be focusing 100% on education only for here in Tradinfview.
Why? Because over time I’ve learned that even when traders receive the right charts, most still struggle to trade them effectively. So, from now on, FX Professor Crypto content here will be strictly educational — designed to teach you how to read and react to the markets like a professional. Unfortunately I cannot be posting on Tradingview frequent updates like I do all day. Education is always better for you guys. And i am very happy to share here with you what matters the most.
🧩 In today’s post, we dive into one of the most misunderstood formations: the wedge pattern.
Most resources show wedges breaking cleanly up or down — but real price action is messier.
🎥 I recorded a video a few days ago showing exactly how BTC respected a wedge formation.
⚠️ Note: Unfortunately, TradingView doesn’t play the audio of that clip — apologies that you can’t hear the live commentary — but the visuals are clear enough to follow the logic. (there is no advertising of any kind on the video so i hope i don't get banned again - i did make a mistake the last time and will avoid it-the community here is awesome and needs to stay clean and within the rules of TV).
Here’s what happened:
🔸 A clean wedge formed over several days
🔸 We anticipated a fake move to the downside, grabbing liquidity
🔸 BTC rebounded off support around a level marked in advance
🔸 Then price re-entered the wedge, flipping support into resistance
The lesson?
📉 Often price will exit the wedge in the wrong direction first — trapping retail traders — before making the real move. This is a classic liquidity trap strategy, exercised by the 'market'.
💡 Remember:
Wedges often compress price until it "runs out of space"
The initial breakout is often a trap
The true move tends to come after liquidity is taken
The timing of the 'exit' has a lot to do with the direction. In the future we will cover more examples so pay attention.
I stayed long throughout this move because the overall market context remained bullish — and patience paid off.
Let this be a reminder: it’s not about guessing the direction — it’s about understanding the mechanics.
More educational breakdowns to come — keep learning, keep growing.
One Love,
The FX PROFESSOR 💙
Disclosure: I am happy to be part of the Trade Nation's Influencer program and receive a monthly fee for using their TradingView charts in my analysis. Awesome broker, where the trader really comes first! 🌟🤝📈

$BTC Daily OutlookBINANCE:BTCUSDT.P
Weekly Chart:
Bitcoin has now printed three consecutive weekly closes above the former higher-high threshold at $111 960. That series is enough to confirm a clean breakout of the prior HH-HL range and keeps the long-term bias pointed firmly higher.
That said, a near-term pullback is still on the table:
• First support — the breakout shelf at $111 960 (re-test of structure).
• Deeper support — the next V-level around $98 115.
Why the caution?
Last week’s candle left a small Failed Auction just above the new high, and Footprint data shows a cluster of aggressive buy-delta trapped in that wick. Those buyers may need to get washed out before the trend resumes.
Big picture: weekly structure is bullish; any dip into the levels above is a potential reload zone while the breakout holds.
Daily Chart:
Price action remains firmly bullish: multiple Failed-Auction rejections at the $116 860 higher-low vLevel keeps supply thin and reinforce the up-trend toward the prior ATH.
That said, remember Auction Market Theory rule #5: “When time or volume builds at the edge of balance, price often pushes through.”
• Each failed auction is absorbing resting bids.
• If sellers lean in again with size, the level can flip from support to resistance very quickly.
In practice that means:
•Base case – continuation to the highs while the Daily structure holds.
•Risk scenario – a clean break of $116 860 would open room for a deeper weekly pullback toward $107456.0
For now we treat the current weekly pullback as a fresh opportunity: scouting intraday longs as price reacts to the 1-Hourly zone.
From the footprint read-out, today’s bar finished with a neutral delta, but note where the profile is stacked: both the Value Area Low and the POC sit right at the bottom of the candle. That tells us the bulk of volume printed down at the session lows and it skewed negative, sellers were leaning hard, trying to extend the move lower.

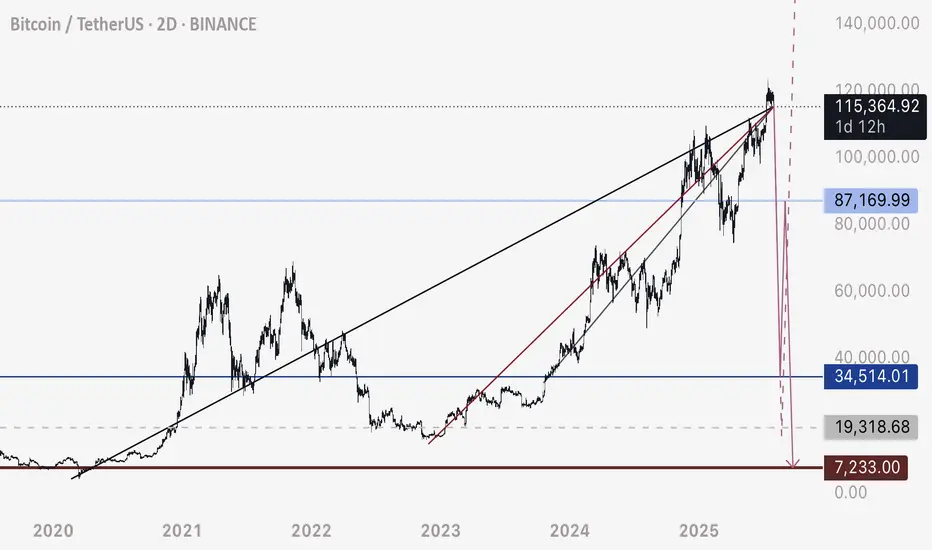
BTC - Not the End of the DropRather the beginning. Bitcoin has fallen below this bearish intersection. Anticipating price to fall rapidly on one of these two pathways to the Uber low liquidity levels.
DXY is retesting a major bearish breakdown - this is the conduit that will justify a flash crash of this magnitude prior to a 3-5 year bull run.
Happy trading.
BTC – Bullish Breakout in SightBTC – Bullish Breakout in Sight
Bitcoin recently completed a bullish harmonic pattern near 112K, and the reaction was strong—showing that buyers stepped in around that level.
In just two days, BTC climbed by about 3.5%, reaching 115.7K—and it did so with relatively low trading volume, which highlights quiet but steady buying interest.
Right now, price is pausing between 113.7K and 115.7K, forming a possible accumulation zone.
If momentum picks up again, BTC could launch another bullish move toward:
🔹 116.8K
🔹 119K
You may find more details in the chart!
Thank you and Good Luck!
PS: Please support with a like or comment if you find this analysis useful for your trading day

NeoWave Alert: BTC G-Wave Sets Up a Brutal Drop After $116K PumpAs anticipated in our previous NeoWave analysis, the market appears to be deep within Wave G of a Contracting Diametric structure (A–G), originating from the March 2025 high.
⸻
🔻 Key Developments:
• After rejecting from $119,000–119,500 (Wave F resistance), price dipped to $112,000, breaking below the previous channel’s lower bound, and now appears to be forming a steeper descending channel.
• This new channel’s resistance has shifted lower to $116,000, becoming a potential bull trap zone.
• The bounce from $112K is likely a liquidity sweep, preparing for one final upside to $116K, followed by aggressive distribution.
⸻
💡 Trading Thesis:
We’re likely seeing a trap-style rally within Wave G, aiming to:
• Attract liquidity up to $116K
• Induce late longs before initiating a more violent selloff toward $105K or lower
⸻
🔍 Smart Money Confluence (SMC / ICT)
• 🟥 Confirmed bearish structure on 1H (Lower Highs + BOS)
• 🟨 Liquidity above $120K already swept during Wave F
• 📉 Order blocks around 119.5K rejected
• 🔻 Price currently trades above $114K, but trapped inside a sharper descending range
• 🧲 Unfilled FVGs between $113K–$110K may serve as magnets
⸻
🧠 Wave G Structure (Diametric)
• Possibly unfolding as a Zigzag or Complex Combination
• Channel boundary now capped at $116K
• Wave G likely targets a breakdown below Wave E ($113K) and toward $105K
⸻
📌 Primary Scenario:
• Final push to $116K → strong rejection expected
• Bearish continuation targeting $110K → $105K
🧯 Invalidations:
• Clean breakout & daily close above $120.5K invalidates this diametric structure
• Watch for triangle or flat morphing if structure shifts
⸻
⚠️ Risk Management:
• $116K = key distribution zone
• Watch closely for rejection and breakdown confirmation
• Shorts valid below $114K with tight invalidation above $117K
⸻
📌 Conclusion:
Bitcoin is nearing the climax of a multi-month complex correction. The current setup favors a liquidity trap toward $116K, followed by continuation of Wave G toward major demand zones. Smart money bias remains bearish below $117K.
⸻
💬 Drop your alternate wave counts or SMC confirmations in the comments!


BTCUSD ANNASIS OUTLOOK BULLISH MOVE POSSIBLE 4/8/2025BTCUSD – Bullish Opportunity
Current price holding strong above $114,400
Next target: $117,100
Trend momentum remains bullish
Breakout continuation possible above $115,000
#BTCUSD #BullishSetup #CryptoLive #BreakoutWatch

Okay, Let's Take a Live Look Into the Market 📺⚡ Okay, Let's Take a Live Look Into the Market 💹🔥
Important levels across S&P 500, Bitcoin, and XRP are all flashing 🔴 right now. Here's what I'm seeing in real-time:
📈 S&P 500 Futures – 6,351 Is Everything
The 6,351 level marks the midpoint of the rising channel.
On Friday, I flagged 6,430 as critical resistance — price rejected perfectly.
Now we’re attempting a rebound, but we’re stuck at mid-channel.
⚠️ A confirmed breakout above 6,351 could reignite upside momentum.
👉 Yes, this is a 1-minute chart, but precision matters when watching key structural levels — especially in legacy indices.
💥 BTC – 115,700: The Grandmaster Level
Zoom out and see the massive yellow horizontal on the chart: 115,700.
It’s not just any number — this is the ultimate resistance-turned-support battleground.
We’re currently under it, which keeps pressure to the downside.
A reclaim flips the structure bullish and opens room for trend continuation.
📌 Until we’re above it, this remains the dominant resistance across the entire crypto macro framework.
🧩 XRP – Still Facing Rejection
On the 2H/3H chart, XRP continues to flirt with resistance but fails to confirm strength.
This aligns with both the S&P 500 stalling at 6,351 and Bitcoin being capped at 115.7K.
📉 When multiple assets respect key levels in sync, it signals market-wide hesitation.
🔄 Cross-Market Confluence
It’s fascinating to watch:
A TradFi index (S&P)
A macro crypto asset (BTC)
A mid-tier alt (XRP)
...all pivoting around hyper-precise structural resistance at the same time.
✅ These aren’t coincidences. They’re systemic correlations.
🔮 What’s Next?
If S&P 500 breaks above 6,351, it could act as a risk-on signal.
That momentum could help BTC flip 115,700 — a massive deal.
And if that happens, XRP could finally follow with a stronger move.
Until then? We respect resistance and wait for confirmation. 📊🔍
One Love,
The FXPROFESSOR 💙
Disclosure: I am happy to be part of the Trade Nation's Influencer program and receive a monthly fee for using their TradingView charts in my analysis. Awesome broker, where the trader really comes first! 🌟🤝📈

Lingrid | BTCUSDT Range-Bound Market: Short-Term Bearish MoveBINANCE:BTCUSDT has failed to break through the descending resistance near 120,000 and is now forming a lower high within the broader resistance zone. The price action follows an impulsive leg up and is currently tracing a potential reversal pattern under key structural resistance. As long as the market remains capped below 120,000, continuation toward 117,500 is likely. The downward bias is supported by weakening momentum after the bull trap and resistance rejection.
📉 Key Levels
Sell trigger: Breakdown below 119,000
Sell zone: 119,400 – 120,000
Target: 117,500
Invalidation: Break and close above 120,500
💡 Risks
Sudden bounce from the 119,000 handle could trap late sellers
Breakout above 120,000 would shift structure to bullish
Support near 117,500 may slow or reverse bearish pressure
If this idea resonates with you or you have your own opinion, traders, hit the comments. I’m excited to read your thoughts!

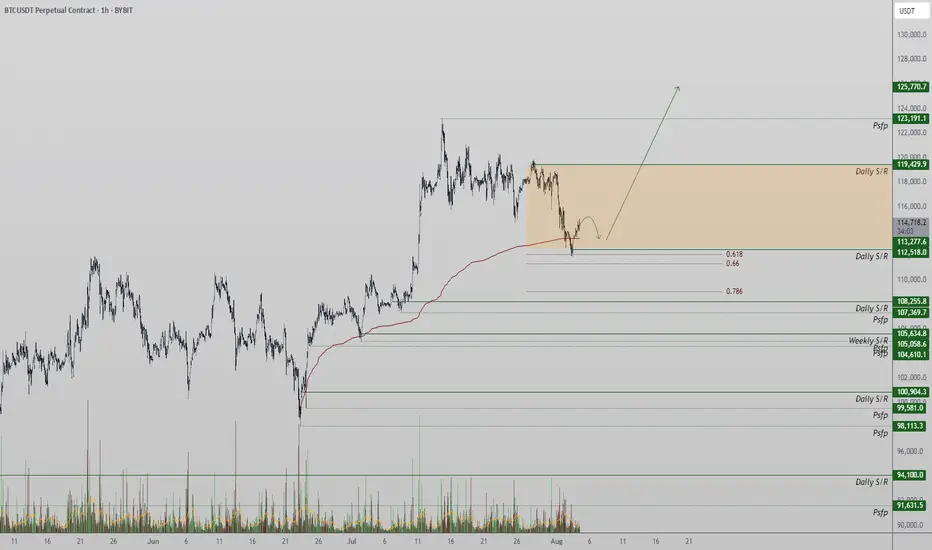
Bitcoin Tests Major Support at $112,500Bitcoin is currently in a local downtrend, with price now testing a major support zone around $112,500. This level, backed by multiple technical confluences, may serve as the base for a potential reversal if defended on lower timeframes.
Price action has been drifting lower over the past sessions, finding its way into a key support zone defined by the 0.618 Fibonacci retracement, the blue upward trendline, and prior structure. The $112,500 region now acts as the immediate level to hold from an intraday perspective. If bulls are able to defend this zone and volume confirms participation, the probability of a rotation higher toward $123,000 increases significantly.
Key Technical Points:
- Support at $112,500: Aligned with 0.618 Fibonacci, trendline support, and structural pivot
- Intraday Confirmation Required: Holding this level on lower timeframes improves the
probability of reversal
= $123,000 Target in Sight: Technical target for rotation if a bottoming structure forms and holds
From a short-term perspective, Bitcoin has clearly shifted into a local downtrend, creating a sequence of lower highs and lower lows. However, the current area around $112,500 presents a strong confluence of support that could interrupt this trend. This zone includes the 0.618 Fibonacci retracement from the most recent swing move, a respected upward trendline (blue), and a previous structural pivot. Together, these elements increase the probability of a bounce—provided price can stabilize.
At this stage, price may still trade sideways and consolidate within this region to form a bottoming structure before any meaningful move higher. For traders, this means confirmation is key. Watching for multiple intraday candle closes above the support zone, paired with an increase in bullish volume, would suggest that demand is building. Only then would the setup favor an entry targeting the local highs.
The upside technical target from this area remains at $123,000, representing the recent swing high and a clear resistance level. A reclaim and rotation to this level would validate the support zone and reintroduce the bullish bias in the short term. Until that occurs, however, price could continue to consolidate, especially if volume remains low or indecisive.
The overall structure still leans constructive, as long as $112,500 holds. A breakdown below this level would weaken the short-term setup and potentially open the door to deeper downside probing. But for now, the region remains a high-probability bounce zone on lower timeframes.
What to Expect in the Coming Price Action
Bitcoin is testing critical intraday support at $112,500. If this level holds with volume confirmation and intraday structure aligns, a rotation toward $123,000 is likely. However, price may continue consolidating at this level before a clear direction forms.
Is the #BTC pullback over?📊 Is the #BTC pullback over?
🧠From a structural perspective, a bearish structure has formed on both the 1-hour and 4-hour charts, so we should be wary of the risk of a further pullback.
➡️Resistance is the area formed by the two necklines (114675-115729).
Support is primarily the overlap between the yellow and green areas (110000-111688). If we can establish a bullish structure on the 1-hour chart here, we still have a chance of continuing the bullish trend.
🤜If you like my analysis, please like 💖 and share 💬 BITGET:BTCUSDT.P

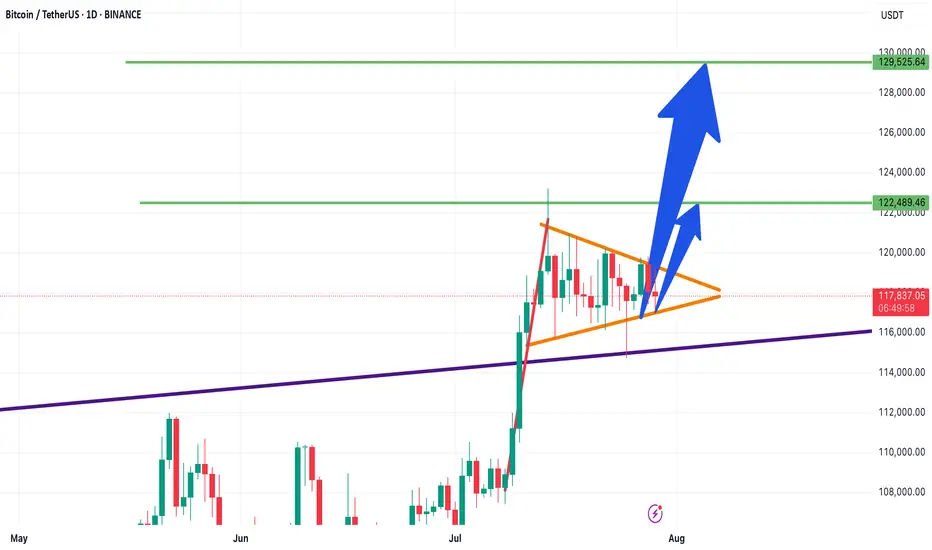
Bitcoin Technical Analysis – Bullish Flag- Symmetrical Triangle📊 Bitcoin Technical Analysis – Bullish Flag or Symmetrical Triangle?
📅 Analysis Date: July 29, 2025
As shown in the chart, Bitcoin appears to be forming a bullish flag or symmetrical triangle pattern—often seen after strong upward moves.
🔹 Bullish Scenario:
If the price breaks above the triangle, the first target is around $122,480, followed by a potential second target near $129,500, based on the length of the flagpole.
🔹 Bearish Scenario:
If the triangle breaks to the downside, the first support to watch is $115,230.
🧭 These key levels act as critical zones of supply and demand, so be sure to keep them on your chart!
🔥 Follow me for real-time setups, clear signals, and expert technical analysis!
BTC 4H – Support Tapped 2x After Breakout, Will Bulls Step In?Bitcoin is retesting a major demand zone that launched the last breakout. After a sharp impulse move, price has ranged tightly and just tapped this support area for the second time.
A clear double bottom attempt is forming, but failure to hold $115K could open the door to deeper downside. Bulls want to see a quick reclaim of $117K to confirm structure still holds.
Clean levels. Clear reaction zones. Let’s see who takes control.

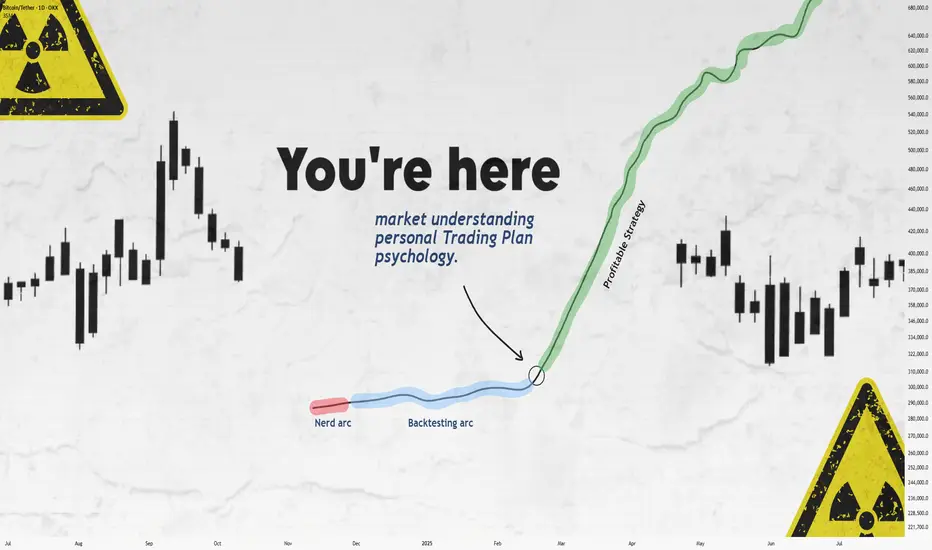
Still Losing After Backtesting? This Fixed It.Let’s get straight to it.
If you’ve gone through the "nerd arc" and the "backtesting arc" but still aren’t profitable...
What’s the fix?
In this short write-up, I’ll walk you through 3 brutal truths that made me finally see green.
Is it hard?
UH—Damn right.
But let’s go 👇
1. Market Understanding
This isn’t something you "learn" from a course.
It’s something that clicks after dozens of stop losses and live trades.
Here are a few ways I got more comfortable with it:
1. Don’t fear opening trades or hitting stop loss.
Each trade gives you data. More trades = more experience = better market feel.
What’s the requirement? Capital and risk management. Without that, you won’t even survive long enough to "get" it.
2. Journaling every single trade.
Write everything: your thoughts, screenshots, feelings — before and after.
Too lazy to do it? Left trading. Simple.
3. Be the detective.
Read the chart like a story. No, seriously.
Think of Bitcoin as a character with real moods.
Every candle tells you something.
That 5% pump? Buyers pushing up. Then bears smacked it down — candle closed red.
Now price is bleeding again.
Why?
🔍 Be the detective.
4. Analyze the market every day — even without trading.
The more you observe, the more you see. Structures. Patterns. Behavior.
Easy? Nah.
It takes discipline — like posting one story text to Insta for 1,000 days straight. Still wanna try?
2. Personal Trading Plan
Remember how I said "don’t fear opening trades"?
Well — after you’ve opened a bunch, you can start tailoring your own trading plan based on you.
This isn’t a PDF you can steal off Google.
Only after seeing how you behave in trades, you’ll know what rules make sense.
Maybe:
"I don’t trade when I’m emotionally off."
"This setup gave me the best results over 100 trades."
Just don’t copy-paste someone else’s rules.
Make a flexible structure, then let the details emerge from the market and your own experience.
Now —
Take a deep breath.
When was the last time you enjoyed your coffee?
More than a day ago?
Go make one now.
Might not get to taste it tomorrow.
Not everything in life is trading :)
3. Psychology
Ah, the final boss.
Still my weakest area, honestly.
But here are a few real things that helped:
Tip 1: WRITE.
Just write whatever you feel.
Telegram saved messages? Notebook?
Or if you're like me (🧠nerd), Notion.
Do it for 60 days straight — then feed that journal to ChatGPT and analyze yourself.
Takes time, but the patterns you'll see are... magical.
Tip 2: Money & Risk Management.
When you know your stop loss means only -0.25% of your capital…
why should you panic?
For me:
I place the SL, set a TP alert, and leave the screen.
No emotions, no fear.
Why? Because when capital is protected, so is my psychology.
Truth is, trading emotions aren’t just during the trade — they live in your head all day.
When your mental energy’s drained?
You’ll miss A+ setups.
Fall for BS ones.
Lose focus.
It’s complicated.
Because humans are complicated.
Our brains are the most tangled system known.
And somehow, out of all that noise, consciousness emerges.
A miracle.
So don’t expect to always feel calm.
Just aim to get better.
That’s it.
Thanks for sticking around.
These are just my thoughts, from one tired trader to another 🧠
I’m no expert—just sharing what’s worked (and what hasn’t).
If it helped, a boost would mean a lot.
🚫 Don’t FOMO
✅ Manage your capital
Until tomorrow —
Peace out. ✌️
$BTC Is Bullish: Bull Flag + Liquidity sweep + RSI DivI see higher targets for bitcoin. right now Bitcoin is forming a bullish flag, two times it has targeted short stops, and on the 4H timeframe we also have an RSI divergence.

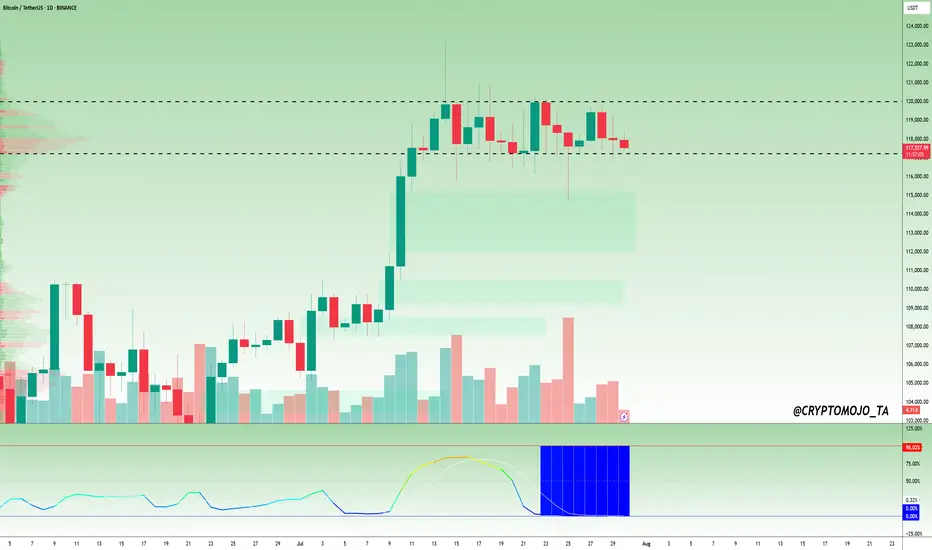
$BTC Daily Timeframe Update! #Bitcoin ( CRYPTOCAP:BTC ) is still moving sideways, consolidating in a tight range between ~$117,400 and $120,100, just below recent local highs. The market is showing clear signs of compression, and the BBWP (Bandwidth Width Percentile) is flashing a deep blue near 0%, which signals extremely low volatility.
Historically, this kind of BBWP reading comes before big price moves. However, the direction is still uncertain as BTC trades between key resistance and minor support.
Key Levels to Watch:
Resistance: ~$120,100
Support: ~$117,400
BBWP: ~0% tight volatility coil
If BTC breaks above $120K, it could lead to strong upside continuation. But if it drops below $117.4K, we might see a deeper correction.
📌 Tip: Wait for volume and BBWP expansion to confirm the next move. The spring is tightly wound, a big breakout is likely coming soon.
DYOR, NFA
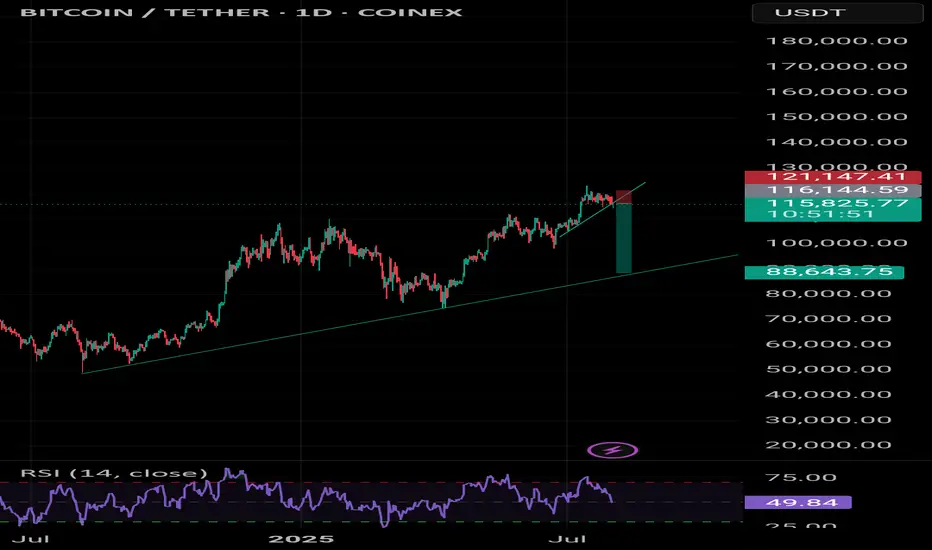
Bitcoin Next Leg Incoming? Targets $134K from Bullish WedgeBTCUSDT is consolidating within a descending wedge right above a critical demand zone, following a impulsive breakout from its prior range structure. This current setup suggests another potential bullish continuation, especially as price continues to respect both the wedge support and internal demand.
With the higher timeframe structure favoring bulls and previous demand zones holding firm, the projected breakout targets align with $123,218 and $134,446 respectively.
A clean invalidation would only be confirmed on a sustained break below the wedge and loss of the strong support area near $110K.
All eyes on the wedge apex as BTC prepares for its next major leg.


Market - BTC - ETH Analysis
💎 Market - BTC - ETH Analysis💎
🟠 Current Market Status: ⚠️ / Low Risk-Reward ❗️ / Avoid Overtrading 🚫
🔷 BTC/USDT (Multi-Timeframe Analysis)
• Weekly (HWC): Last week’s red candle tapped into a buyer zone. A balance or sideways movement is likely this week.
• Daily (MWC): Minor retracement in a downtrend. No clear bullish reversal yet.
• 4H (LWC): Still in a downtrend. For a bullish reversal, we need a Higher Low (HL) followed by a break of the previous High.
• 1H: Breakout above level 116 would signal a short-term trend reversal. Breaking the upper channel confirms bullish continuation in the lower timeframe.
✅ Strategy Outlook:
• HWC: Bullish
• MWC: Bullish
• LWC: Bearish
→ We're not shorting based on LWC unless it turns bullish or MWC flips bearish.
🕒 Conclusion: Stay on the sidelines until the structure shifts clearly.
🔶 BTC Dominance (BTC.D)
• Currently rejected in the 4H chart, but not yet a confirmed bearish structure.
🧭 Two setups to watch before rotating into altcoins:
1. Clear lower highs and lower lows in 1H and 4H
2. Box formation and breakdown in lower timeframes
🚨 Key Level: A break below 60.40 may trigger sharp altcoin rallies.
🌐 TOTAL / TOTAL2 / TOTAL3
• All three charts share a similar structure.
• 1H TOTAL: Break of 4.72 confirms a V-pattern and may trigger upside momentum.
• TOTAL2: Watch 1.42 as a critical level.
→ Until then: No action – Wait for breakout confirmation.
💵 USDT Dominance (USDT.D)
• Ideally should not retrace beyond 4.64 – if it forms a top here, that’s a bullish sign for the market.
• Level 4.44 is less relevant for now.
• Failure to reclaim 4.53 increases the importance of 4.64.
• If it starts dropping, enter before a breakdown of 4.13 to stay ahead of bearish pressure.
🟠 ETH/BTC
• Consolidating in a 4H box.
• Break of 0.03278 is a trigger for long ETH exposure — ideally hold post-breakout.
• Wait for SMA7 on the Daily to turn upward for stronger confirmation.
• Break of 0.03288 on ETH/BTC likely aligns with $3850–$4000 breakout on ETH/USDT.
→ Position should be taken before this breakout to catch the move early.
📌 Final Note:
We are in a low momentum, low R/R environment.
Only trade confirmed breakouts and structural shifts.
Avoid overtrading, keep risk exposure limited, and rely on higher-timeframe confluences for clearer direction.

Bitcoin Go 89kBe prepared for a market correction. BIT has a negative divergence on the weekly timeframe.
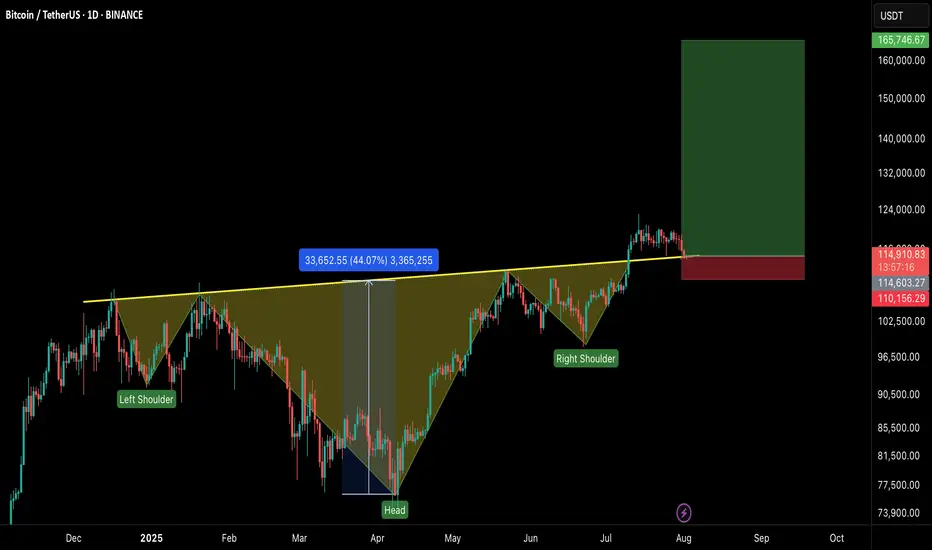
#BTCUSDT – Healthy Correction, Not the End!Bitcoin is currently experiencing a healthy pullback after an impressive run, testing the neckline of the Inverse Head & Shoulders breakout on the 1D timeframe.
🔹 Current Market View:
BTC is retesting the neckline of the IHS pattern, which now acts as a strong support zone.
Price is holding near $113K–$115K, which is crucial for maintaining bullish momentum.
This dip is a healthy correction, flushing out over-leveraged positions and preparing for the next leg up.
🔹 Key Levels:
Support Zone: $113,000 – $115,000
Immediate Resistance: $120,000 – $122,500
Breakout Target: $165,000+ on the next bullish wave
🔹 Market Sentiment:
Holding above the neckline keeps the bullish structure intact.
If the support holds, we can expect continuation to new highs once buying pressure returns.
A daily close below $112K would signal caution and delay the next rally.
💡 Tip: Don’t panic on these red candles. Healthy corrections are part of a sustainable uptrend.