BITCOIN & 134KAfter Bitcoin rallied on July 8 and consolidated for two weeks, this bull flag remains valid, targeting $134,000.
BTCUSDT trade ideas

Bitcoin Go 70k What are you waiting for? It's going to go up more. We have a weekly negative divergence and the correction is now the entire market is bearish.

#BTC Update #13 – Aug 01, 2025#BTC Update #13 – Aug 01, 2025
Bitcoin has approached the lower edge of its current channel and received a reaction from there. However, in the current timeframe, the ongoing candle seems willing to pull back again. The MA200 band held the previous candle well, which also represented the bottom of the current channel. There is high liquidity between the $113,200 and $121,000 zones. I believe Bitcoin will continue to move by sweeping through this region. Therefore, I think Bitcoin’s current target is to reach around the $118,000 level with a 3% push move.
If Bitcoin does not make this move and chooses to pull back instead, it may go as far as filling the imbalance at the $110,000 level. The last impulsive move was made around 20 days ago, and since then, the chart has been progressing with a correction of a correction. As long as there’s no close below $107,500, the uptrend will remain intact in the long term. However, if the $107,500 level is broken with a strong candle, we can say that Bitcoin has turned bearish on the 4-hour timeframe. For now, this doesn’t seem very likely. I believe Bitcoin’s next move will target the $118,000 region, continuing to clear out the liquidity accumulating in the upper ranges. However, this channel will need to break at some point.

Bitcoin (BTC): Still Above Local SupportIt's been a choppy week so far but BTC is still above the local support zone, which means we are still bullish and the bullish sentiment has not disappeared (for now, at least).
We wait for and mostly keep an eye on that middle line of BB (Bollinger Bands) for now. The order book is our friend currently as well with all those liquidity hunts taking place!
Swallow Academy

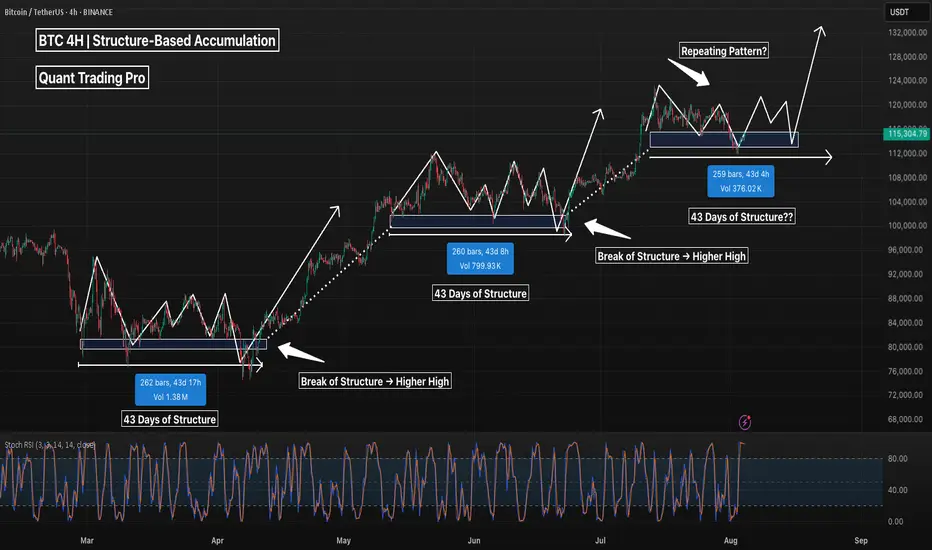
BTC 4H – Repeating Accumulation Pattern, But Will It Hold Again?Bitcoin has shown a clear structural tendency to consolidate for ~43 days at key demand zones before breaking to new highs. This 4H chart highlights three nearly identical accumulation phases, each lasting around 260 bars with a clear base, fakeout, and bullish continuation.
We’re now sitting in the fourth demand zone, with price revisiting the same volume pocket and reclaiming key structure. If history repeats, we may be looking at another breakout leg above $124K+.
Key observations:
– Each consolidation zone lasted ~43 days
– Volume decreases into the base → demand absorption
– Reclaim of structure precedes each leg up
– Current consolidation mirrors previous 3 (in time, shape, and volume)
⚠️ A clean break below ~$112K would invalidate the pattern and suggest deeper retracement.
Are we seeing another accumulation leg… or distribution in disguise?
Drop your thoughts below.
#Bitcoin #BTCUSDT #Crypto #TradingView #PriceAction #MarketStructure #BTC4H #CryptoAnalysis #Accumulation #Wyckoff #SwingTrading #PatternRecognition #TechnicalAnalysis
Technical Analysis: All About Its Origin
Technical Analysis is the discipline that studies and graphically records the price and volume changes of a stock or asset, with the aim of exploiting recurring patterns and phenomena with predictive characteristics.
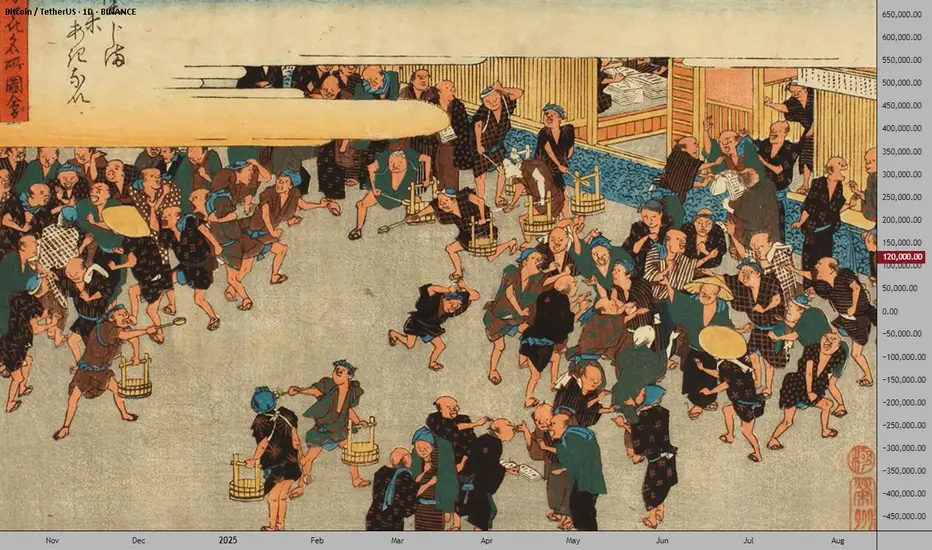
The origins of Technical Analysis date back to 17th-century Japan, in the rice futures markets of Osaka. After a century of internal wars among the daimyo—Japanese feudal lords—General Tokugawa emerged victorious at the Battle of Sekigahara (1600), initiating the unification of Japan. To maintain the loyalty of his subjects, Tokugawa, appointed Shogun, consolidated his power and ensured the allegiance of his followers by concentrating the political-military elite and their families in Edo (modern-day Tokyo).
At that time, the primary source of income for the daimyo was rice collected from the peasants working their lands. Since transporting rice to Edo was impractical, it was stored in the port of Osaka. The proximity of the daimyo in Edo sparked a competition for prestige, manifested through luxuries and other excesses. To sustain this lifestyle, the daimyo sold stored rice and even future harvests. For this “future rice,” warehouses began issuing contracts known as “empty rice.” These contracts were traded in a secondary market, giving rise to one of the world’s first futures markets.
The most prominent trader in this market was Munehisa Homma, who operated in the early 18th century. For Homma, markets were heavily influenced by the psychology of investors, who sometimes perceived a harvest differently from reality. In his book, *The Fountain of Gold*, he expressed ideas that remain highly relevant today, particularly what many Western traders know as contrarian opinion:
“When the price of rice begins to rise, orders come in from all directions at once, and soon the Osaka market joins the frenzy. The price of rice rises faster when people place orders even for stored rice, and it becomes clear that a buying fever is underway. But when you want to be in the position of placing buy orders like everyone else, it’s important to be on the side of those placing sell orders. When people move in unison, rushing westward with the determined intention of participating in the rise, that’s the moment for you to head east, and you will discover great opportunities.”
Steve Nison, an investor who popularized the use of Japanese candlesticks in the West, states in his book *Beyond Candlesticks*:
“In the material I translated, candlestick charts are often called Sakata charts, in reference to the port city of Sakata, where Homma lived. However, based on my research, it is unlikely that Homma used candlestick charts. It is more likely that these charts were developed in the early part of the Meiji period in Japan (late 1800s).”
It is worth noting that, although Homma may not have used candlestick charts, this type of graphical representation was the evolution of centuries of experience using price records for predictive purposes.
The Revolution of Japanese Candlestick Charts
The graphical representation of prices has been a determining factor in the evolution of technical analysis, marking a clear distinction between investment approaches in the East and the West. While traditional bar charts, predominant in the West, were limited to showing opening and closing prices, Japanese candlestick charts offered a more comprehensive view of investor psychology. These charts incorporated not only the opening and closing prices but also the highs and lows of each session, represented intuitively through the body and wicks of the candles.
Perhaps Western investors, constrained by the simplicity of bar charts, developed an approach more focused on studying price formations, while the Japanese could make decisions based on the analysis of small groups of candles. Over time, however, both approaches proved equally practical, and a multi-timeframe understanding became part of the operations of both Western and Japanese investors.
An example of the application of a multi-timeframe approach in the West is found in the father of modern technical analysis, Richard W. Schabacker, who, despite his short life, left a prolific body of work. In his book *Technical Analysis and Stock Market Profits* (1932), he classifies markets into major movements (monthly), intermediate movements (weekly), and minor movements (daily). In Japan, Goichi Hosoda, the creator of the Ichimoku Kinko Hyo indicator, is the best example of an investor who dedicated his life to cataloging and studying price formations beyond the use of candlestick patterns.
Over time, modern Western investment platforms adopted the innovations of Japanese candlestick charts, integrating the ability to display highs, lows, openings, and closings in a single format.
In the early 20th century, scholars of charts in the West were known as chartists, but today, “Chartism” is associated with a classical methodology popularized by journalist and investor Richard W. Schabacker (1899–1935) and later by the book *Technical Analysis of Stock Trends* (1948) by authors Robert D. Edwards and John Magee.
Theory on the Emergence of Technical Analysis
Since the dawn of humanity, people have sought to represent the phenomena around them to understand or communicate information. Whether through cave drawings, symbols, or written records, visual representation has been a fundamental tool for making sense of the world. Undoubtedly, price fluctuations were a phenomenon that invited analysis.
The earliest investors, using graphical representations, aimed to find order in chaos. By meticulously recording price movements, these pioneers likely discovered something surprising: repetitive patterns that seemed to predict future behavior. This discovery must have been thrilling, as it offered the promise of significant profits, often with seemingly low risk.
Without needing to understand market psychology, as later technical analysts would, these early investors found a practical advantage in these patterns. When enough of them identified and acted on the same pattern, it tended to fulfill itself more frequently, reinforcing its validity. Thus, what began as an intuitive observation evolved into a structured practice, laying the foundation for what we now know as Technical Analysis: a discipline that thousands of investors use to interpret market behavior and make informed decisions.
Fun Fact
The first work to describe the phenomenon of stock market investing is titled *Confusion of Confusions* (1688) by José de la Vega, set in Amsterdam, the financial hub of Europe at the time. More than a detailed study of the investment methods of the era, this novel seeks to entertain and inform readers about the risks of speculation.
Its author, moreover, employs a narrative style that surpasses even the florid prose of his contemporaries:
“They strive to perpetuate the unrest of those who frequent their dealings, and just as they imprison them in their towers, they cast the locks into the sea so that the hope of ever removing the bolts may never flatter them.”
Conclusions
Some might consider the history of technical analysis a curious but irrelevant tale for modern practice. However, history shows us that markets are more than just numbers—they are a reflection of human psychology. Far from being a mere catalog of tricks to memorize, technical analysis invites us to understand psychological dynamics to make informed decisions.
Recognizing that markets are shaped by historical patterns grants us a strategic advantage. By studying how past investors interpreted prices and emotions—from rice traders in 17th-century Japan to modern analysts—we can anticipate market movements with greater precision. This perspective not only enriches our trading but also positions us as more aware and prepared investors in an environment where collective psychology remains the dominant force.
References
Nison, S. (1994). *Beyond Candlesticks: New Japanese Charting Techniques Revealed*. New York, NY: John Wiley & Sons.
Schabacker, R. W. (1932). *Technical Analysis and Stock Market Profits*. New York, NY: B.C. Forbes Publishing.
Edwards, R. D., & Magee, J. (1948). *Technical Analysis of Stock Trends*. Springfield, MA: John Magee.
Rabassa, Y. (n.d.). *How to Master Japanese Candlesticks?* . YouTube.
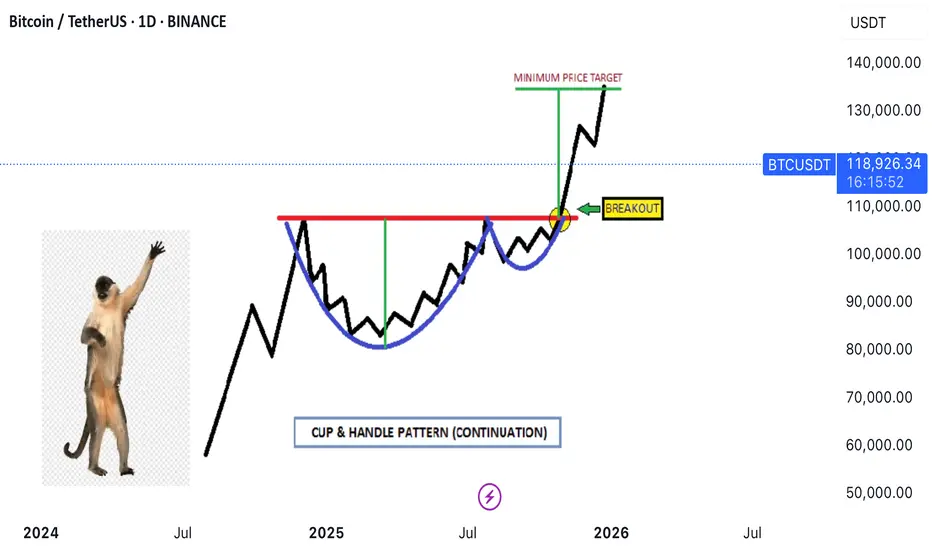
Thea **Cup and Handle** pattern✨ **Imagine the market serving profits in a teacup!**
Thea **Cup and Handle** pattern isn’t just a technical term—it’s the market whispering, *“Get ready for liftoff!”* Let’s break it down in an engaging way:
### ☕ The Cup
- Picture a graceful drop in price that curves back up, forming a U-shape.
- It’s like the market takes a sip, then refills—symbolizing recovery and building strength.
### 🛠️ The Handle
- After the cup fills, the price dips slightly again, forming a small slope downward.
- This is the “handle”—a moment of consolidation, often with lower trading volume.
- It’s the calm before the bullish storm.
### 💡 Bullish Signal
- When the price **breaks above the handle’s resistance**, it’s like the market pulls the trigger.
- This signals a potential buying opportunity as the trend resumes upward.
### 📆 Duration
- The cup can take weeks or even months to form, while the handle is shorter and more subtle.
- Patience pays off, as the breakout often leads to explosive momentum.
---
🏆 *Want proof?* Check the comments—one of our past trades using this exact pattern scored a massive win of **100,000 pips**! 🚀
Technical analysis isn’t just charts and numbers—it’s decoding the market’s rhythm.
From Fakeout to Takeoff: How the V-Pattern REALLY WorksEver seen a support level break, only for the price to rocket back up in a V-shape? That’s the V-Pattern in action! In this post, Skeptic from Skeptic Lab breaks down the step-by-step mechanics of this powerful setup. From the fakeout that traps short sellers to the surge of buy orders from liquidations, you’ll learn exactly how buyers flip the script and create explosive reversals. Perfect for traders looking to spot high-probability setups. Join me to decode the markets—check out the steps and level up your trading game!

TradeCityPro | Bitcoin Daily Analysis #137👋 Welcome to TradeCity Pro!
Let’s go over the Bitcoin analysis. I’m making a change to how I analyze Bitcoin — I will no longer include indicators like dominance charts.
🔍 From now on, I’ll be analyzing Bitcoin in daily, 4-hour, and 1-hour timeframes only.
📅 Daily Timeframe
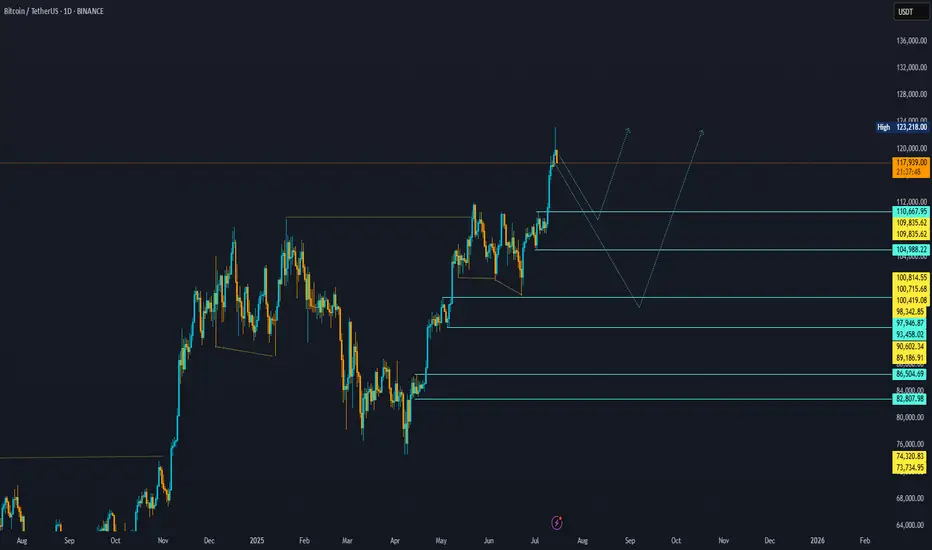
On the daily timeframe, Bitcoin is in a strong uptrend that started from the 78,397 level and in two bullish legs has reached the 122,733 zone.
✅ This level, along with the 0.618 Fibonacci Extension, has created a strong resistance zone. Although price has attempted multiple times to break into or above this area, it has not yet succeeded in closing a candle above or inside the range.
🎲 We also have a curved trendline from higher timeframes, which the price is reacting to even on the daily chart. Currently, the price is near this trendline. There is a possibility that price consolidates over time until it reaches this trendline and then begins its next bullish leg.
📊 If that happens, breaking 122,733 or 120,140 would be triggers for opening a long position on the daily timeframe.
I do not recommend buying Bitcoin on spot right now, because I believe we’re close to the top of this bullish cycle, and this current leg might be the last one.
⭐ A breakout of 76.50 on the RSI would be a strong confirmation of bullish momentum, and would mark the continuation of the uptrend.
🔑 If we get a pullback, the price could correct to dynamic zones like SMA25 or SMA99. Important static support levels are at 110,183 and 100,763.
⏳ 4-Hour Timeframe
In the 4-hour chart, we can see more details of the bullish leg. After the sharp move to 122,733, a correction phase began, forming a range box.
💥 The bottom of the box is around 116,829, which I’ve marked as a zone. It also overlaps with the 0.382 Fibonacci, making it a very important PRZ (Potential Reversal Zone).
The top of the range is at 120,041.
🧩 Yesterday, price made a fakeout to the downside. As you can see, it dumped hard with heavy selling volume and hit the 0.5 Fibonacci level, but couldn’t hold there and quickly bounced back above 116,829.
🧲 Today, I think it's better not to go below the 4-hour timeframe and avoid getting caught up in small market noise.
A break above 120,041 can trigger a long entry.
Another breakdown from the box might trigger a deeper correction.
❌ Disclaimer ❌
Trading futures is highly risky and dangerous. If you're not an expert, these triggers may not be suitable for you. You should first learn risk and capital management. You can also use the educational content from this channel.
Finally, these triggers reflect my personal opinions on price action, and the market may move completely against this analysis. So, do your own research before opening any position.

BTC - Trap, Tap, and Blast Off!BTC has been overall bullish, trading within the rising blue channel (1). After reaching a local high, it entered a short-term correction, forming a falling red channel (2).
👀All eyes are now on the key demand zone (3), which aligns with the lower bound of both the red channel and the rising blue structure.
🔎As long as this confluence holds, we anticipate a potential bullish impulse in August.
A retest of the $111,500–$112,000 zone could serve as the trigger for the next leg toward $128,000. Let’s see if BTC is gearing up for another breakout or if a deeper correction is in play.
🔔 Disclaimer: This analysis is for educational and informational purposes only. It does not constitute financial advice or a recommendation to buy or sell any asset. Always do your own research and manage your risk accordingly.
📚 Always follow your trading plan => including entry, risk management, and trade execution.
Good luck!
All strategies are good, if managed properly.
~ Richard Nasr

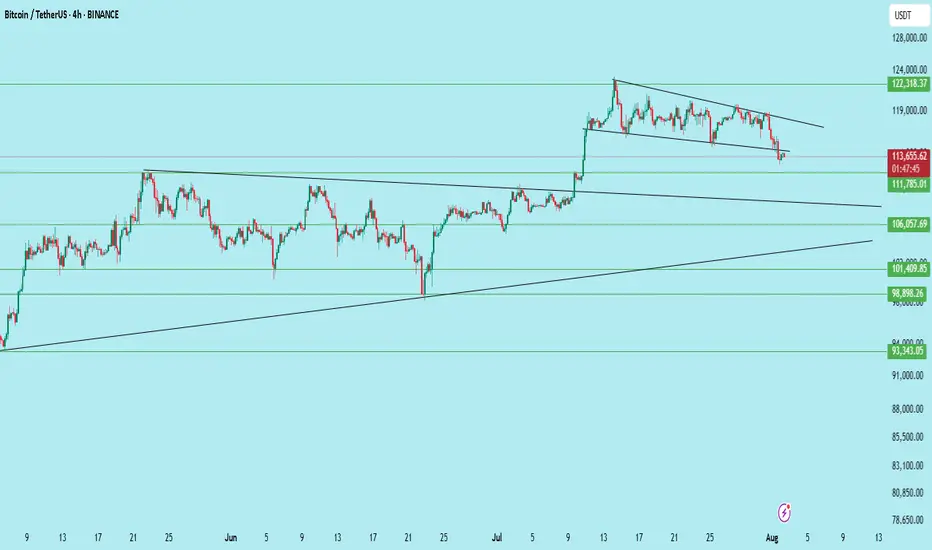
$BTC /USDT – Breakdown from Channel, Bears Gaining ControlBitcoin has broken down from its descending channel on the 4H chart after repeated rejection from the upper trendline. Price is now hovering near key support at $111,785.
Key Technicals:
Rejection from the descending trendline resistance
Breakdown of the mini-channel structure
Current price: $113,637
Support levels:
$111,785 (Immediate)
$106,057
$101,409
$98,398
Bearish continuation is likely if $111,785 breaks with volume
If the $111.7k zone fails to hold, BTC could see further downside toward $106k and even $98k in the coming sessions.
Invalidation: Bullish only on reclaim of $117K+ with strength.
DYOR | Not Financial Advice
BTCUSD : Key levelsI added meaningful levels to my past forecast (I can't add a link to my last forecast by the way, because as it turns out I have to actively participate in other people's discussions, which I am unlikely to do. And if I do, then to be able to add links to my predictions. So you have to check my prev forecast in the my profile overview).
So far, all levels are inactive except for the ~116,600 level. It's still in play.

Bitcoin will reach 128,000 points!Bitcoin is currently trading in a very specific zone that resembles a classic bull flag continuation pattern, similar to the one we saw during last year’s rally.
Back then, a slow-forming bull flag broke to the upside, pushed to new all-time highs, and then retested the top of the same flag before continuing higher.
Now, we are witnessing a similar setup, but this time the formation has developed much faster.
The key difference:
While last year’s bull flag took a longer time to mature, the current one is more compressed, indicating a potentially sharper move if confirmed.
The $108K daily level is critical.
As long as Bitcoin remains above this level, the structure favors a new rally.
This could be the start of another impulsive leg, targeting the $128K Area.

BITCOIN FALL TO 78K ! OR GOING TO 170K ?📊 Bitcoin Possible Scenarios (BTC/USDT Analysis)
🟢 Green Scenario (Immediate Bullish Breakout):
If the price breaks above the $120,000 resistance without any significant pullback, this would signal strong bullish continuation. It suggests buyer dominance and could lead to a fast move toward higher levels.
🟡 Yellow Scenario (Bullish Correction):
If BTC fails to break $120,000, we may see a drop toward $112,000. If this level breaks, price could head down to $100,000 to collect liquidity and attract buyers. From there, a strong rebound is likely, restoring bullish momentum (with weekly trendline support)
🔴 Red Scenario (Bearish Reversal):
If price breaks clearly below $100,000, especially with a violation of the weekly trendline, this could trigger a deeper correction toward the $78,000 – $74,000 zone. This scenario would mark a potential shift in long-term market structure.
Main Target : 170,000

Bitcoin (BTCUSDT) - Possible Completion of a Complex CorrectionTimeframe: 4H + 1H
Methodology: NeoWave (Glen Neely) + Smart Money Concepts (ICT/SMC)
Posted by: @CryptoPilot
⸻
🧠 NeoWave Analysis: Complex Correction Ending?
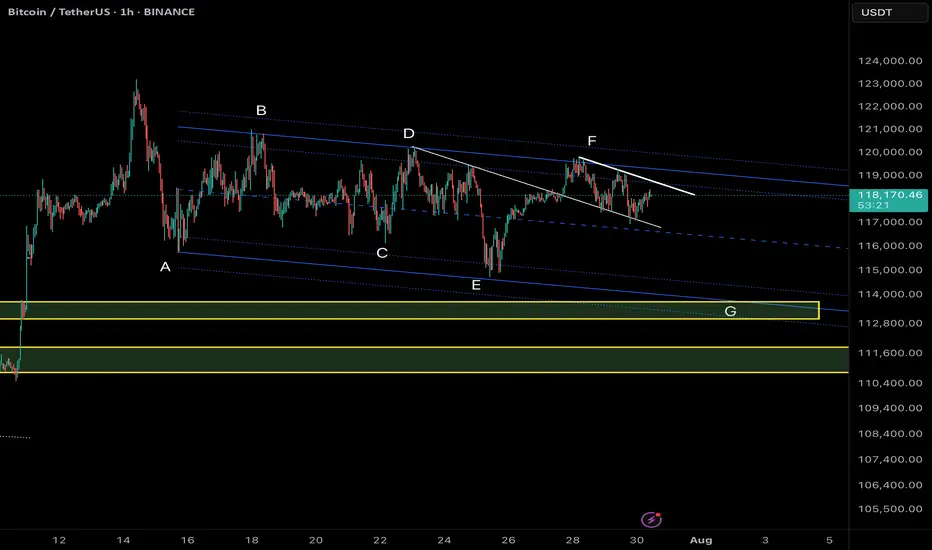
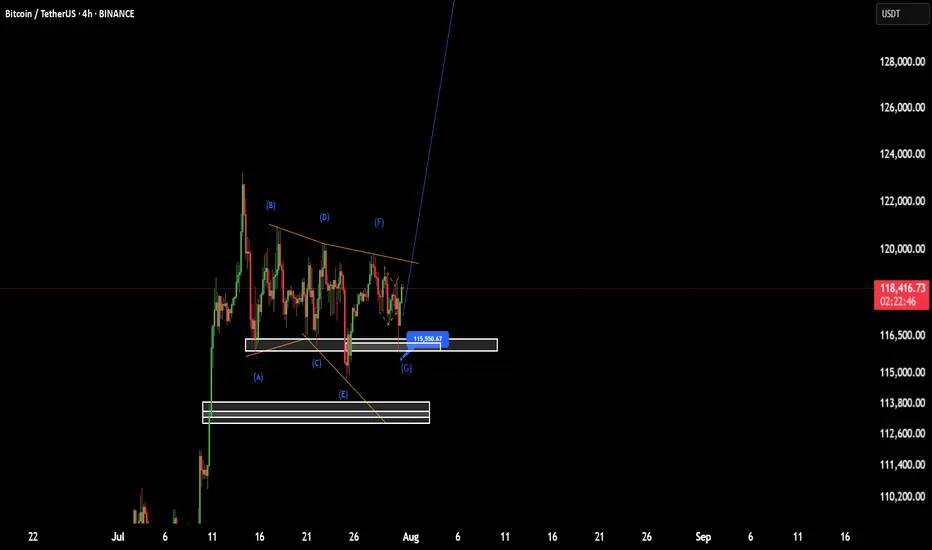
From a NeoWave perspective, BTC seems to be in the final stages of a Complex Correction that started in March 2025 from ~72k. The upward move appears to form a Contracting Diametric structure (7 legs: A–B–C–D–E–F–G), with the current leg G potentially unfolding now.
• ✅ Wave A: Sharp recovery from March lows
• ✅ Waves B–F: Alternating corrective legs with varied time and complexity
• 🔄 Wave G: Could be starting now, expected to break structure to the downside
This suggests that the entire move from March till now may represent a large Wave B, setting the stage for a deeper Wave C down.
⸻
🔍 Price Action + Smart Money Confluence
The following observations strengthen the NeoWave scenario:
• 🟨 Liquidity Pools above 120k were swept recently, creating a potential Buy-side Liquidity Grab
• 🟥 Imbalance/FVGs below 114.5k remain unfilled
• 🔻 Market Structure Shift (MSS) evident on 1H chart — lower highs forming
• 🧠 Price rejected from a key Supply Zone, aligning with end of Wave F
• 🟩 If price re-tests the internal bearish OB (near 119.5k–120k), it may provide an ideal short trigger
⸻
📌 Key Levels to Watch:
Level
Description
120.2k
Liquidity sweep zone / MSS confirmed
118k
Current structure base (pivot)
114.5k
FVG + potential Wave G target
111–112k
Strong demand zone (accumulation support)
🧭 Scenario Outlook:
Primary:
→ Price is in Wave G of a Diametric (NeoWave)
→ Likely to unfold as a 3-leg Zigzag down or a Complex combination
→ Objective: break below Wave E low and target the unmitigated imbalances
Alternative:
→ Extended Flat or Triangle, if 120.5k is broken impulsively
→ Invalidation = clean break and hold above 121k
⸻
⚠️ Risk Note:
This analysis assumes Wave G is beginning. If bulls manage to reclaim 120.5k with momentum and close above, the bearish structure will be invalidated.
⸻
💬 Final Thought:
We are potentially nearing the end of a complex corrective rally. The confluence of NeoWave structural symmetry, Smart Money traps, and market inefficiencies suggests that BTC may be preparing for a retracement. Stay alert for confirmations before executing.
⸻
📌 Follow @CryptoPilot for advanced wave structure updates, market geometry insights, and ICT-style smart money traps.
💬 Share your views or alternate wave counts in the comments!
btc short tradeon 1hr timeframe btc take the inducement and on 15m done MSS and now rice going to retest the 15m advanced oder block
entry 19131
stoploss 120990
target 1; 114685
target 2 ; 113650

BTC(based on NEo wave)I think wave G is finished and soon it will pump to 138K.
stop loss is 115500.
attention:138K is the first target of these bullish waves.
BTCUSDTHello Traders! 👋
What are your thoughts on BITCOIN?
After setting a new all-time high, Bitcoin remains in a corrective phase, marked by sideways price action and choppy movements.
There's a notable gap around the $114,000 level, which may act as a magnet for price during this correction.
The ongoing pullback is likely to extend toward the key support zone, which aligns with the previous breakout level and the bottom of the ascending channel.
Once this support holds, we could see a bullish reversal, targeting the upper boundary of the channel once again.
As long as Bitcoin remains above the marked support zone, the overall structure stays bullish and this correction may present a buy-the-dip opportunity.
Will Bitcoin fill the gap and bounce back toward new highs? Let us know your thoughts! 🤔👇
Don’t forget to like and share your thoughts in the comments! ❤️

BTC is just beginning its correction🌐 As always, people like to find meaning in everything to make life seem simpler and more meaningful. So, once again, Trump has been blamed for the market crash.
Probably, if it weren't for geopolitics, Bitcoin would have grown indefinitely, and no one would have taken profits, but simply admired the numbers in their accounts 😁
But this is the real world, and BTC has long been asking for a correction along with the entire market, which I have been talking about for a long time in my ideas.
That is why this is not just a dip, but the likely beginning of a full-scale correction:
➡️ Last week's decline was expected because there is a GAP at $117,000 - $111,245 at these levels. Now that it is almost closed, a new GAP has formed during the decline at $118,403 - $115,245.
➡️ Volume - The volume of purchases at this price is simply negligible; no one wants to buy the dip even at $112,000. In addition, a divergence has been forming since last week in the volume of purchases, which has been declining for a long time.
➡️ Money Flow - very little liquidity entered on the rebound. This signals a lack of interest in buying the dip. The indicator is firmly in negative territory.
➡️ The price has also returned to the boundaries of the descending flag. Technically, this means a probable rebound to $118,000, the upper boundary of the flag, where the GAP is practically ending.
📌 Conclusion:
The main question now is: what next? Either we go higher and close the GAP from above, or we go down to retest the bottom from Sunday and close the GAP.
So far, everything points to the second scenario being more likely.
✍️ What do you think will happen next for BTC?

BTC next bull run after taking restAs is clear, BTC has made a new high, and we should wait for the next bullish entry after a retracement.
Could this be the end of Bitcoin’s trend?The Current State of Bitcoin’s Trend: Has the Uptrend Come to an End...?
Based on recent analyses, Bitcoin has exited its 4-hour channel over the past few days, and there is still a possibility for further correction. However, this does not mean that the uptrend for Bitcoin is over.
My targets for Bitcoin remain the same as before: 123,700 and 129,710. It’s even possible that we might see a wick above these prices.
For those with more capital who are looking to buy Bitcoin, there are two good entry levels:
110,880
109,770
Everything else is clearly shown on the chart. Please be cautious, as there will likely be high volatility once the market opens.
Be sure to open the analysis link and boost the analysis with your likes.

FUTURES SIGNALFUTURES SIGNAL
Coin: BTC
Direction: LONG
🟢Input range: 118109
✔️ТР: 118890
❌SL: 117923
We trade with the trend, stop at the minimums

BTC | Short Bias — Targeting $113kPrice rejected perfectly off the 0.5 retracement and is now filling the previous imbalance.
Yesterday's daily close was decisively bearish, confirming downside momentum.
There’s a lack of convincing reversal signals at current levels.
Plan:
Main expectation is continued downside toward the $113k support.
Not interested in longs until price stabilizes at or below that level.
