BTC/USDT Analysis — Buyer Weakness
Hello everyone! This is the trader-analyst from CryptoRobotics with your daily market analysis.
Yesterday, Bitcoin finally moved into a correction after forming resistance at $121,500–$122,300. There was no reaction at the nearest support around $120,000 (push volumes). Only at $119,000 did buyers attempt to step in — the delta suddenly turned positive — but for now, all buying attempts are being absorbed.
The scenario is currently highly mixed: on the one hand, wave analysis shows we are still in a strong bullish trend; on the other, volume spiked sharply at the top and is being positioned for shorts, while there was also no clear defense at support.
At this stage, we expect further correction either from current levels or after a retest of ~$120,000 (mirror zone). After that, we will watch for the buyer’s reaction at the lower support zone. This scenario will be invalidated if $120,000 is broken without any defense from sellers.
Buy Zones:
$117,500–$116,000 (accumulated volumes)
$115,300–$114,000 (accumulated volumes)
Sell Zones:
~$120,000 (mirror zone)
$121,500–$122,300 (volume zone)
This publication is not financial advice.
BTCUST.P trade ideas

BTC is in the 4th wave zone.BTC is in the 4th wave zone. Key support at 108.8K — as long as price holds above, targets at 123K and 130K remain in play. A break below cancels the scenario.
#BTCUSD #Bitcoin #ElliottWave

BITCOIN (BTCUSDT): 12 AUG, 2025 || ELLIOTT WAVE ANALYSISConclusion: Wave iii))-green is continuing to move higher.
Key Points: Wave iii))-green is extending, and subdividing into wave i)-purple to wave iv)-purple. I am not sure if wave iv)-purple is finished, but it should not move lower than 115,720 (Invalidation Point: Wave 4 should not overlap wave 1).
On the other hand, 118,050.11 acts as a key level that price needs to hold higher, to gain confidence, weight for this view.
©By Hua Chi Cuong (Shane), CEWA-M | Certified Elliott Wave Analyst - Master Level

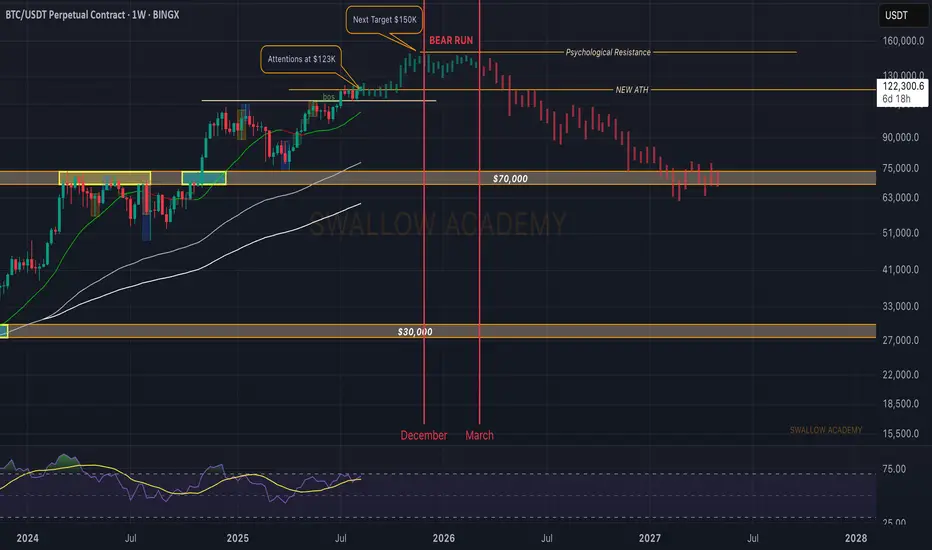
Bitcoin (BTC): Approaching ATH | Marking Potential Cycle TopBitcoin on the weekly timeframe is showing a strong start to the week, where the price is looking for a potential breakout, which then could result in yet another ALL-TIME-HIGH.
Now markets have been very volatile lately, so being close to ATH makes the situation pretty dangerous, so for better opportunities to trade, wait for that proper breakout (which most likely will be an aggressive one).
Now as we approach the end of 2026, we are also thinking that the bull cycle is in the ending phase and 2026 should mark itself as the start of a bear market, so let's get ready and prepare ourselves for it.
We still have time before that so alts still have their chance!
Swallow Academy
Bitcoin Go 140kBit is moving towards liquidating sellers and there is generally high liquidity.
Pls careful
Liquidity zone 130,000 __144000
⚠️⚠️⚠️⚠️⚠️⚠️☠️☠️☠️

BTC 4H Ascending Support Break, Can Momentum Push Higher?BTC broke its prior downtrend and is now riding an ascending support line. Price remains above the 200 EMA and has reclaimed a key support zone. MACD histogram has flipped positive, showing building bullish momentum. A sustained hold above the trendline could open the path toward higher levels, but a break back below support would weaken the structure. Monitoring reaction near $118.5K for confirmation.

btc signalThe analysis went well, but put the breakeven and would you like me to put more signals? I would be happy to hear your comments.Two signals and two profits. Thank you for your attention.

Bitcoin inverted HEAD & SHOULDERSIf this is an inverted HEAD & shoulders pattern for bitcoin, then the neckline is already broken and bitcoin is Back testing that now, well the target is $160k as well

Why I'm bullish on Bitcoin!While everyone starts questioning if its over for Bitcoin, I'm bullish
Inverse head and shoulder going into 2 bull flags so far. Target is 149k'ish.
Unless I see some movements that cancel out these patterns I'm forever bullish.
Support on 112k is important to stay above if we break below and close below forget about this idea.

Short Probably!Hello all. before all I wanna tell you that I am not a crypto trader and it is unknown market to me but if it works as Forex market, market will go down from here. be happy(wink)

I just got filled for a long hereAs an alert I just got filled with a small limit order long and intend to add to it within this range with more frequency in the bottom half with (again) very small orders as I want to average down my entry price before we ideally pump up next if it works out that way. And if not (so in the case we gradually keep grinding down in price) I can continue to add longs until we get a bounce which may provide the opportunity to get out at break even or a small profit. But I am happy with the value of the areas I have focused on and not chasing pumps. Enjoy!

Possible run to 130 in the cardsEasily invalidated.
We are using the patterns from the price action post threshold break (redline in bottom pane)
These breaks are unseen on this time frame
The volume instabilities are between the 15 minute and the 1 hour. I would look for breaks under 15 minutes, too much noise at that level. Go ahead and test it yourself. See my script posted on trading view for details.

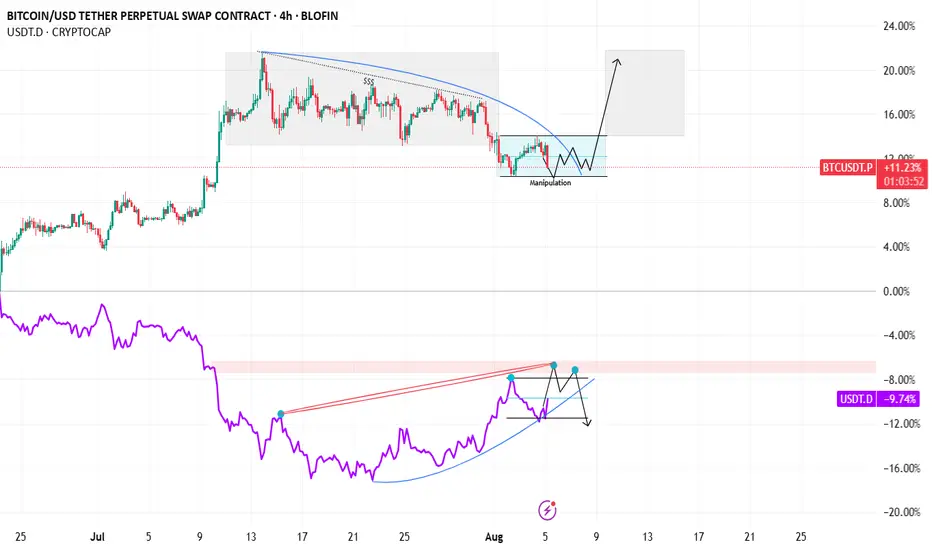
BTC PO3 setup with USDT D confluenceBTC PO3 with USDT D confluence.
BTC is in a LTF Range, where we can accumulate at the range low.
In confluence with USDT Dominance distributing in the LTF + MTF Range this can be a extra + 1 on a long on btc
Make or Break. This next move is a big deal for me personallyTo stand behind the AI I have gone all in on this next move
Many things can go wrong, including a wick that liquidates my position, me getting in too soon or perhaps the AI did as well as it could until now, but did not get the next move correct.
Whatever happens, I'm all in. (this is not to say you should do the same, its to say I believe in my craft and am backing it with massive action).
Lets see what the Bitcoin Gods have in stall

Is the current Bitcoin price a good place to buy?Bitcoin has been falling since last night towards $112,000. I don't think it will go below that. I think $113,000 is a good price to buy. Of course, with a stop loss of 111,500. This is not a financial offer. Don't get into futures trading because you might lose all your money.

BTC DAILY - CUP & HANDLE BREAKOUT TARGETING $169KBitcoin just confirmed a macro Cup & Handle breakout with a strong push above the $112K neckline. The price is now consolidating above key moving averages – setting up for a potential explosive continuation. 🔥
🟢 Technical Highlights:
📈 Cup & Handle pattern – classic bullish continuation
💥 Breakout target: +32% move → $169,000
🟩 1D MA 50 / MA 200 acting as dynamic support
🔄 MACD bullish cross confirming momentum
🟦 Breakout above major resistance = new market structure zone
🧲 Psychological support near $99K and $112K
***********************************
🎯 Buy Signal Details:
Entry Zone (Pullback Valid): $112,000–$114,000
Take Profit: $169,000 🎯
Stop Loss: $99,000 🛡️
Buy Confidence: 95% ✅
📌 Not financial advice. This is pure chart-based technical analysis.

BTC ~ will it make new lows!?Ideally its following the pattern i drew, and latter after NY session, it would claim the lows ideally after the buying activity I am antiiipating now!

BITCOIN TRADING IS 100% PROBABILITY,ANY KEY LEVEL IN THIS CHART CAN FAIL,pls manage your risk and build a strong mindset.
bitcoin is showing a bullish drive. If i retest the 123k level again and gets rejected we are selling down ,the structure has given us a clue on 135k and above possible upswing on sentiment ,this level represents the ascending trendline and a supply roof.
#btc #bitcoin #crypto #eth #sol

04/08/25 Weekly OutlookLast weeks high: $119,809.82
Last weeks low: $111,917.76
Midpoint: $115,863.79
First net outflow for BTC in seven weeks (-$643m) following the FOMC data release and also month end. Yet again no change by the FED but the chances of Septembers FOMC giving us a rate cut has drastically increased, currently at a 78.5% chance of a 25Bps cut.
Month end usually gives us a pullback/sell-off as larger institutions window dress which often includes de-risking somewhat. We saw this last Thursday combined with the weekends typical lower volume has resulted in quite a significant correction for BTC. Altcoins have down the same as many assets reject from HTF resistance areas, the correction has been on the cards and isn't too worrying on the face of it.
What I would say is August seasonality is generally not a bullish month and so expecting price to rebound and extend the rally would go against historical trends. I could see more of a ranging environment taking place for several weeks before any next leg up is possible.
This week I would like to see where altcoins find support and establish a trading range where some rotational setups tend to present themselves.

Okay, Let's Take a Live Look Into the Market 📺⚡ Okay, Let's Take a Live Look Into the Market 💹🔥
Important levels across S&P 500, Bitcoin, and XRP are all flashing 🔴 right now. Here's what I'm seeing in real-time:
📈 S&P 500 Futures – 6,351 Is Everything
The 6,351 level marks the midpoint of the rising channel.
On Friday, I flagged 6,430 as critical resistance — price rejected perfectly.
Now we’re attempting a rebound, but we’re stuck at mid-channel.
⚠️ A confirmed breakout above 6,351 could reignite upside momentum.
👉 Yes, this is a 1-minute chart, but precision matters when watching key structural levels — especially in legacy indices.
💥 BTC – 115,700: The Grandmaster Level
Zoom out and see the massive yellow horizontal on the chart: 115,700.
It’s not just any number — this is the ultimate resistance-turned-support battleground.
We’re currently under it, which keeps pressure to the downside.
A reclaim flips the structure bullish and opens room for trend continuation.
📌 Until we’re above it, this remains the dominant resistance across the entire crypto macro framework.
🧩 XRP – Still Facing Rejection
On the 2H/3H chart, XRP continues to flirt with resistance but fails to confirm strength.
This aligns with both the S&P 500 stalling at 6,351 and Bitcoin being capped at 115.7K.
📉 When multiple assets respect key levels in sync, it signals market-wide hesitation.
🔄 Cross-Market Confluence
It’s fascinating to watch:
A TradFi index (S&P)
A macro crypto asset (BTC)
A mid-tier alt (XRP)
...all pivoting around hyper-precise structural resistance at the same time.
✅ These aren’t coincidences. They’re systemic correlations.
🔮 What’s Next?
If S&P 500 breaks above 6,351, it could act as a risk-on signal.
That momentum could help BTC flip 115,700 — a massive deal.
And if that happens, XRP could finally follow with a stronger move.
Until then? We respect resistance and wait for confirmation. 📊🔍
One Love,
The FXPROFESSOR 💙
Disclosure: I am happy to be part of the Trade Nation's Influencer program and receive a monthly fee for using their TradingView charts in my analysis. Awesome broker, where the trader really comes first! 🌟🤝📈

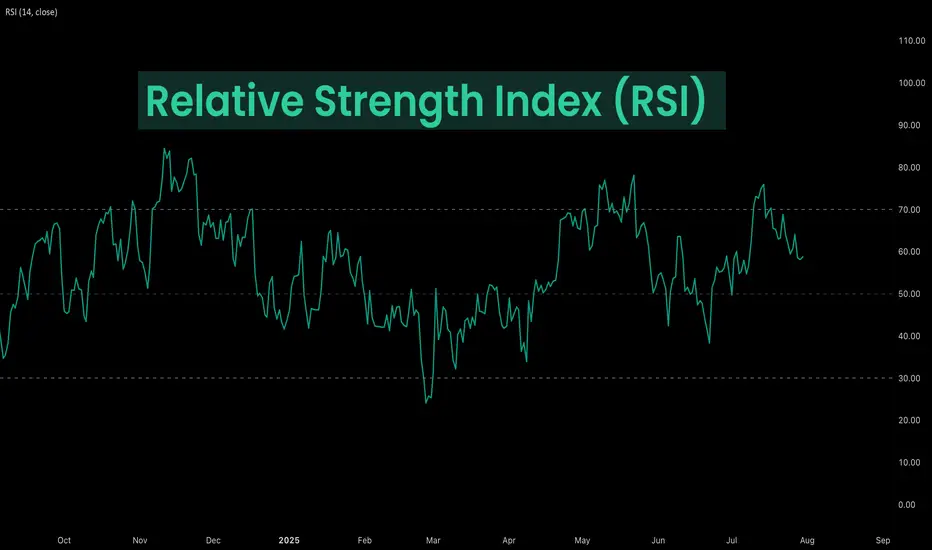
Deep Dive Into Relative Strength Index (RSI)The Relative Strength Index (RSI) is a momentum oscillator developed by J. Welles Wilder Jr. that measures the speed and magnitude of price changes.
Introduction
In the world of trading, timing is everything — and few indicators have stood the test of time like the Relative Strength Index (RSI). Introduced by J. Welles Wilder in 1978, the RSI is a momentum oscillator that helps traders evaluate the strength and speed of price movements. Whether you're trading stocks, forex, or crypto, understanding how RSI is calculated and how to interpret its signals can give you a critical edge.
In this article, we’ll break down exactly how the RSI works, explore its formula, and dive into practical ways you can incorporate it into your trading strategies. From spotting potential reversals to identifying overbought and oversold conditions, the RSI remains a cornerstone of technical analysis — but only if you know how to use it properly.
Let’s explore the mechanics and the mindset behind this powerful indicator.
What Is RSI and How Is It Calculated?
The Relative Strength Index (RSI) is a momentum oscillator that measures the speed and change of price movements over a defined period. It outputs a value between 0 and 100, which helps traders determine whether an asset is overbought or oversold.
The default RSI setting uses a 14-period lookback window and is calculated with the following steps:
🔷Calculate the average gain and loss over the last 14 periods:
Average Gain = Sum of all gains over the past 14 periods / 14
Average Loss = Sum of all losses over the past 14 periods / 14
🔷Compute the Relative Strength (RS):
RS = Average Gain / Average Loss
🔷Apply the RSI formula:
RSI=100−(100/(1+RS))
The result is a single number between 0 and 100 that indicates the asset's momentum.
How to Use RSI in Trading Strategies
⚡️Overbought and Oversold Conditions Strategy
RSI > 70 typically signals that an asset may be overbought and due for a pullback.
RSI < 30 suggests the asset might be oversold, potentially primed for a bounce.
However, these levels aren’t absolute sell or buy signals. In strong trends, RSI can stay overbought or oversold for extended periods.
📈Long Trading Strategy Example:
1. Identify the major trend, to find the long trades it shall be uptrend. On the screen below you can see 1D time frame for BITMART:BTCUSDT.P .
2. Move to lower time frame (in our case 4h) and find the moment when RSI falls below 30. This is our oversold condition and we are going to look for long trade.
3. Find the local support zone and open long trade.
4. Take profit when price reaches resistance level next to the previous swing high
5. Don’t forget to put initial stop loss when enter position. The best stop loss which will give you 3:1 risk to reward ratio.
📉Short Trading Strategy Example
1. Identify the major trend, to find the short trades it shall be downtrend. On the screen below you can see 1D time frame for BITMART:ETHUSDT.P .
2. Move to lower time frame (in our case 4h) and find the moment when RSI grows above 70. This is our overbought condition and we are going to look for short trade.
3. Find the local resistance zone and open short trade.
4. Take profit when price reaches support level next to the previous swing low
5. Don’t forget to put initial stop loss when enter position. The best stop loss which will give you 3:1 risk to reward ratio.
⚡️RSI Breakout Strategy
RSI is breaking through 60 indicating bullish momentum shift if the long-term trend is bullish can be the potential long signal
RSI is breaking down 40 indicating bearish momentum shift if the long-term trend is bearish can be the potential short signal
This strategy works great only on the trending market, don’t use it on the range bounded market to avoid whiplashes.
📈Long trading strategy example:
1. Make sure that long-term trend is bullish. Use 200 period EMA as its approximation. If price remains above it we can look for potential long trade setup.
2. If RSI crossed above the level 60 open long trade.
3. Put the initial stop-loss under the signal candle’s low.
4. Take profit when price reached 3:1 risk-to-reward ratio.
📉Short trading strategy example
1. Make sure that long-term trend is bearish. Use 200 period EMA as it’s approximation. If price remains below it we can look for potential short trade setup.
2. If RSI crossed below the level 40 open short trade.
3. Put the initial stop-loss above the signal candle’s high.
4. Take profit when price reached 3:1 risk-to-reward ratio. In our case we received very fast and profitable trade
⚡️RSI Divergence Strategy
RSI can be used also as a trend reversal indicator if we are looking for divergences. This is very reliable sign of current trend weakness and great opportunity open trade against the trend. Usually it’s not recommended, but in case if divergence can be applicable.
Bullish divergence is the situation when price created the lower low, while RSI made the lower low. Usually, it indicates that current downtrend is weakening and we can look for long trades
Bearish divergence is the situation when price created the higher high, while RSI made the lower high. Usually, it indicates that current uptrend is weakening and we can look for short trades
😎Important hint: it’s rarely covered in textbooks about technical analysis, but in our opinion it’s better to used divergences when RSI was able to cross level 50 between two lows/highs.
📈Long trading strategy example
1. Find at the chart situation, when the price made the lower low
2. At the same time RSI shall set the higher low
3. RSI shall break level 50 between these lows indicating shift to the bullish momentum
4. If price failed to set the clean breakdown open long trade on the candle which set the lower low. Put stop loss under it’s low
5. Take profit at 3:1 RR. When you master this concept, you will be able to have much more RR trades, even 10:1. This is possible because when trend finish you have the highest potential upside
📉Short trading strategy example
1. Find at the chart situation, when the price made the higher high
2. At the same time RSI shall set the lower high
3. RSI shall break level 50 between these highs indicating shift to the bearish momentum
4. If price failed to set the clean breakout open short trade on the candle which set the higher high. Put stop loss above it’s high
5. Take profit at 3:1 RR. When you master this concept, you will be able to have much more RR trades, even 10:1. This is possible because when trend finish you have the highest potential upside
Conclusion
The Relative Strength Index (RSI) remains one of the most powerful and flexible tools in a trader’s technical arsenal — but its real value lies in how you use it.
We’ve explored three key RSI strategies:
✅ Overbought/Oversold setups offer simple entry signals in ranging markets, where price tends to revert to the mean.
✅ Breakout strategies unlock RSI’s momentum-tracking potential, helping you ride strong directional moves with confidence.
✅ Divergence detection reveals hidden shifts in market sentiment, giving you an early warning of possible reversals or trend continuations.
Each approach has its strengths — and its risks — but together, they offer a complete framework for using RSI across different market conditions
🔑 Key Takeaways:
RSI is not just a “buy low, sell high” tool — it’s a multi-dimensional indicator that adapts to trends, momentum, and market structure.
The best RSI signals come from confluence: combining RSI with price action, support/resistance, volume, or trend filters like moving averages.
Patience and discipline are essential — RSI signals are only effective when paired with proper risk management and confirmation.
By mastering RSI beyond the basics, you'll be better equipped to make timely, confident, and informed trading decisions — whether you're entering a pullback, chasing a breakout, or spotting the early signs of reversal.
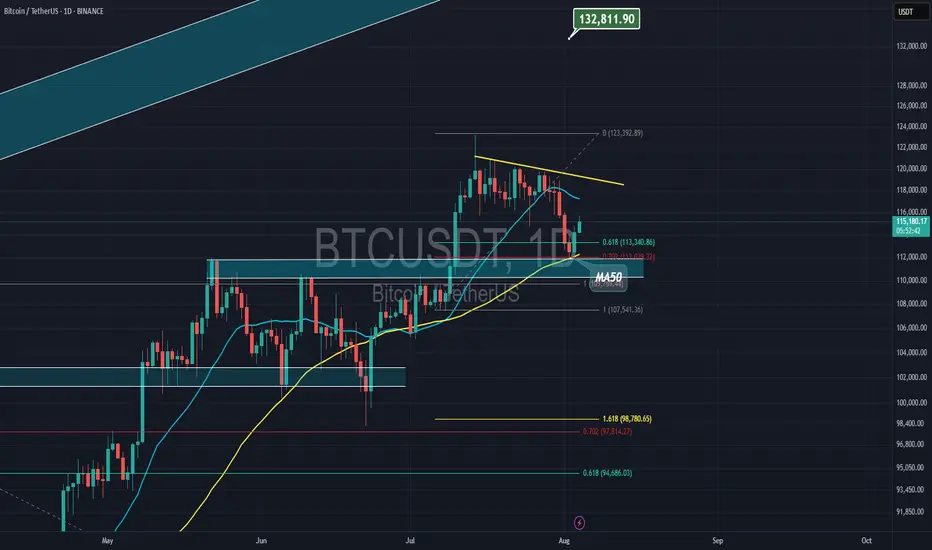
Bitcoin & strong supportBitcoin is holding above 50MA and 61% of Fibonacci, it also has bullish divergence on RSI with bullish engulfing candle. upside movement is coming soon
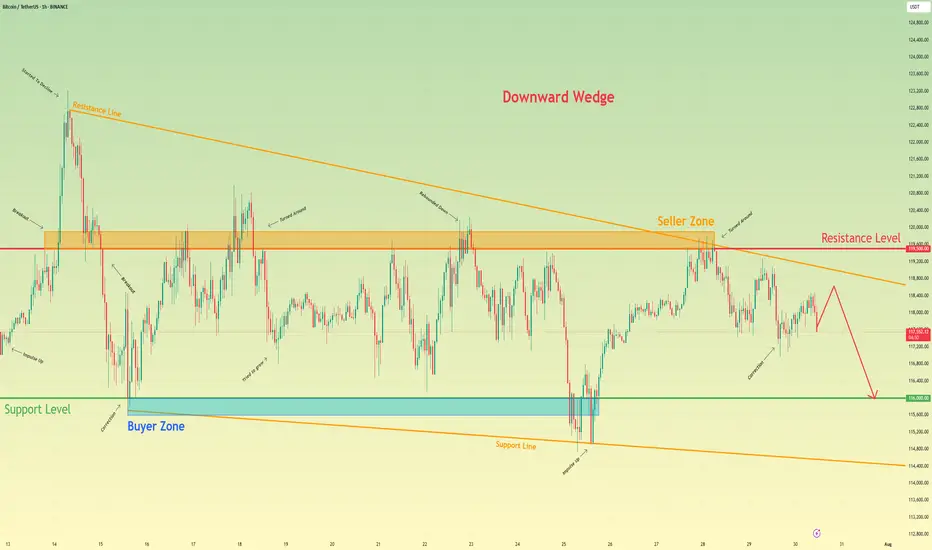
Bitcoin will continue to decline to support levelHello traders, I want share with you my opinion about Bitcoin. Following a period of a broad downward trend, bitcoin's price action has been channeled into a large downward wedge, a pattern that signifies converging volatility and a period of consolidation before an eventual decisive move. This market action is taking place between two critical, well-established zones: a major seller zone capping rallies around the 119500 resistance level and a significant buyer zone providing support near 116000. Recently, an upward rebound attempted to test the upper boundary of this wedge but was met with strong selling pressure from the seller zone, confirming its validity as a formidable barrier. The price is now correcting downwards after this rejection. The primary working hypothesis is a short scenario, anticipating that the bearish momentum from this recent failure will continue to drive the price lower. While a minor bounce or retest of local resistance is possible, the path of least resistance within the pattern's structure is now towards its lower boundary. Therefore, the TP is strategically set at the 116000 level. Please share this idea with your friends and click Boost 🚀
Disclaimer: As part of ThinkMarkets’ Influencer Program, I am sponsored to share and publish their charts in my analysis.