8 Aug — BTCUSDT.PI usually (haha) trade on the basis of what is market doing right now and what is it likely to do next. Right now it looks like reaching for at least the BSL marked. In any case, as traders, we are trading probabilities, so let’s see.
BTCUST.P trade ideas

BTC-A weak bull flag is forming A weak bull flag is forming on the 15 M — but momentum is stalling.
📈 Breakout Confirmation: Close above $116,500
📉 Invalidation: Close below $116,100
🧪 RSI is fading, struggling to regain strength. Wait for confirmation
Stay Sharp. Eliminate the Noise.

BTC - 1H Elliott Wave Analysis - 07.08.25Greetings and welcome back to another Bitcoin Elliott Wave Analysis!
This Analysis is a bit more complex due to recent price action.
The probabilities of the impulsive structure we discussed last time decrease as the price touched the 0.618 FIB at 114'209 USD of our supposed to be Wave 4 support area which is a warning sign.
It invalidated the impulse we looked into last time. That doesn't mean we turn bearish yet. We are still looking for higher prices to come!
We got two impulsive scenarios.
The first is that we still follow the green count just that it now is a leading diagonal which means every Wave is a three wave move as ABC. For our green Wave 3 in which we currently are this would be the yellow ABC which could be finished but preferably we get another high to hit the 1 to 1 FIB target at 117'303 USD before finishing the green Wave 3 and starting the green Wave 4.
Condition for this count is that we don't move below the last low at 155'555 USD which would shift probabilities to the other cases as the pullback would be too deep.
The other possibility is that we get a reset of the green Wave 2 meaning that the recent move up we saw from the 5th August low is part of the green Wave 2 correction. In this case the move up would be an overshooting Wave B displayed as part of the pink ABC here. Unlike the other count we would prefer to start the move down in pink Wave C now as it would look better.
This doesn't meant that we can't get another high in this count too.
We want to make aware that in this kind of correction which is called expanded flat it is common for Wave C to either undershoot or overshoot Wave A. This means that usually we could get a shallow Wave C to around +- 115'000 USD or a long C Wave.
The overshooting C Wave isn't possible here as it would go beyond the Wave 2 support area and invalidate the count unless we get another high first.
Sadly we can't really calculate the C targets yet due missing price action but we wanted to make you aware of the possibility of it being shallow. :)
Thanks for reading.
We would appreciate if you boost the idea if you enjoyed it as we put extra work into this one. :D
NO FINANCIAL ADVICE.

BTC Daily (August 7, 2025)Structure Detected
Ascending Parallel Channel
Bitcoin has been consistently respecting a broad ascending parallel channel (yellow lines) with three clean touches on both upper and lower bounds. The price is currently sitting near the midline of this channel — historically a pivot zone between continuation and pullbacks.
Trend: Strong uptrend with a clear sequence of higher highs and higher lows. Recent pullbacks have all respected the mid-channel and rallied afterward.
Heikin Ashi candles are used, which smooth price action — this makes trend strength visually clearer. A few red candles suggest temporary cooling, but not a structural breakdown.
Market Bias
Bullish — The macro structure remains strong, and price is riding the midline of a clean, long-term ascending channel. No signs of major distribution or topping yet.
If price maintains above the midline (~$115k), upside continuation is favored. A break and close below it could trigger a mid-term pullback to lower channel bounds.
Bullish Targets
If price continues upward from here:
$130,000 → Next horizontal confluence within the channel top zone.
$140,000–$150,000 → Upper channel resistance; could attract long-term profit-taking or final parabolic push.
$170,000 → Extreme target near the top extension of the outer parallel — would imply mania phase or major breakout extension.
Bearish Levels
If midline fails and Bitcoin pulls back:
$100,000–$105,000 → Prior support and lower mid-channel zone.
$90,000 → Bottom channel support — clean historical touchpoints.
$85,000–$80,000 → Strong psychological + structural support cluster; high-confidence long-term demand zone.
Timeframe-Based Targets
Daily Swing Targets
Upside: $130k → $140k → $150k
Downside: $105k → $90k → $80k
Weekly Structure: The weekly mirrors this bullish channel. As long as weekly candles close above ~$100k, the long-term trend is intact.
Summary:
Bitcoin remains in a well-respected bullish channel, currently riding the midline — a typical pivot zone. Holding this zone supports further upside toward $130k+. A breakdown below ~$115k could trigger a deeper pullback toward $100k–$90k support. Macro trend remains bullish unless the lower channel breaks.

Bitcoin to the moonBINANCE:BTCUSDT All signs point to Bitcoin going all the way up and doing so aggressively.
Are you ready for the party?

BTCUSDT: The Fuse is Lit | Wedge breakout LoadingThis chart is screaming breakout.
BTC has been coiling inside this falling wedge for weeks and every dip into the demand zone near 110K–112K has been aggressively defended (check those green arrows). Now? Price is pressing hard against wedge resistance right at the top.
This is compression before expansion.
⚡What I'm Watching:
Bullish structure forming: higher lows ✔️
Price reclaiming key levels ✔️
Major breakout zone at 115,800–116,000 coming into play
Break and retest = rocket fuel to 122K and beyond
🎯 My Bullish Targets:
TP1: 122,000 (magnet level)
TP2: 128,328 (next HTF target)
🚨 Invalidation:
A clean break below 112K? I step aside. Until then bullish bias stays on.

#BTC/USDT Breakout needed #BTC
The price is moving within an ascending channel on the 1-hour frame, adhering well to it, and is on track to break it strongly upwards and retest it.
We have support from the lower boundary of the ascending channel, at 114200.
We have a downtrend on the RSI indicator that is about to break and retest, supporting the upside.
There is a major support area in green at 114000, which represents a strong basis for the upside.
Don't forget a simple thing: ease and capital.
When you reach the first target, save some money and then change your stop-loss order to an entry order.
For inquiries, please leave a comment.
We have a trend to hold above the 100 Moving Average.
Entry price: 114700.
First target: 115106.
Second target: 115537.
Third target: 116130.
Don't forget a simple thing: ease and capital.
When you reach the first target, save some money and then change your stop-loss order to an entry order.
For inquiries, please leave a comment.
Thank you.

BTC 4H – Retesting Trendline Support, Will Supply Reject Again?Bitcoin is retesting a clean 4H ascending trendline after forming a local higher low — with Stoch RSI starting to turn upward from the bottom. This trendline has acted as reliable support since early July.
If price continues to hold and flip the mid-range ($116K), the next major test comes at the overhead supply zone ($119K–$121K), where price was previously rejected multiple times.
Key levels to watch:
– Trendline support (currently holding)
– Mid-range reclaim (~116K)
– Supply zone rejection or breakout (119K–121K)
– Stoch RSI bounce = potential early signal
Bullish continuation hinges on strength through supply — otherwise, this may form another lower high. Watching for confirmation from price action + momentum.

BEATRONXbtronx is the best btonx i hope she paldos oh my god i am jusy filling up thr word limit that it is requiring before i can publish ehheehe

BTCUSDT: Touch 124000$Hello everyone we see the second wave of 5th wave and start to uptrend and touch the 124k price. Good luck.

BTC(20250806) market analysis and operationAugust 6th BTC Contract Technical Analysis:
Today, the large-scale daily chart closed with a small bullish candlestick pattern, with consecutive bullish candlesticks. However, the price remains consolidating at a high level, with no signs of an upward breakout. The accompanying indicator forms a death cross. Therefore, based on the current trend, the price is still within the range, with rising and falling prices unlikely to continue or break out of the range. Therefore, trading should be considered within the range. The short-term hourly chart showed yesterday's intraday gains, followed by pressure and declines in the European session, with the US session continuing its correction. Prices rebounded after finding support in the Asian morning. The current candlestick pattern shows consecutive bullish candlesticks, with the accompanying indicator forming a golden cross. Therefore, an intraday rise is highly likely, but the overall trend is stuck in a range-bound market, so a one-sided trend should not be considered.
Today's BTC Short-Term Contract Trading Strategy:
Buy on a pullback to the 113,700 area, with a stop-loss at 113,200 and a target of 115,000. Sell on a touchdown to the 115,200 area, with a stop-loss at 115,700 and a target of 114,000. Focus on the short-term range.


BTC - 1H Elliott Wave Analysis - 05.08.25Greetings, this is an update of our Elliott Wave Count for Bitcoin.
Today we are going to look at the bullish and bearish scenarios so everybody is well prepared for the upcoming price action.
We have seen a pullback since yesterday's update.
The pullback entered and is currently in our Wave 2 support area which is between the 0.5 FIB at 113'640 USD and the 0.786 FIB at 112'616 USD. The bulls would like to see a bounce now in green Wave 3 of which the targets are the 1 to 1 FIB at 116'418 USD, the 1.382 FIB at 117'883 USD and the 1.618 FIB at 118'789 USD which is also the optimal target for a Wave 3.
Due not invalidating the red Wave 4 we could form the red Wave 5.
Be aware that on the lower timeframes we did touch the 0.886 FIB of a smaller Wave 2 support area which does indicate weakness and usually is followed by another low. If we touch the 0.886 FIB of the Wave 2 support area at 112'287 USD it is also an invalidation of the green bullish count.
Red Wave 5 targets are the 1 to 1 FIB at 111'573 USD which is additionally right below the last low and the last all time high which could function as further support. Further targets would be the 1.382 FIB at 109'997 USD and the 1.618 FIB at 109'024 USD as well as another 1.618 FIB at 109'479 USD.
Be aware that the bigger Wave 2 support area goes down to 103'000 USD.
We think another low is more probable meaning the red count has the higher probability.
Yet we think the green count is a good opportunity as we have a clear set up and invalidation point.
Thanks for reading.
We would appreciate a follow and boost if you like the analysis! :)
NO FINANCIAL ADVICE.

btc usd short term down 50 to 70 pips btc usd short term down 50 to 70 pips
fell free contrect me if you have any question

BTC - trend lines and liquidity zonesHere is a summary of what I'm looking at:
Price currently struggling to surpass the Weekly low @ 115,650 (Blue line)
The green line is acting as resistance, with a brief break-through mid-July.
Huge liquidity zone 120-121.5K which will be inevitably grabbed (Yellow box)
Liquidity sitting below @ 111K (Yellow box)
0.5 fib currently at @ 110K (which also acted as the Weekly high in Jan 25)
A descending channel formation
Analysis:
I believe that Bitcoin with visit the 110K - 111.5K zone which also coincide with the bottom of the channel, the Weekly high @ 110K and 0.5 fib (ish) and grab what liquidity is currently sat below.
Once done, move up to the higher liquidity zone, which would break once again above the Green line which would hopefully flip into support, and send BTC parabolic with a peak Nov-Dec.

Robert Kiyosaki said WHAT about BTC?According to Cointelegraph Robert Kiyosaki welcomes a BTC dip below $90K... We talked about it before even BTC broke ATH (check related publications), what do you think?
#crypto #cryptomarket #bitcoin #btc #trading #analysis

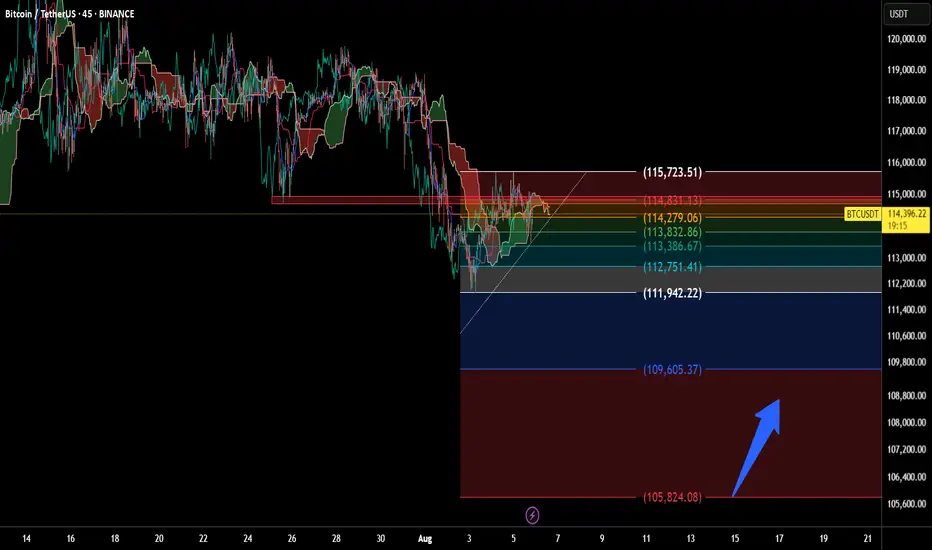
Will BTC Hold the Line? Support Levels TestedBitcoin is currently trading at 114,420 USDT on the 45-minute timeframe. This setup highlights a structured technical analysis using Ichimoku Cloud, Fibonacci retracement, and clearly defined support/resistance levels.
Key price zones:
- Resistance: 115,723.51 / 114,831.13
- Mid-range: 114,279.06 / 113,832.86
- Support: 113,386.67 down to 109,605.37
A downward arrow suggests a potential revisit to lower support zones, possibly around 105,824.08 USDT, indicating a watchlist area for accumulation or bounce confirmation.
💬 “Monitoring BTC’s reaction around key Fibonacci levels. Potential support zone in sight.”
BTC/USDT Analysis – Reached Resistance
Hello everyone! This is the daily analysis from the CryptoRobotics trading analyst.
Yesterday, Bitcoin reached the resistance zone at $115,000–$116,300 (a mirror volume zone), and we are already seeing a reaction from sellers.
Our primary expectations remain unchanged since yesterday — we anticipate a move back down toward the local low. If there’s no reaction at that level, we could see a further decline toward the next support zone at $110,000–$107,000 (accumulated volume). A shift to a bullish scenario is only possible if strong market buying appears, which would be reflected in a sharp spike in volume and upward positioning.
Buy Zones:
$110,000–$107,000 (accumulated volume)
Sell Zones:
$115,000–$116,300 (mirror volume zone)
$117,600–$118,600 (accumulated volume)
This publication is not financial advice.

BTCUSDT - UniverseMetta - Signal#BTCUSDT - UniverseMetta - Signal
H4 - Formation of the 3rd wave from the lower border of the channel. Stop behind the minimum of the 1st wave.
Entry: 115776.79
TP: 120784.05 - 125355.20 - 130353.86 - 134629.03
Stop: 111641.76

127000 USD on BTC? Analysis of the Bitcoin (BTC/USD) chart on the TradingView platform reveals several key observations. The current price is hovering around $114,249.14, suggesting a short-term decline following a previous significant rise, evident as a high peak on the chart. The two moving average lines—green (shorter period) and red (longer period)—indicate an upward trend, as the green line is above the red, signaling bullish strength in the broader perspective. However, recent red candles point to selling pressure, with the price approaching a support zone around $113,000–$114,000, which could serve as an area of consolidation or a potential rebound.
In the lower part of the chart, the oscillator (e.g., RSI or another momentum indicator) remains in a neutral zone, suggesting no significant overbought conditions but also a lack of strong momentum for further declines. It’s worth noting that the price is currently testing a critical support level, and a break below this could lead to further downside, while a bounce could target higher levels. Based on the current trend and historical price action, a suggested target price of $127,000 USD appears achievable if the support holds and bullish momentum resumes, potentially driven by a breakout above the recent high.
Potential TP: 127 000 $

BTC retracement planDon’t chase breakouts above $115K without confirmation—false signals are common in volatile crypto conditions.
Watch for volume spikes at key levels like $115K or near $117,800 for validation.
Use tight stop-losses given intraday volatility—it’s easy for sharp 1–2% swings in crypto.
Note that technical sentiment (RSI, MACD) remains neutral to slightly bearish across intraday and daily indicators .
Weekly trading plan for BitcoinBINANCE:BTCUSDT Price has shown recovery over the past 24 hours, but now faces a critical test at the weekly reversal level ($115,300). The inability to establish sustained footing above this level may trigger a deeper correction
Key Scenarios:
Bullish: Hold above $108K maintains ATH potential
Bearish: Failure to consolidate above $115.3K opens downside risk to 110k
Let the market confirm its direction first

