Weekly trading plan for BitcoinBINANCE:BTCUSDT Price has shown recovery over the past 24 hours, but now faces a critical test at the weekly reversal level ($115,300). The inability to establish sustained footing above this level may trigger a deeper correction
Key Scenarios:
Bullish: Hold above $108K maintains ATH potential
Bearish: Failure to consolidate above $115.3K opens downside risk to 110k
Let the market confirm its direction first
BTCUST.P trade ideas


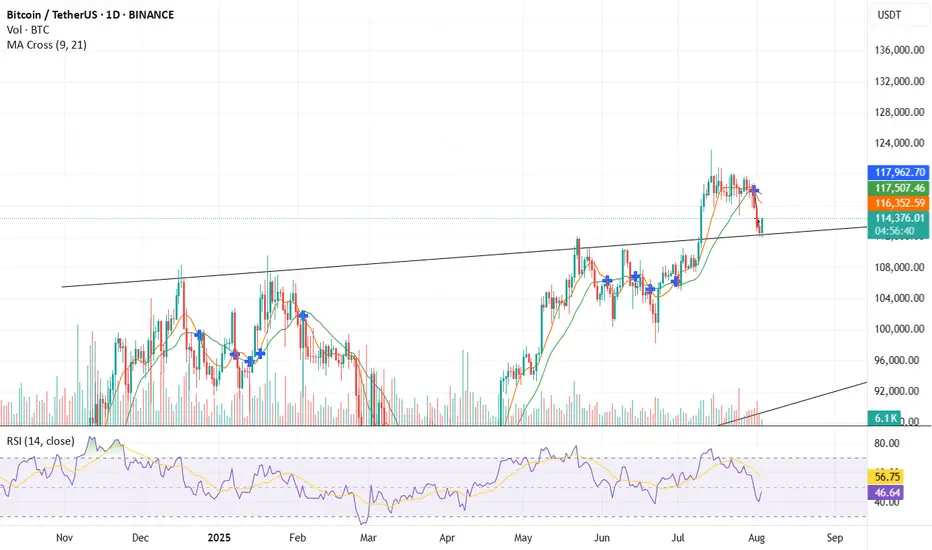
BTCUSDT Expanded Flat Correction may be overBear with me (pun intended). I know I'll probably get some slack from the 5 wave correction counting of wave C. Most people would place the 3rd wave in June instead of May, but a few things suggest me that the 3rd wave down was actually in May:
This C wave lies at the 123.6% extension of wave A which is a common area for the Expanded Flat correction.
Volume and RSI printing a divergence
2M RSI just broke out of its falling wedge
BTCUSDT resiliance at the 19k level, in contrast with the current equity price action & general sentiment, which goes against the previous sell offs of April and June
All of the above considered, there's still something missing : that the C wave should hold RSI divergence between wave 3 and 5 at completion, which did not happen with this counting. Also BTC would not only have be above the 19.3k resistance of the 123.6% extension of wave A (which is being rejected @ the moment) as it would also need to break & retest that yellow trendline (hands tied with the faster EMA's) that is holding its price down. But where is the fun in posting ideas when all of the cards are on the table? =D
All I'm saying is that this correction is closer to its ending than the other way around, and what I'm suggesting is that I wouldn't be surprised if it would be already over.
DYOR. Not advice

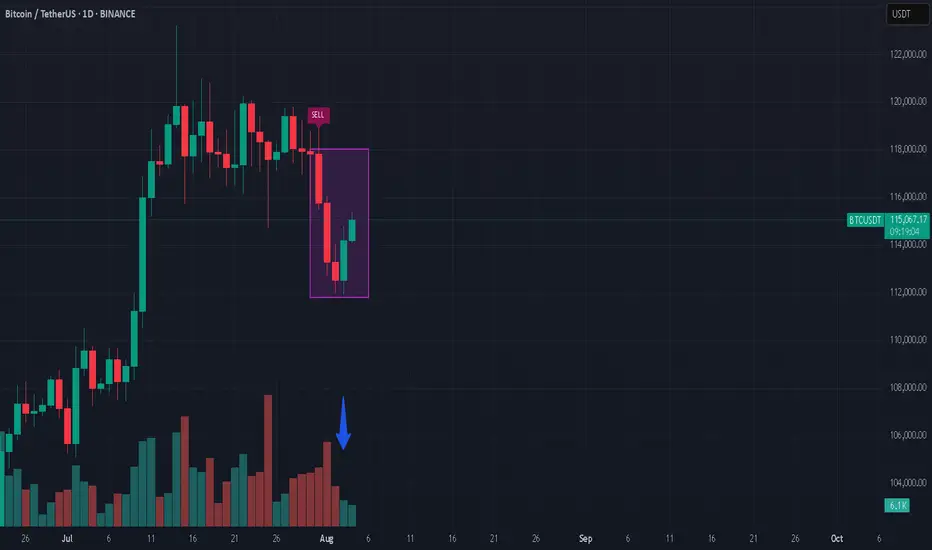
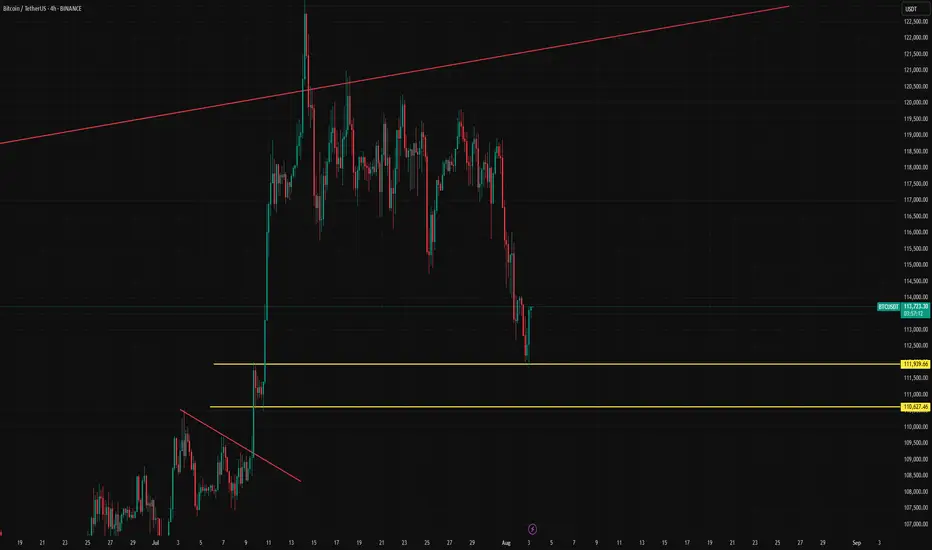
Shorting Bitcoin??Bitcoin had a huge drop, and suddenly shows strength? Well, in my opinion, if you look at the volume, there’s not much strength. I believe it’s going even lower in the short run.
*not investment advice
#bitcoin #crypto #trading
$BINANCE:BTCUSDT Needs a Clean Break Above $117,000The BINANCE:BTCUSDT pair has shown a mild bounce over the past 24 hours, now trading around $114,000. But zoom out, and the weekly performance still shows a nearly 4% dip, raising the question of whether this bounce has real legs or is just noise.
From a long-term holder perspective, on-chain selling pressure has been easing. Data from spent output bands shows that older wallets, particularly those holding BTC for 7–10 years, were active between July 23 and August 1.
However, the extent of selling was notably lower compared to the earlier July 10–19 stretch, when BINANCE:BTCUSDT dropped from $ 123,000 to $ 117,000. Even during this recent distribution phase, BTC managed to hold above $113,000, indicating strong market absorption and reduced overhead pressure.
Valuation-wise, the MVRV (Market Value to Realized Value) ratio currently sits at 2.19. Historically, this zone has acted as a reliable launchpad for Bitcoin rallies. Back in June, a similar reading of 2.16 preceded a move from $101,000 to $110,000. And in April, a 2.12 print led to a surge toward $119000. Right now, BINANCE:BTCUSDT sits in the same zone, supported by a quiet shift in trader sentiment. The long/short ratio flipped from a bearish 0.89 to 1.02, indicating more traders are finally betting on the upside.
From a price action standpoint, BINANCE:BTCUSDT needs to make a decisive move. It is currently holding above the 0.382 Fibonacci retracement level at $113,600. This level is derived from the June low of $ 98,000 to the all-time high of $ 123,000.
The next visible support levels sit at $111,900 and $110,000, while $107,000 remains the invalidation zone for any bullish thesis. However, the true pivot remains $ 117,000; a level marked by historical significance, volume clusters, and failed breakouts. Unless BINANCE:BTCUSDT clears and holds above $117,000, the broader uptrend remains vulnerable to yet another failed rally attempt.

Analytics: Market Outlook and Predictions
📈 WHAT HAPPENED?
Last week, US President Donald Trump once again "shook up" the financial markets.
The report published by the White House was received positively and contributed to the recovery of the Bitcoin price. But soon after, new import duties were introduced, which changed the short-term trend of the first cryptocurrency to a downward one. Unfortunately, no one is immune to FUD.
The local minimum was recorded at $112,000, after which the price rebounded slightly, but didn’t reach the key zone of $110,000-$107,000 (accumulated volumes).
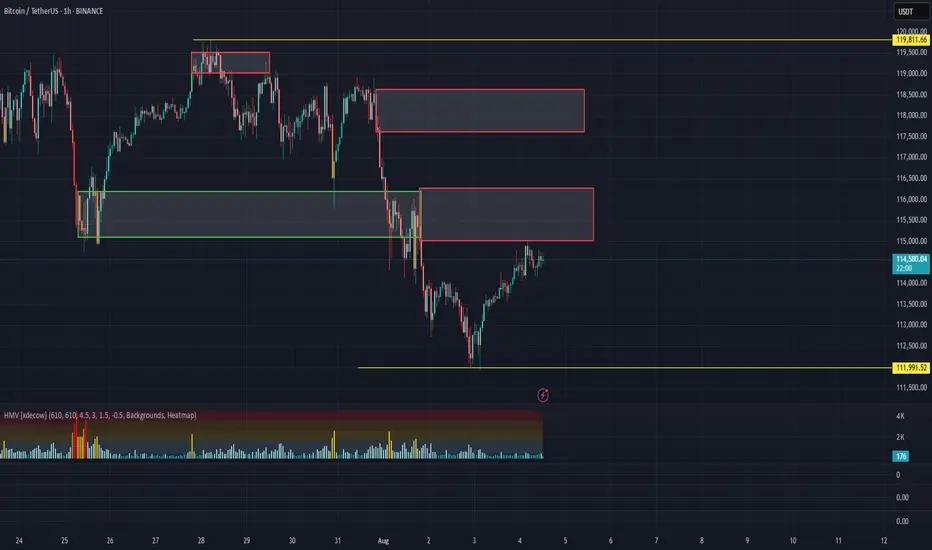
💼 WHAT WILL HAPPEN: OR NOT?
Currently, buyer activity remains weak, with significant volumes concentrated above the current price, and no active demand at the local lows. Another wave of sales is likely from the $115,000-$116,300 zone to the formed low of $112,000.
On the other hand, wave analysis shows the weakening of sellers. The market has already absorbed the last wave of sales, and there was a break on the hourly timeframe. With the growth of buying volumes, a rebound to the nearest volume resistance is possible. However, we’ll most likely not be able to do without strong sales, and we’re highly likely to see Bitcoin at $110,000.
Buy Zones:
$110,000–$107,000 (accumulated volume)
Sell Zones:
$117,600–$118,600 (accumulated volume)
$115,000–$116,300 (mirror volume zone)
📰 IMPORTANT DATES
Macroeconomic events that we’re following this week:
• Tuesday, August 5, 13:45 (UTC) — publication of the business activity index (PMI) in the US services sector for July;
• Tuesday, August 5, 14:00 (UTC) — publication of the US Non-Manufacturing Purchasing Managers' Index (ISM) for July;
• Thursday, August 7, 11:00 (UTC) — announcement of the UK interest rate decision for August;
• August 7, Thursday, 11:30 (UTC) — publication of the Bank of England's letter on UK inflation;
• August 7, Thursday, 12:30 (UTC) — publication of the number of initial jobless claims in the United States for August.
*This post is not a financial recommendation. Make decisions based on your own experience.
#analytics
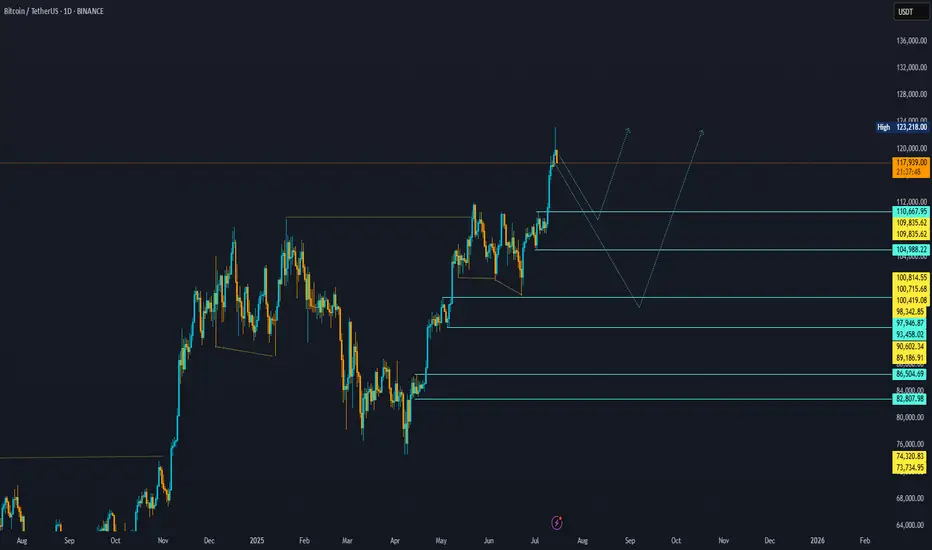
BTC Potential Bullish continuation to a new ATH BTC Looking Bullish after the Pull back .we anticipating a bullish continuation from 114.600 to the high 122k and above. If you trade risk management is a must so you don't get caught up in the volatility of the crypto Market. #Btcusd

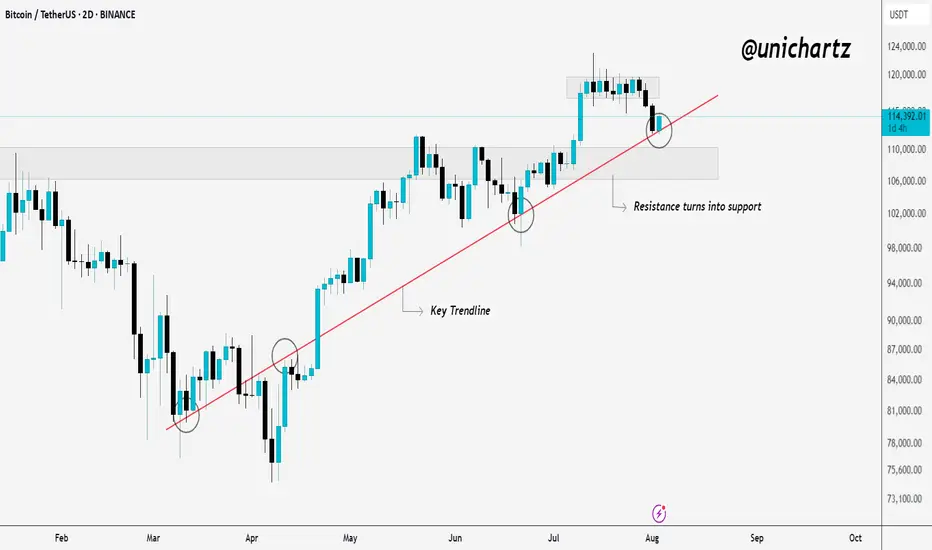
Smart Money Watching This Line — Are You?Bitcoin is holding strong above a key trendline that has acted as dynamic support since March. Every time price touched this line, buyers stepped in, and once again, it’s doing its job.
What was once resistance has now flipped into solid support. The recent pullback seems healthy, and the price is trying to bounce from the trendline area again.
As long as CRYPTOCAP:BTC respects this structure, the bullish momentum remains intact. If it holds, we could see another leg up from here.
DYOR, NFA
Thanks for reading!
My bullish view on BTCIf we break upwards in this channel we will see 134k and/or 140k depending on the resistance on the trend lines!


Is it time to buy BITCOIN now?My previous analysis of reaching $112,000 was correct and now Bitcoin is around $113,000. Is it time to buy now? The answer is no because the price has not yet stabilized and other news may push the price below 112,000. Also, the NEW RSI indicator has not yet crossed its moving average.

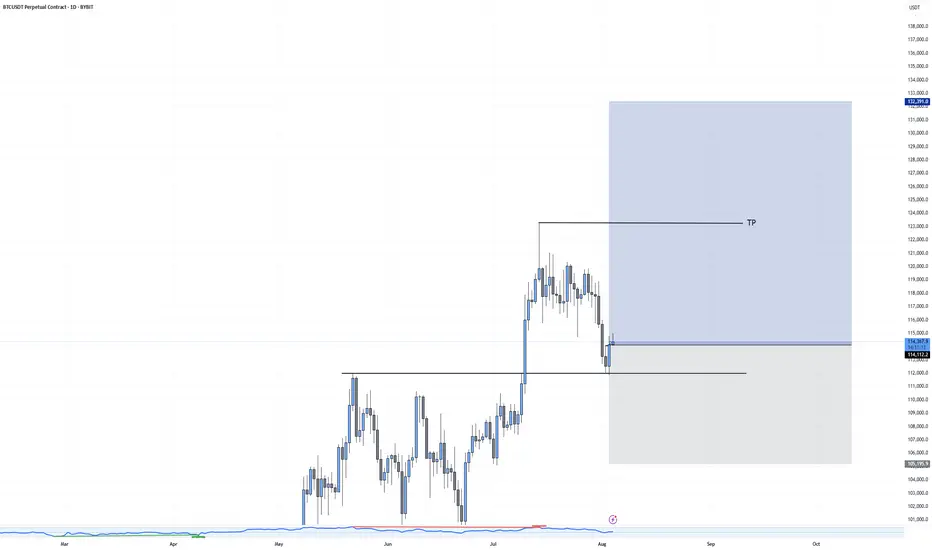
BTC ShortAiming for some downside liquidity currently .
First take profit - 0.62 fib
Second take profit - 1 fib

BTC -MACD Triggered the Breakout Early, MACD MasteryYou didn’t need 20 indicators. Just one system that actually worked.
The MACD Liquidity Tracker Strategy flipped long on BTC just before the latest 4H breakout — catching an 11.39% move with perfect histogram and EMA alignment.
🔍 Here’s what happened:
– Histogram flipped positive on July 23
– EMA filter cleared — clean long trigger
– Histogram rose into a momentum peak
– Strategy closed just before consolidation
This is exactly what the Liquidity Tracker was built for:
✅ Spot clean trend shifts
✅ Confirm strength via momentum
✅ Filter out noise using EMAs
⚙️ Settings Used:
– MACD: 25 Fast / 60 Slow / 220 Signal
– EMA Filter: 50 / 9 / 3
– Entry Mode: Histogram + Crossover Combo

BTC Price Prediction and Elliott Wave AnalysisHello friends,
>> Thank you for joining me in my analysis. We finished the pink Y wave as wxy in purple counting. Now we are moving into creating a confirmation for starting the Big Yellow C wave.
>> our confirmations:
* 4Hr TF: I need to close above the 113420 level.
* 1D TF: I will prefer to close below 113297 and above its opening 112550, and the next double days break today's high.
Keep liking and supporting me to continue. See you soon!
Thanks, Bros

BTC AccumulationI'm excited to see how this develops. Might be the first proper accumulation since april at the lows.

BTC/USDTWell, well, well, I see that Bitcoin has hit its main support. Those who bought and made profits can slowly exit.
BTC Retests Broken Channel as Daily Support Holds📉 On the 4H chart, CRYPTOCAP:BTC has broken below its descending channel and is now testing the underside — a classic retest zone where bulls and bears collide 👀
📆 Meanwhile, the Daily timeframe shows price still holding above the key 11800 support level 🛡️
This zone remains pivotal — a bounce could reclaim momentum, while a failure might trigger deeper downside.
The next few candles will be critical for directional clarity.
Are we about to reclaim the structure or head lower from here?
Not financial advice.

mBos 15mWe came to 4h OB, swiped some liquidity and received a reaction. Expectations for the price to return back to the wick and continue up to take the liquidity there. As there is no break on the HTF, it is a trade with higher risk.
Entry on the test of 15m wick. Stop below wick. Take on the swim of EQH

BTC LONGAfter major pullback Bitcoin takes Support. Our Algo-based Indicators also showing their first BUY-Signal with Alert.

BTC next bull run after taking restAs is clear, BTC has made a new high, and we should wait for the next bullish entry after a retracement.
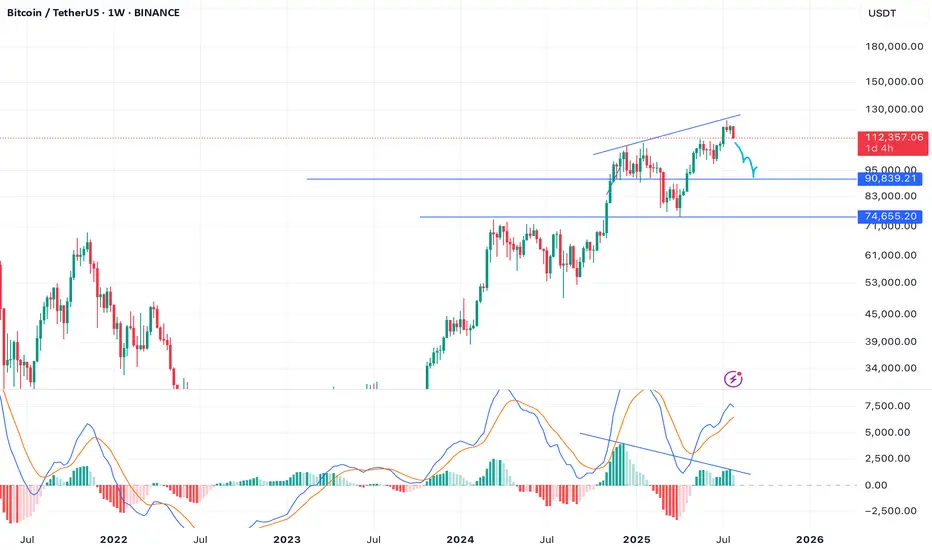
From Euphoria to Exhaustion – BTC's Next Move?BTC Idea – Bearish Divergence + Key Level Watch ⚠️
Summary / Bias:
BTC has tapped 120K and is now showing early signs of weakness. A bearish divergence on the MACD Histogram (weekly) is flashing caution, while price has retraced back to the critical 112K zone. I'm leaning bearish short-term, expecting a move towards 100K, and possibly as low as 93K, if key confirmations unfold.
Technical Context:
Weekly MACD Histogram shows a clear bearish divergence, signaling potential exhaustion.
BTC rejected from 120K and has pulled back to 112K.
Price crossed below the Yearly Camarilla L#, but we need a weekly close below to confirm further downside.
112K remains the key pivot – failure to bounce strongly here could open the door for deeper retracement.
Scenarios to Watch:
🟥 Bearish Continuation (Primary Bias)
Breakdown and close below 112K
Downside targets:
TP1: 100K
TP2: 93K
🟨 Neutralizing Risk
Hold above 112K with strong bounce = neutral bias, reassess
Close back above 115K+ with strength = invalidate bearish lean
Caution & Patience:
Now is not the time for aggressive longs. Signs of exhaustion + major level retest call for defensive positioning and high-quality setups only. Let confirmation guide entries.
NFA. Risk management always.
Will update if structure shifts.