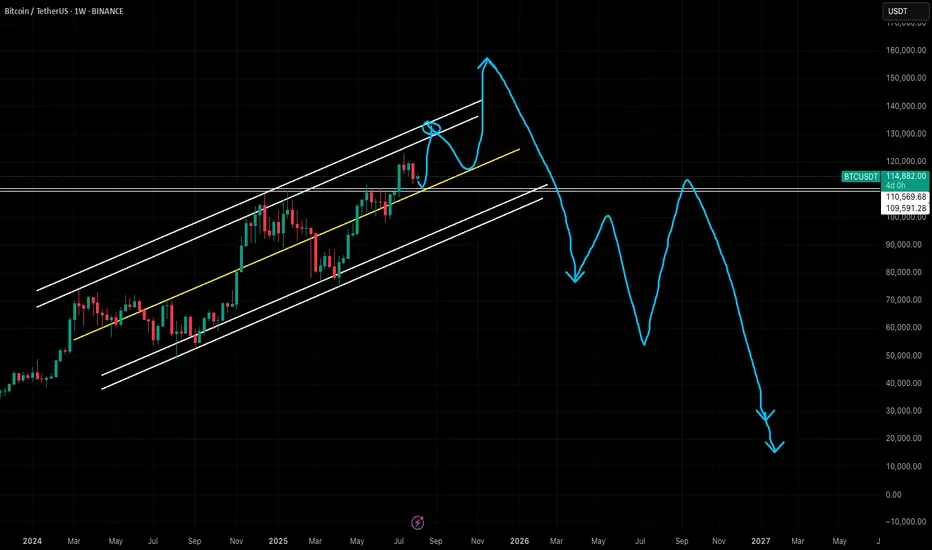
on weekly chart btcusdt long term shortAccording to the weekly chart it would say that btc is near or at the peak and in the next few weeks or months it will start to fall.
As can be seen on the chart, if btc continues to follow the time interval of 202 bars and the fractal structure of the previous period, the next decline should last longer than a year. The lines of resistance in that case would be:
1. green line or about 90k
2. orange line or about 55k
3. red line or about 15k
Disclaimer: This is not financial, investment, trade or other advice. This is my personal opinion which can very easily be wrong.
You trade at your own risk.
BTCUST.P trade ideas

Long_BTC, TF: 4Hthis Long position gets in when condition have fallen in places.
first it has almost the all time high, but it got bounced back to retest to strong demand zone.
Also, it has been retest the important 4H trend line.
*** Risk consideration ***
Risk per Reward is about 2x
SL 1000 points TP 2500 points
if hit first TP then just tailing stop less as you wish.

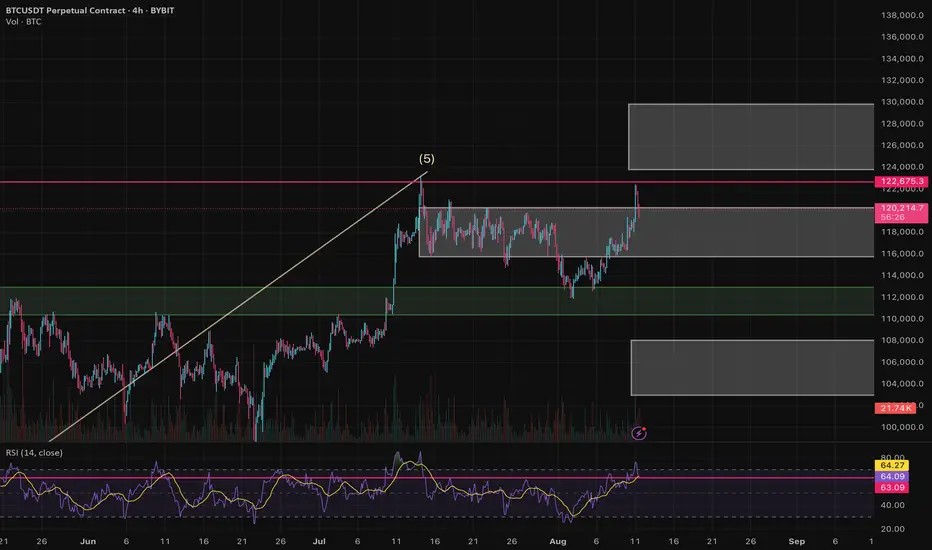
BTCUSDT-local correction is expectedExpecting local correction on BTC, as the price didn't manage to fix above 123000. Main target is around 103-105. In case of the deeper correction - next targets are mentioned on chart.
Invalidation will occur when price will fix above 123000 at least with one full candle.

Equal highs sweptBTC has just swept the previous daily relative equal highs whilst re balancing a 4 hour fair value gap.
Expecting a pull back to 115,880 💪

BTC/USDT Analysis – Full Trend Reversal
Hello everyone! This is the daily market update from a CryptoRobotics trader-analyst.
Yesterday, Bitcoin broke the local market structure to the upside and tested the previously highlighted zone at $114,500–$114,000 (a mirror volume area). A strong buying reaction followed immediately, pushing the price to a new local high.
At this point, we are witnessing a full shift in market direction toward an uptrend. Seller activity remains weak, so we expect the price to continue rising — at least toward the next selling zone at $117,600–$118,600 (volume accumulation).
Below, a new volume area has formed between $115,800 and $114,900. We are watching closely for buyer activity there. If confirmed, it could serve as a long entry. Without such confirmation, the current breakout could turn into a false move, in which case the market may return to sideways rotation.
Buy zones:
$115,800–$114,900 (volume cluster)
$113,300–$112,700 (local absorption of selling)
$110,000–$107,000 (accumulated volume)
Sell zone:
$117,600–$118,600 (accumulated volume)
This publication is not financial advice.

Bitcoin subida a corto plazoBINANCE:BTCUSDT About to explode, I expect a strong market rise, it's only a matter of time, don't stay out

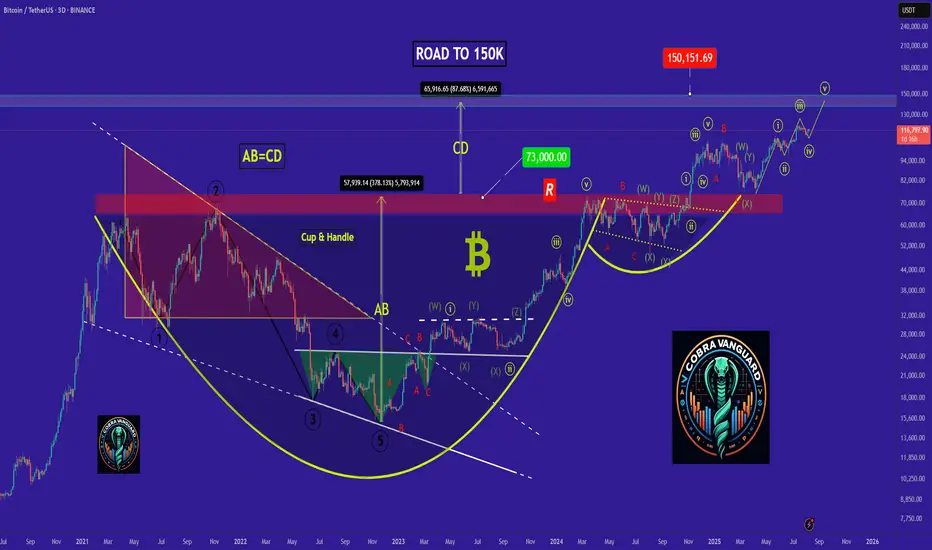
Bitcoin Analysis As Per Seasonality & PatternBitcoin Analysis As Per Seasonality & Pattern - DYOR
Expecting Top Of Bitcoin Around $150k - $160k By The End Of This Year 2025 and Right After That Bitcoin Can Start Falling After Completing Its Bull Cycle
In Next Bear Market Which I Am Expecting In Year 2026 - Potential Bottom Should Be Below $20k - In Next Bear Market Expecting Bitcoin To Take Longest Correction In History Can Around 90% Drop From Its Top
BTC - TOP CYCLE 2025key zones of price & time to watch.
every sign of an accumulation or distribution in those zones would trigger the alert.
BTCUSDT – Ascending Triangle Completing the Path!📊 Bitcoin is currently forming an ascending triangle, clearly marked in bold red.
This zone is showing high volatility and provides great Buy/Sell opportunities for traders. 🔄
📈 If the price breaks out above the resistance line, we can expect a strong bullish move, following the path highlighted in blue polyline, with potential to reach the long-term target of 🔹 1.4 million USDT. 🚀
📌 If you listen closely, this chart’s basically yelling: “Something’s coming...” 🎧👀
🧭 Next move will define the trend — don’t blink.

bitcoin - Time to buy again!The price seems to have completed the fourth corrective wave, and from now on, it's time for a price increase, which will continue up to around $150k .
previous analysis
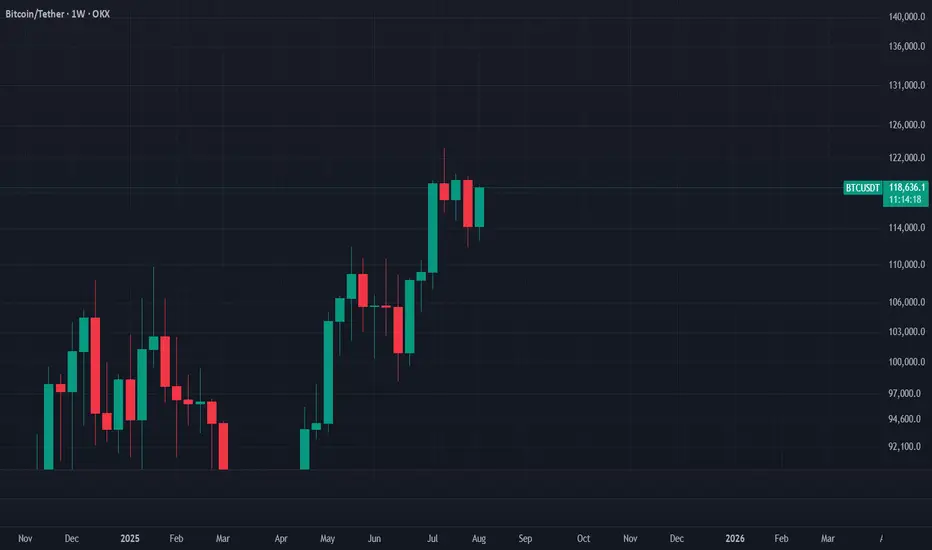
Bitcoin Readies for a $120K Breakout — Watch the Weekly Candle
OKX:BTCUSDT
Summary
If Bitcoin’s weekly candle engulfs the previous one, we can expect an explosive breakout.
Instrument / Timeframe
BTCUSDT, 1W
Scenario
If this week’s candle fully engulfs the prior week, the next week can start decisively bullish and push into fresh highs. For now, we won’t set fixed upside targets; let price discover. Once the market prints a clear resistance at the new peak, we’ll treat that level as Bitcoin’s new ceiling.
Trade Plan (example, not advice)
For long-term buyers who practice sound risk and capital management, a confirmed daily break and close above $120,000 can serve as an entry trigger.
Disclaimer
This is market commentary and reflects my personal opinion. It is not investment advice, a recommendation, or a solicitation to buy or sell any asset. Crypto markets are highly volatile and you can lose part or all of your capital. Always conduct your own research, make independent decisions, and use strict risk management (position sizing, stop-losses, scenario planning). Past performance is not indicative of future results. For guidance tailored to your situation, consult a licensed financial advisor.
#Bitcoin #BTC #BTCUSD #BTCUSDT #Crypto #Breakout #PriceAction #Engulfing #Candlestick #SupportResistance #MarketStructure #Momentum #RiskManagement #PsychologicalLevel #WeeklyClose
Bitcoin Price Outlook 2025–2030 | EMA & MACD SignalsBitcoin trades near $114K in August 2025, sitting just below EMA 9 and EMA 15, while the EMA 200 at $100,870 keeps the long‑term trend bullish. Support at $114K remains crucial, with resistance at $120K–$122K. A close above short‑term EMAs could spark a move toward $127K, while rejection may bring a retest of $110K. Long‑term analysis points toward a potential rise to $300K–$350K by 2030.

$BTC Weekly Analysis – Big Move Coming?Bitcoin is currently trading near the 122300 resistance zone.
So far it looks more like a false breakout of the 120k level, and on a bigger picture I see the potential for a correction into the 90k–100k range. However, this doesn’t necessarily have to happen in the coming days.
Possible scenarios for the week:
Sideways : accumulation within the 115k–120k range.
Bullish scenario : a daily close above 120500 could open the way for a rally toward the 125k–130k zone.
Bearish scenario : if price drops below 115k, I expect a move toward the 102k–107k area. The green zone (~111k) could provide strong support, as it has previously held the price.
RSI on the daily chart is at 63, very close to the overbought zone. A breakout above 120500 could extend the rally, but the risk of a pullback is high.
Disclaimer: The author’s opinion may not align with yours.
BYBIT:BTCUSDT.P
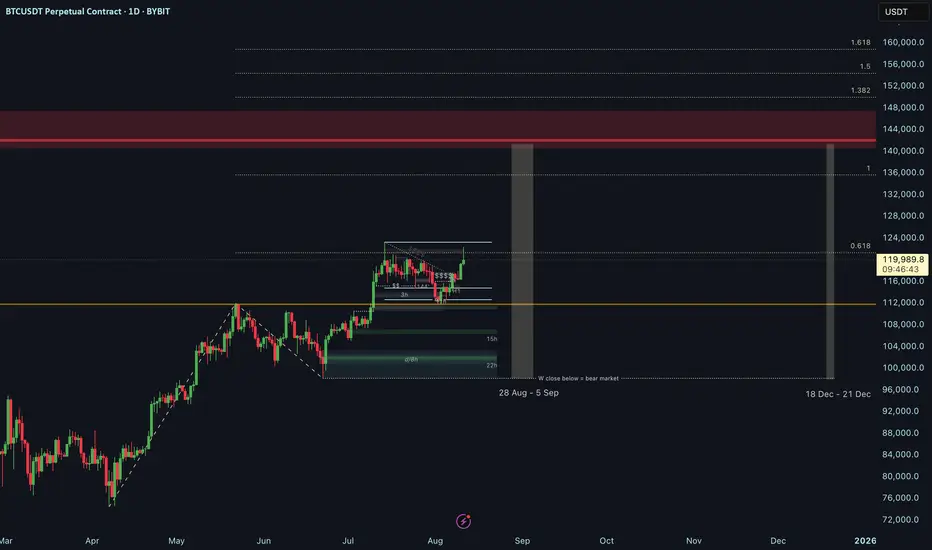
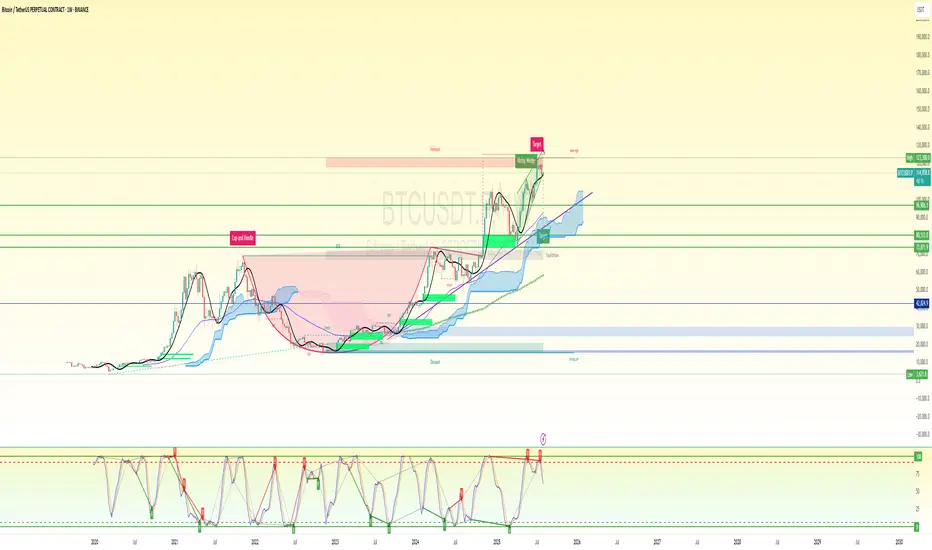
BTC SHORT SET UP (only facts in the chart)📌 Chart Summary
Price: ~$115,000
Pattern: Rising Wedge (Bearish)
Macro Structure: Completed Cup & Handle
Stochastic RSI: Overbought + Bearish cross confirmed
Ichimoku Cloud: Price far above cloud – extended
EMA/MAs: Bullish but overstretched
🧠 Bias-Free Most Probable Setup (Weekly Outlook)
🟥 Bearish Sniper Setup — High Probability
The chart is showing rising wedge exhaustion + Stoch RSI bear cross in extreme overbought = probable correction ahead.
🔽 Short Entry Plan (Sniper Setup)
Entry (Short): $114,200 – $116,000
Ideal sniper zone inside the wedge breakdown area / resistance rejection zone
Stop Loss: $123,000
Above wedge top and key psychological resistance
Take Profit 1 Range: $96,000 – $99,000
Previous major horizontal resistance zone and wedge support retest
Take Profit 2 (final target): $80,500 – $83,000
Major structure zone + Ichimoku cloud top + high-volume node
Risk:Reward: 1:3.5 to 1:5+
📈 Alternate Scenario: Bullish Breakout Setup (Low Probability but noted)
If BTC breaks and closes above $123,000 on weekly, wedge invalidates and opens target:
Breakout Target: $143,000 – $150,000
Based on wedge measured move + Fib extension
⚠️ Additional Confluences Supporting Bearish Bias:
Weekly RSI + Stoch RSI overbought and curling down
Rising wedge near exhaustion
Bearish divergence risk with higher highs in price, lower oscillator momentum
Volume is declining despite price rising – exhaustion signal
🧩 Strategic Notes:
Avoid longing here unless $123K clean break + volume spike
Best play = wait for confirmation of wedge breakdown to enter short
Leverage carefully – this is a macro weekly timeframe setup
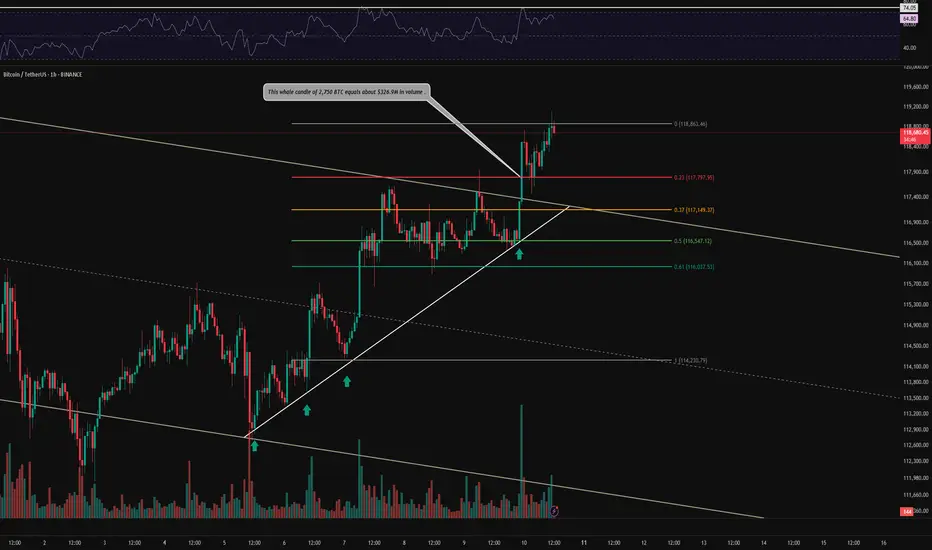
BTC 1H Analysis – Key Triggers Ahead | Day 7💀 Hey , how's it going ? Come over here — Satoshi got something for you !
⏰ We’re analyzing BTC on the 1-hour timeframe .
👀 After breaking out of its descending channel, Bitcoin is moving upward with a high-volume whale candle.
🕯 The trading volume and number of trades are rising sharply, and this volume increase during the New York session could lead to Bitcoin forming a new high.
⚙️ Our key RSI level is 74.05. If this level breaks, the volatility of Bitcoin’s long positions could increase significantly, potentially triggering a price surge.
🎮 After breaking the 0 Fibonacci level and pulling back to it, we can open our positions in line with the market structure change and move with the market.
🔒 An upward-sloping trendline has been drawn from the channel’s bottom to the top, and on the fourth reaction to it, Bitcoin bounced and beautifully broke through the channel’s top.
🔔 There’s no specific alert zone unless the current market structure changes, in which case an alert zone will be provided.
🖥 Summary: Bitcoin is moving upward, our long position trigger has been activated, and if the current structure is maintained, it could continue toward higher price levels.
📊 If USDT.D drops below 4.20% BTC might push toward higher targets .
❤️ Disclaimer : This analysis is purely based on my personal opinion and I only trade if the stated triggers are activated .
BTC 8H – Fib Support Holds, Will Bulls Defend This Reclaim Zone?Bitcoin is back at a key decision point on the 8H chart — retesting the exact zone it broke out from just two weeks ago. This former resistance has flipped to support, but with momentum cooling off, bulls need to step in fast to avoid a deeper retrace.
🔹 Structure & Levels
Price is hovering inside a reclaimed range (blue box), retesting it from above.
Just below sits the Golden Pocket (0.5–0.618) retracement zone from the July rally — a classic bounce zone if the reclaim fails.
The 0.5 level at $110,879 aligns with previous consolidation structure, adding extra confluence.
Further below lies the 0.786 at $103,802, which marks invalidation for most swing long setups.
🔹 Momentum Check
The Stoch RSI has started curling down from overbought, suggesting momentum may stall short term.
If bulls can’t defend the current reclaim zone, we could see a flush into the Fib pocket before trend continuation.
🔹 Bias & Trade Idea
Holding this level = bullish continuation toward $118K–$120K range highs.
Lose it cleanly = watch for signs of reversal inside the golden pocket.
Risk is defined, structure is clear — and BTC has a habit of reacting cleanly to these zones.
Are you buying the dip now — or waiting for a cleaner tag of the Fib levels?
Drop your thoughts 👇

BTCUSDT: Flagging for a Fresh Breakout!🚀 BTC: Flagging for a Fresh Breakout!
Bitcoin (BTCUSDT) on the daily timeframe is currently showcasing a classic bullish continuation pattern, indicating robust underlying strength and a likely ascent toward significant overhead resistance. The price action reflects a healthy consolidation phase concluding, paving the way for further upward movement.
•Powerful Pole Formation : Bitcoin initiated its recent ascent with a strong, impulsive move upwards, establishing what technical analysts recognize as the "pole" of a bullish flag pattern. This initial surge demonstrates clear demand and a forceful entry of buyers into the market, pushing valuations higher. 🚀 www.tradingview.com
•Healthy Flag Consolidation: Following this strong rally, Bitcoin entered a period of measured consolidation, forming a descending channel or "flag." This phase has been crucial for allowing the market to digest gains, with price action finding formidable support at the $113,000 ('Immediate Support 113000') zone. Furthermore, the 'Fib Golden Level 107000' also served as a critical re-accumulation point, solidifying the base. 🚩⏳
•Breakout and Re-Engagement: The asset has now successfully broken out of this bullish flag consolidation, signaling a decisive resumption of the prior uptrend. This breakout from the flag formation, coupled with the previous robust support tests, provides a high-probability setup for a continuation move, validating the renewed bullish momentum. ✨
•Targeting Resistance: Based on the textbook projection of the bullish flag and pole pattern, Bitcoin is poised to challenge the significant overhead 'Resistance 123000' zone. This area represents a critical psychological and technical barrier, and a sustained breach above it would unlock further upside potential, confirming higher highs. ⚡🎯
•Macro Tailwinds: The broader cryptocurrency market continues to benefit from an evolving regulatory landscape and growing institutional acceptance. News surrounding increasing adoption, coupled with ongoing discussions about clearer frameworks for digital assets, are contributing to a positive market sentiment. These macro factors provide a strong fundamental backdrop that supports Bitcoin's current technical strength and its journey toward higher valuations. 🌐 www.tradingview.com
Disclaimer:
• The information provided in this chart is for educational and informational purposes only and should not be considered as investment advice. Trading and investing involve substantial risk and are not suitable for every investor. You should carefully consider your financial situation and consult with a financial advisor before making any investment decisions. The creator of this chart does not guarantee any specific outcome or profit and is not responsible for any losses incurred as a result of using this information. Past performance is not indicative of future results. Use this information at your own risk. This chart has been created for my own improvement in Trading and Investment Analysis. Please do your own analysis before any investments.

BTCUSDT Analysis
BTCUSDT From our previous analysis, BTC initially showed signs of a potential decline, but after holding a long-term support level, it has now pushed toward the 124K resistance. In the short term, a pullback is expected to retest the green support zone before continuing its upward movement.
BTC’s strength is supported by rising demand as an inflation hedge, which could maintain bullish momentum in the coming sessions.

BTC/USDT Analysis – Continued Growth
Hello everyone! This is the daily update from a CryptoRobotics trader-analyst.
Yesterday, Bitcoin tested the local volume area at $115,800–$114,900 and then continued its upward movement, reaching the lower boundary of the strong resistance zone at $117,600–$118,600 (accumulated volume), followed by a pullback.
Currently, the price is hovering around the volume support zone near ~$116,400. Selling pressure is relatively weak and is being absorbed by buyers — which is confirmed by delta data. This makes it reasonable to expect another wave of buying and a deeper test of the resistance zone. After that, we’ll watch closely for the seller’s reaction.
Buy zones:
• ~$116,400 (local volume support)
• $113,300–$112,700 (local absorption of selling)
• $110,000–$107,000 (accumulated volume)
Sell zone:
• $117,600–$118,600 (accumulated volume)
This publication is not financial advice.

$BTC Macro OutlookWeekly Chart
BTC is still trading inside the macro range at $111,959.5–$119,655.0. Last week closed green but as an inside bar, which signals indecision. We also printed a failed auction above the prior higher-high vLevel—hinting at trend fatigue and the risk of a deeper pullback.
As long as price holds $111,959.5, the broader bullish structure is intact. A weekly close below $111,959.5 would likely open room toward the next vLevel near $98,115.4. Until this range resolves, expect two-sided trade and respect the extremes.
Daily Chart
Today’s candle closed as a shooting star (bearish pin bar) with elevated Relative Volume (RVOL), a classic reversal signal at resistance. On the Footprint, delta finished negative and, more importantly, VAH, VAL, and the POC all sit inside the upper wick, which tells us most of the trading occurred near the highs. That’s typical of late longs getting trapped.
With the daily trend pointing lower, the base case is a rotation toward the $111,910 vLevel. Until conditions change, treat bounces as opportunities to stay aligned with the bearish daily momentum.
12-Hour Chart
Structure is still bullish, but this push looks more like a liquidity sweep above the prior range highs, right where most short stops sit; than true initiative buying. If we fail to gain acceptance above the breakout and rotate back inside the range with sell-delta/absorption at the highs, I’ll treat it as a failed auction and look for rotation back toward the range low.
4-Hour Chart
After a clean macro Over/Under, the 4-hour has rotated back into the SWING OTE zone, exactly where I want to be stalking shorts. Despite the 4H still reading structurally bullish, price is boxed inside $118 395.8–$122 165.4 and keeps showing responsive selling into the upper range. For a swing short, the key now is the 30-minute: Invalidation is acceptance above $122 165.4; below that, the short idea stays in play. We’ll break down the 30-min setup next.
30-Minute Chart
The 30-minute is flashing a clean spike in both CVD and Open Interest, fresh longs chased the intraday pump. Best case from here is a full fade of that impulse, turning late buyers into exit fuel. Leverage looks elevated, so a liquidity flush is very much on the table if price can’t hold acceptance above the spike. I’m placing limit shorts inside the intraday OTE zone with my stop just above 122 165.4.

BTC - Full Elliott Wave count for this Bull RunFull BTC Elliott Wave count for this Bull Run
Chart - Bottom left Nov 2022 low of 15k
🔴 Primary waves are circled in red
.......
🔴 Primary waves 1 to 4 are complete
.......
🔴 Primary wave 1 was -
🟧 Intermediate waves 1 to 5
🔴 Primary wave 2 was -
🟧 Intermediate waves WXY
🔴 Primary wave 3 was -
🟧 Intermediate waves 1 to 5
🔴 Primary wave 4 was -
🟧 Intermediate waves ABC
🔴 Primary wave 5 is in play as -
🟧 Intermediate waves 1 to 5
🟧 Intermediate waves 1 to 4 are complete
🟧 Intermediate wave 5 is now in play as -
🟦 5 Minor waves drawn on the chart
Target - 200 to 300k

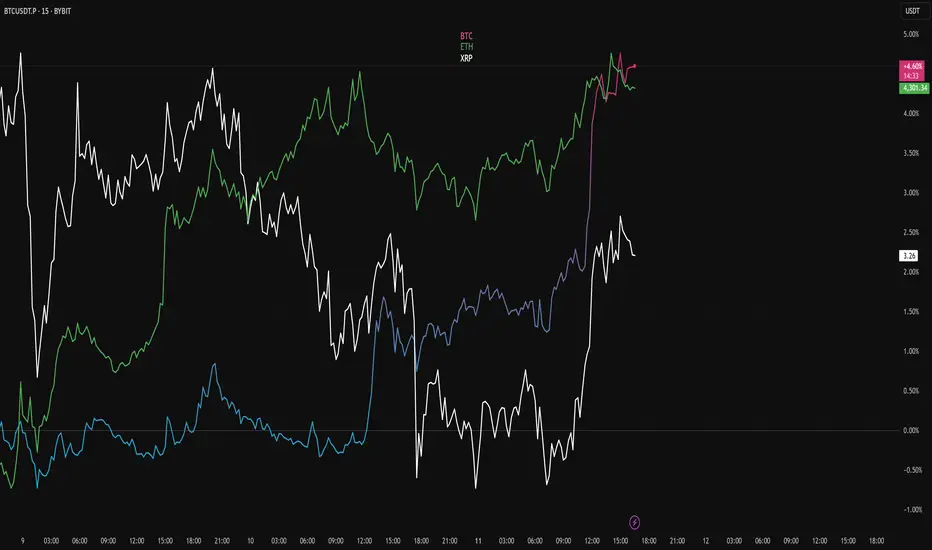
TOP 3 MARKET CAPBTC · ETH · XRP Multi-Chart with RSI Overlay
A clean TradingView setup comparing BTC, ETH, and XRP side-by-side on a % scale, colour-coded for quick correlation tracking:
Orange = BTC
Blue = ETH
Green = XRP
Includes a custom RSI indicator showing all three assets in one pane for instant momentum comparison.
Perfect for spotting divergences, leading moves, and correlation breaks across the majors.
Bitcoin Go 140kAfter a strong break of the trend line, it is ready to launch to the targets of 125,000, 132,000, and 142,000. The MACD and RSI also gave a bullish signal.
125000
132000
142000
🤪🤪🤪
