BTCUSD NEW OUTLOOKBtcusd sell from117,000
Target1 115,500
Target2 114,500
Target3 113,000
Stop Lose 118,500
TRADE AT YOUR OWN RISK
BTCUST.P trade ideas

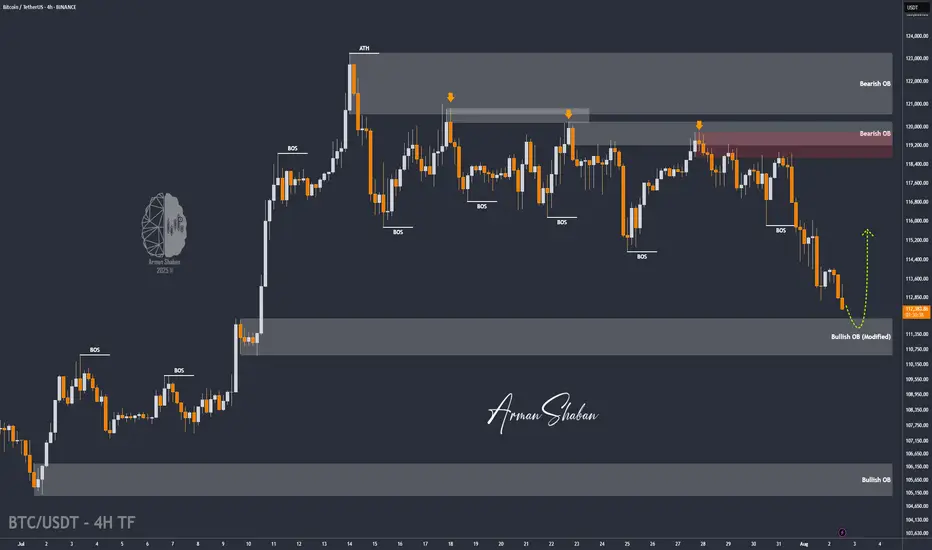
BTC/USDT | Bitcoin Eyes Rebound from $110K Support Zone! (READ)By analyzing the Bitcoin chart on the 4-hour timeframe, we can see that after reaching a new high at $123,218, the price began to pull back and has now corrected down to around $112,500. I expect the current volatility to ease soon. The next critical support zone lies between $110,500–$112,000 — watch price action closely here, as BTC could bounce from this area and push back toward $116,000+. Other key demand zones are located at $109,000, $107,900, and the $105,000–$106,000 range.
Please support me with your likes and comments to motivate me to share more analysis with you and share your opinion about the possible trend of this chart with me !
Best Regards , Arman Shaban
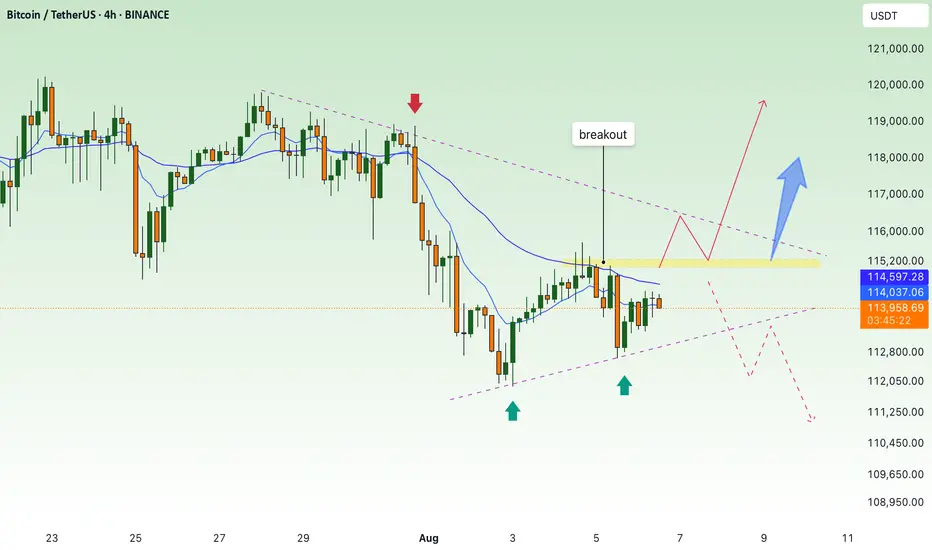
BTC continues to accumulate, waiting for breakout to go up💎 MID-WEEK BTC PLAN UPDATE (06/08)
Brief BTC Analysis – 4H Timeframe:
• Main Trend: Price is consolidating within a descending channel (green diagonal lines).
• Support: The 112,500–113,000 zone has been tested twice and bounced (green arrows).
• Resistance: The 114,800–115,200 zone (purple area) – this is the key level that will determine the next trend.
⸻
Two main scenarios:
🔺 Bullish Scenario (Preferred):
• Price breaks above the 115,200 resistance zone → confirms a breakout from the descending channel.
• Next targets: 116,500 → 119,000.
🔻 Bearish Scenario:
• Price gets rejected at around 115,000 and breaks below the 113,000 support → likely to revisit 110,000.
📌 Key Signals to Watch:
• A clear breakout above 115,200 with volume is a strong buy signal.
• If the price fails to break this zone, consider selling once there is a clear bearish reaction.
$BTC Eliot Wave last step + Golden cross.The entire crypto market is on fire — Golden Crosses everywhere across altcoins. 🔥
BTC looks to be in the 5th wave of an Elliott Wave pattern and has just printed its own Golden Cross. Bullish momentum is clear in the price action.
But how long can this run last?
We may be in a parabolic phase, yet there’s heavy liquidity sitting around $115k.
The logical play: a drop to grab that liquidity, then a push to $120k+.
In the end… only the market makers know. 🎯
DYOR

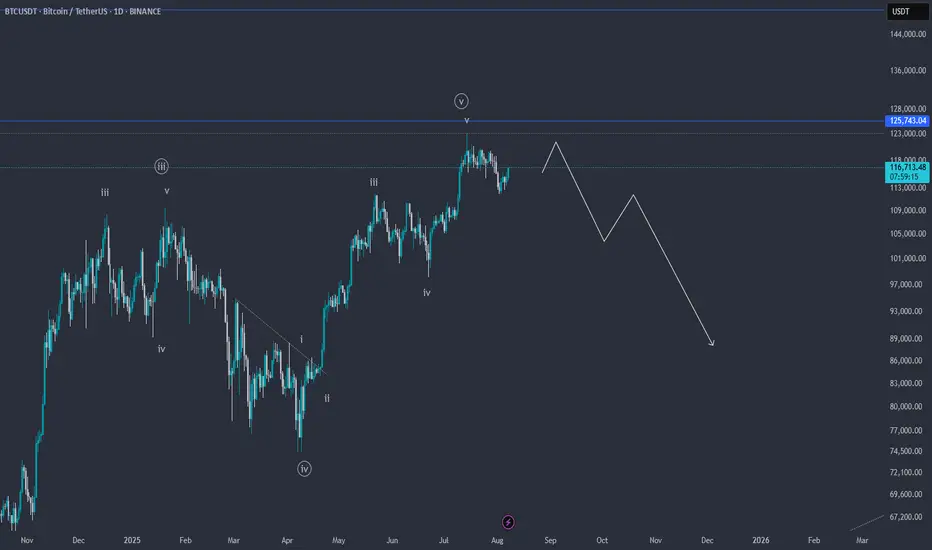
BTCUSDT Elliott Wave – End of the Rally or Start of a Crash?📉 BTCUSDT Elliott Wave Analysis – End of the Rally or Start of a Crash? ⚠️
On the BTCUSDT chart, it appears that the fifth wave of the impulsive structure is nearing completion. The wave count clearly shows a full five-wave sequence, suggesting that Bitcoin may be forming a major top around the $119,000–$125,000 resistance zone.
🔻 If price action confirms a reversal and breaks key support levels, we could see a deep correction potentially taking BTC below $90,000.
📌 Keep in mind this is a scenario based on wave structure and requires confirmation via breakdowns and price action.
💬 What do you think? Is Bitcoin ready for a major correction, or will it break into new all-time highs?
✅ Save this idea & follow for updates!
BTC/USDT.dIt looks like BTC is establishing support above this trendline if you study the line chart on a daily timeframe. A bounce here could mean serious growth... a fake out to go lower.. can be catastrophic. So far we are solid on track to go higher. Lets see
BTC 1H Analysis – Key Triggers Ahead | Day 6💀 Hey , how's it going ? Come over here — Satoshi got something for you !
⏰ We’re analyzing BTC on the 1-hour timeframe .
👀 On the 1-hour timeframe, Bitcoin rebounded from $114,200 after heavy whale buying. It broke through the $115,530 zone and moved toward its resistance at $117,600, but was rejected twice by strong seller tickers in that area. It is now moving toward its current support levels .
🎮 Key Fibonacci zones to watch are the 0.5 and 0 levels. A breakout of these areas can trigger potential long or short entries, making them valuable as breakout triggers .
⚙️ The important RSI pivot level is 44.87; losing this level could lead to a further correction .
🕯 Trading volume and transaction count are rising, suggesting the possibility of another “Bitcoin season.” Large institutions have been buying at the lows, increasing their positions each time. ETF data has turned highly positive, indicating strong recovery potential and attracting more risk capital .
🔔 There are two alert zones: one at $117,500 and another at $116,000. Setting alerts here can help you better track price behavior .
📊 USDT.D has broken above its range box , A break of the current zone could allow Bitcoin to push higher .
🖥 Summary : After its recent pump, Bitcoin is facing resistance from seller tickers and is trying to break through this zone. As long as BTC stays above $116,000, there is potential for another attempt to set a new high .
❤️ Disclaimer : This analysis is purely based on my personal opinion and I only trade if the stated triggers are activated .

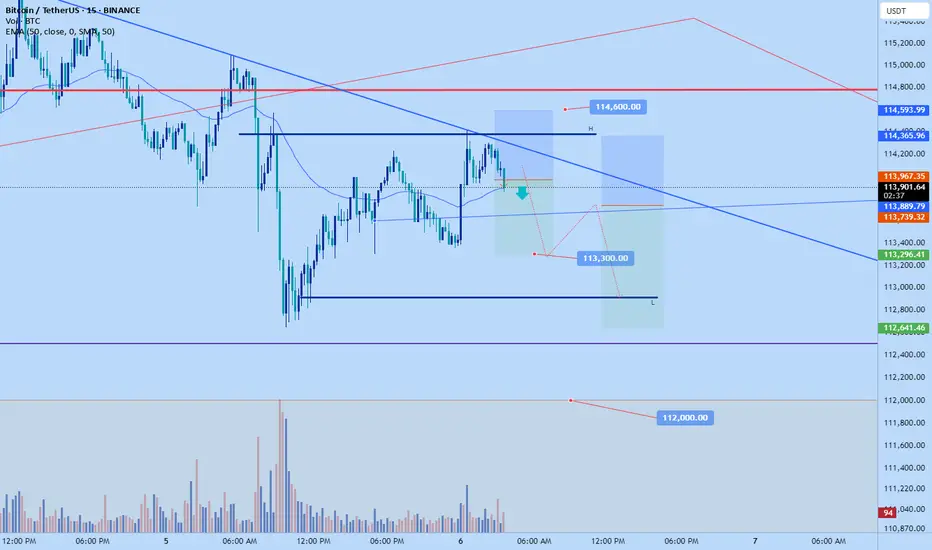
Bitcoin scalp short then main shortJust now opened a scalp short position on #bitcoin. Anticipating another push down to $113300 just in time for another likely correction back up in new york session to dump back down again
Sl: 114,600
TP: 113300
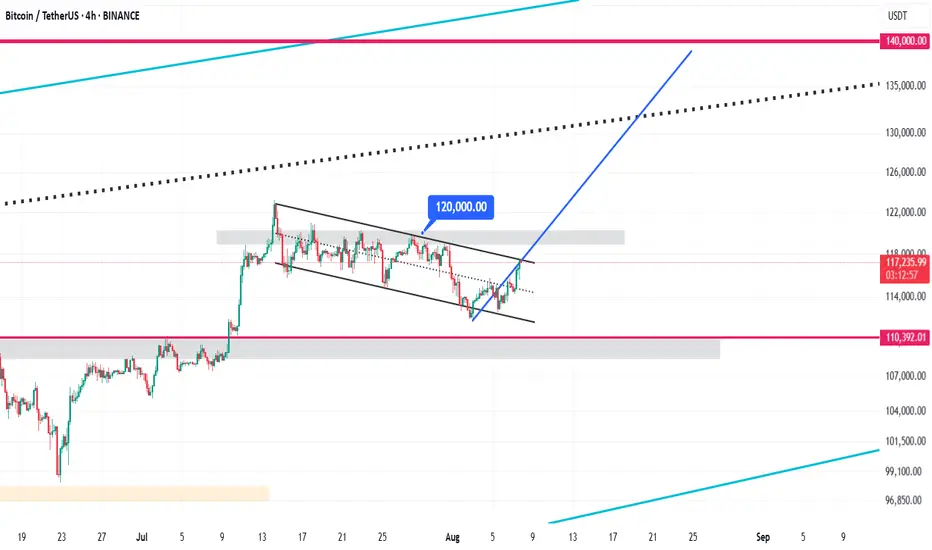
Bitcoin Bullish Flag Pattern Analysis & $140,000 Target🚩 Bullish Flag Pattern Formation
Bitcoin is currently forming a bullish flag pattern on the 4-hour chart. This pattern typically appears after a sharp upward move and represents a short-term consolidation within a descending channel. It usually signals a continuation of the strong bullish trend. Currently, the price is oscillating between the upper and lower boundaries of this channel, poised for a potential breakout.
⏳ Duration of the Correction Phase
The correction inside this channel has lasted from July 14 to August 8, 2025, spanning approximately 25 days. This relatively long consolidation period indicates a deep stabilization phase, allowing the market to gather momentum for the next upward wave. During this time, Bitcoin traded in a tight range between the channel’s support and resistance levels.
⚠️ Critical Resistance at $120,000
The key resistance level to watch is $120,000. If Bitcoin can break this level decisively with strong volume and confirming candles, the bullish flag pattern will be validated, signaling a continuation of the upward trend. This breakout point is considered an optimal entry for new long positions.
🎯 Price Target at $140,000
The target price derived from the bullish flag pattern, calculated by measuring the flagpole and projecting it from the breakout point, is around $140,000. This represents approximately a 20% gain from the breakout and may serve as a significant psychological resistance level.
BTC 1H Analysis – Key Triggers Ahead | Day 5💀 Hey , how's it going ? Come over here — Satoshi got something for you !
⏰ We’re analyzing BTC on the 1-hour timeframe .
👀 After triggering its long signals, Bitcoin moved upward and hit the seller zone at 117,500, then reversed from that level.
🎮 A Fibonacci retracement has been drawn from $ 114,200 to $ 117,560. The price entered the zone between the 0.37 and 0.61 levels, and we need to see whether it reacts to 0.61 with selling pressure or pulls back to 0.37. Understanding market behavior in this area can guide us.
✏️ A curve line has been drawn from the first touch of the maker-buyer zone to the first touch of the maker-seller zone. This line intersects well with the 0.37 Fibonacci level, which has now been broken in current conditions.
🔽 With the increase in short positions and selling volume for Bitcoin, the price experienced a decline and correction. If selling pressure continues, Bitcoin could start a short-term correction.
⚙️ Our RSI oscillator is below the 50 level, with a support zone at 41.22. If this zone is lost, market momentum will lean more towards selling and further correction.
💸 BTC.D , if it breaks 60.72 %, could drop to lower levels, making Bitcoin lighter relative to the market.
💵 USDT.D , if it breaks 4.28 %, could also drop to lower levels, reducing Tether’s share in the market and shifting more capital into Bitcoin and altcoins.
🖥 Summary: Bitcoin was rejected from the 117,560 level and, along with selling pressure, dropped below the 0.37 Fibonacci zone. There is a support level at $ 115,530 — as long as the price stays above this zone, Bitcoin can maintain its upward trend with short-term multi-timeframe corrections.
❤️ Disclaimer : This analysis is purely based on my personal opinion and I only trade if the stated triggers are activated .

BTC crossing key technicals DOWNIt's probably nothing, BTC dropping below 50 and 200SMAs. Again, from a historical perspective, BTC has dropped every time. Don't be left holding the bag! Berkshire is holding record cash and so are many alpha investors.

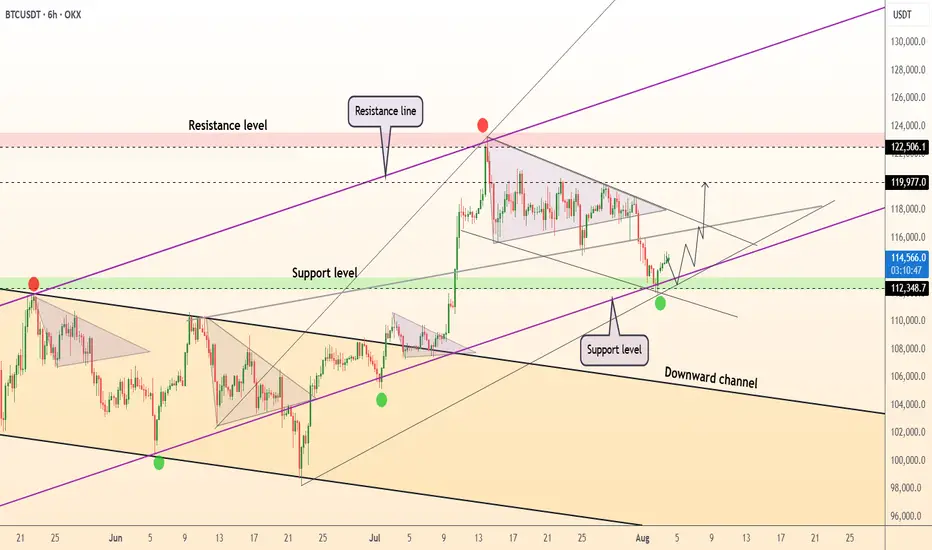
DeGRAM | BTCUSD reached the support level📊 Technical Analysis
● BTCUSD has bounced from confluence support at 112.3k–114.8k, reclaiming the ascending support line and validating the lower boundary of the rising triangle.
● Price action suggests a bullish continuation setup with targets at 119.9k and extension to the upper resistance near 122.5k–125k.
💡 Fundamental Analysis
● US labor data slowdown and dovish Fed commentary have pulled real yields lower, boosting crypto demand.
● Glassnode reports ongoing whale accumulation and rising stablecoin inflows, signaling positive capital rotation into BTC.
✨ Summary
Long above 114.8k. Targets 119.9k → 122.5k+. Setup invalidated on a break below 112.3k support.
-------------------
Share your opinion in the comments and support the idea with a like. Thanks for your support!
Bitcoin Technical Analysis | August 7, 2025 Bitcoin Technical Analysis | August 7, 2025
After a corrective move to the $112,000 support zone, Bitcoin bounced back and is now moving along a rising trendline (highlighted in pink). As long as the price holds above this line, the bullish structure remains intact.
🔸 Currently, BTC is approaching a key resistance zone between $117,500 and $118,600, which aligns with the descending orange trendline on the chart. If this zone is broken with confirmation, the next potential targets will be:
$122,400
and $129,500
🔻 However, if the price gets rejected from this resistance:
The first support lies at $115,570
Breaking below that, the next support will be the purple trendline
A confirmed break of the bullish structure could push BTC down to $110,524
📌 Conclusion:
Bitcoin is nearing the apex of a symmetrical triangle pattern. A breakout in either direction could define the next major move. Make sure to mark these critical levels on your chart and adjust your trading strategy accordingly.

Bitcoin Hits $40,000, It Will Recover —Name Your AltcoinSorry, there is a typo there on the title, I meant to say: Bitcoin hits $114,000, soon to recover.
As you can see from our trading range, Bitcoin just went beyond the lower boundary and hit a new low, the lowest since 10-July but there is good news. There isn't room for prices to move much lower, this is part of the consolidation phase.
The first low happened 25-July and notice the high (bear) volume. The second low happens today and we have lower volume compared to 25-July, but Bitcoin hit a lower low. This reveals that the bearish move is already weak and losing force. It also reveals the fact that Bitcoin is about to recover.
Also notice the RSI, 2H. It hit oversold recently and went the lowest in a long while. Reversals tend to happen when the RSI becomes oversold.
Bitcoin is testing the lower boundary of the trading range, when this happens, the action reverses and moves back up. Prepare to see Bitcoin back above $120,000. It is normal and it will happen... But it is wise to give the market a few days. 5-August was bad last year. It gets bad but it also marks the bottom. Once the bottom is hit, growth long-term.
— Name Your Altcoin
Leave a comment with the altcoins you are holding now and I will do an analysis for you. The altcoins will also recover and we are witnessing just a small retrace. Hold strong as this is the most important part. We will have a very strong new bullish wave develop within days.
As Bitcoin moves to test support, it will reverse to test resistance next. Which one is your top altcoins choice?
Thank you for reading.
Namaste.

BTC 1H Analysis – Key Triggers Ahead | Day 8💀 Hey , how's it going ? Come over here — Satoshi got something for you !
⏰ We’re analyzing BTC on the 4-hour timeframe , Bitcoin is pushing toward its all-time high with a massive, high-volume whale candle .
👀 After breaking through its resistance zones, Bitcoin surged toward its ATH but faced rejection and selling pressure near that level. Key potential support areas are the 25 and 99 moving averages, marked in yellow and sky blue on the chart. The 25 MA is close to the 0.61 Fibonacci level, around $118,000, and is moving toward the average of the last 25 candles. A reaction to this moving average could indicate whether Bitcoin will rebound or drop further .
⚙️ Bitcoin’s key RSI zone is at 55.25, which corresponds to the $118,000 range. Breaking below this could push RSI under 50 .
🎮 Fibonacci retracement drawn from the breakout and pullback of the V-pattern shows that the 0.13 and 0.23 levels failed under selling pressure, sending BTC toward lower support levels. The current support based on Fibonacci is at 0.37. If this is lost, BTC could range on the 4-hour chart between 0.37 and 0.61 .
✉️ Tomorrow at 8:30 AM New York time, the official CPI (Consumer Price Index) report will be released by the U.S. Bureau of Labor Statistics. This news can significantly impact the crypto market — if inflation decreases, purchasing power rises , and Bitcoin could set a new all-time high .
🕯 BTC trading volume and activity are strong in both directions. Each price surge is followed by a quicker consolidation, and corrections occur under selling pressure .
🔔 An alert zone is set at the 0.13 Fibonacci level to observe price behavior when it reaches that point, then decide on the best course of action .
📊 A break below Tether dominance at 4.10% would signal a long position on BTC, while a break above 4.20% could lead BTC into a deeper correction .
🖥 Summary : Tomorrow’s CPI news could spark large, powerful candles and potentially a new ATH for Bitcoin. If U.S. inflation increases, stronger selling pressure is possible. There’s no specific trigger for this current level, but breaking 0.13 will prompt me to open a position — or at least take trades on altcoins with a bullish correlation to Bitcoin .

BTCUSDT 1H Supply Zone Rejection – Bearish Setup in PlayIf price fails to reclaim the supply zone, we expect a rejection and drop toward lower demand areas
Price broke market structure previously at 115,201, which now acts as the first major support
🎯 Trade Plan (Sell Idea):
text
Copy
Edit
Entry: Near 116,800–117,000 (within supply zone)
SL: Above 117,300
TP1: 115,201 (support zone)
TP2: 113,600 (high-probability demand zone)
TP3: 113,000 (orange demand base)
Risk:Reward ~ 2:1 to 3:1
🧠 Key Zones:
🔵 Resistance/Supply Zone: 116,800 – 117,300
🔵 Support Zone 1: 115,201
🟠 Strong Demand: 113,000 – 113,600
📌 Notes:
This is a clean reaction setup from a well-defined supply zone using volume profile and price action. Look for confirmation like bearish engulfing or M-pattern on lower TF before shorting.
⚠️ Disclaimer:
This is not financial advice. For educational purposes only. Always do your own analysis and manage risk.

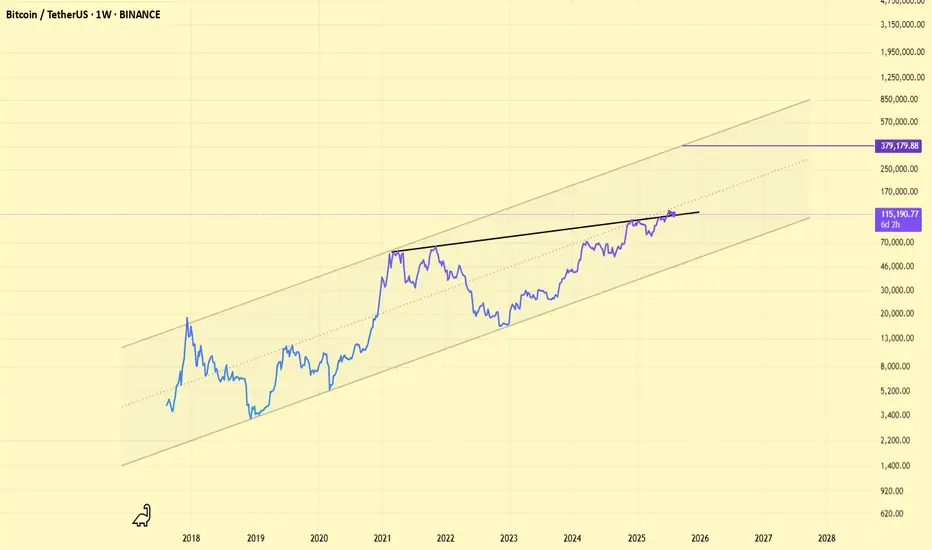
BTC - Short Update Part 2This chart shows the ascending parallel channel that supports 7,000-8,000 ultimate bottom - layered with BITCOIN ONLY liquidity zones on the multi day time frame.
The majority or liquidity in the chart is long position stop losses - leveraged sell orders.
Bitcoin has been moving straight up, consolidating sideways, straight up, consolidating sideways since End 2022.
This tells us the market is collecting long position stop losses and leaving them in tact IE not allowing price to fully drop and start triggering off the cascading chain reaction of sells that is a natural phenomenon.
Happy Trading.
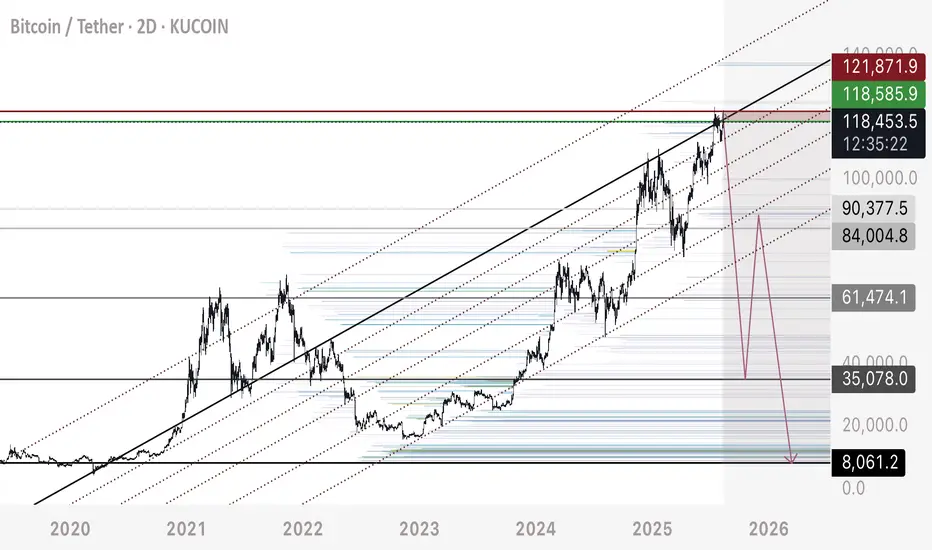
BTC - Short Plan UpdateAs per previous warning of the possibility of upwards liquidity grab first, here are updated details and a better entry for this trade.
Entry - 118,500-119,000
Stop Loss - 122,000
Target 1 - 62,000
Target 2 - 35,000
Target 3 - 8,000
- Note that per my plan we would drop to 35,000 and retrace (long) back up to 84,000 to 90,000 to form a 3 wave corrective drop.
- Note that the ultimate bottom could also sit between 17,000 to 19,000, however per my years of work, I believe 7,000 to 8,000 will be hit.
NOTE THIS IS NOT FINANCIAL ADVICE NOR IS IT A SUGGESTION ON HOW TO MANAGE YOUR MONEY. THIS IS MY PERSONAL TRADE ONLY.
Happy Trading.

BTCUSDCOINBASE:BTCUSD
Well I need price to make a retest to this level since it’s a break of resistance


How to Use AI for Crypto Trading (The Right Way)lemme answer real quick: YOU DON’T.
Most traders using AI in crypto are straight up doing it wrong.
Here’s the usual story:
They open ChatGPT and ask,
“Hey… uhm… tell me which altcoin will 100x… Bruh, I heard you know everything, bet you know the next 10x coin!”
ChatGPT confidently replies,
“Sure, buy this coin right now…”
And the trader’s like,
“Ok, thanks.”
Then they jump on Binance, smash that buy button, and lose money faster than you can say ‘left trading’.
Don’t be that guy. Tools like ChatGPT weren’t made for this wild crypto jungle. Crypto’s a messy, super risky market, and ChatGPT’s language models mostly have old info anyway. They can’t give you solid, grounded analysis of what’s really going on — on-chain or across exchanges.
BUT, if you wanna cut through the hype and dodge the FOMO, this quick guide is for you. I’ll show you how to use AI the right way — with real on-chain and off-chain data, and special AI agents built specifically for crypto research.
Wanna keep going? Cool, let’s dive in. If not, peace out and don’t waste your time.
1. Use AI That Actually Processes On-Chain and Off-Chain Data
Real AI power kicks in when you talk about scale — thousands of tokens, millions of wallet moves, shifting stories everywhere. Humans can’t keep up, but AI can process it all instantly, in real time.
Look for AI tools that analyze stuff like:
Wallet behavior and how smart money moves.
Token velocity and decentralized exchange volumes.
Social sentiment from Twitter, Reddit, Discord, Telegram.
Developer activity, governance updates, protocol changes.
How market narratives pop up and spread.
2. Use AI Agents Made Just for Crypto Research
Crypto’s not like stocks or forex. It’s faster, fragmented, and shaped by both on-chain wallet moves and off-chain communities.
That’s where specialized AI agents shine. They understand stuff like:
How wallets behave during airdrops.
How Telegram groups hype early projects.
How dev activity correlates with price moves.
Instead of raw data dumps, these crypto-native AI agents spot patterns that’d take humans days to find. Like spotting when big wallet clusters start accumulating in a new ecosystem, or when a protocol suddenly blows up on social media.
3. Combine Research & Automation for Full-Spectrum Edge
I’m personally pumped about this part. Imagine an AI agent tracking low-cap funds moving into Telegram channels, running sentiment analysis, then tracking smart wallets accumulating tokens (even mixing in technical analysis).
Finally, it finds your risk management , sets triggers, and helps you enter trades with clear stop-loss and target levels.
Quick heads-up: Because of TradingView’s house rules, I can’t drop any links here — you gotta search and find your best AI tools on your own.
Remember : The only way to survive this market is to stay skeptical , watch risk management like a hawk, and keep your head cool. So if you feel FOMO creeping in or money management slipping — close your laptop, hit a coffee shop, and order a espresso. Trust me, it’s worth it.
Thanks for sticking with me till the end of this lesson. Im Skeptic from Skeptic Lab & If this helped, smash that boost button and I’ll catch you in the next one! :)

BTC/USDT — All-in-one MTF Map & Trade Plan (30m/4H/1D/1W)Summary: HTF uptrend intact; price is compressing inside a rising channel just under 117.4–117.6 (PDH/supply/premium edge). Intraday path: hold 116.7–116.9 → retest 117.4; lose 116.7 → slide to PDL/EQ.
Structure
Weekly: HH/HL above trendlines; weak high ~120k remains a magnet if 118k clears.
Daily: Riding 21/50D EMAs in an ascending channel; shallow pullbacks bought.
4H: Repeated rejections at 117.4–117.6; higher lows along inner trendline.
30m: Tap of channel/EMA confluence 116.7–116.9 after a PDH sweep; momentum neutral.
Key Levels
R1: 117.4–117.6 (PDH/EQH)
R2: 117.9–118.2
R3: 119.6
R4: 120.0k (weak high/liquidity)
S1: 116.9–116.7 (trendline + EMAs)
S2: 116.1 (PDL)
S3: 115.5–115.0 (Equilibrium block)
S4: 114.9–114.4 (demand)
S5: 112.8–112.2 (discount/“strong low”)
Momentum / Volume
RSI mid-50s (room either way).
ADX ~23 (trend mild) → next break likely expands.
Sell wicks at PDH; lighter pullback volume favors bounce if S1 holds.
Setups (If-Then)
Breakout Long: 30m/4H close >117.6 → 117.9/118.2 → 119.6 → 120k.
Invalidation: swift slip <117.2.
Range Long (buy the dip): Bullish reaction at 116.7–116.9 → 117.0 → 117.4–117.6.
Invalidation: 30m close <116.7.
Breakdown Short: Clean 30m close <116.7 then <116.0 → 116.1 → 115.5–114.6; stretch 112.8.
Invalidation: reclaim >116.9.
Bias: Neutral-to-bullish above 116.7 (look for 117.4 retest / 118k squeeze). Bearish below 116.7, targeting PDL → EQ. Wait for edge breaks; avoid mid-range chop 117.0–117.3.
