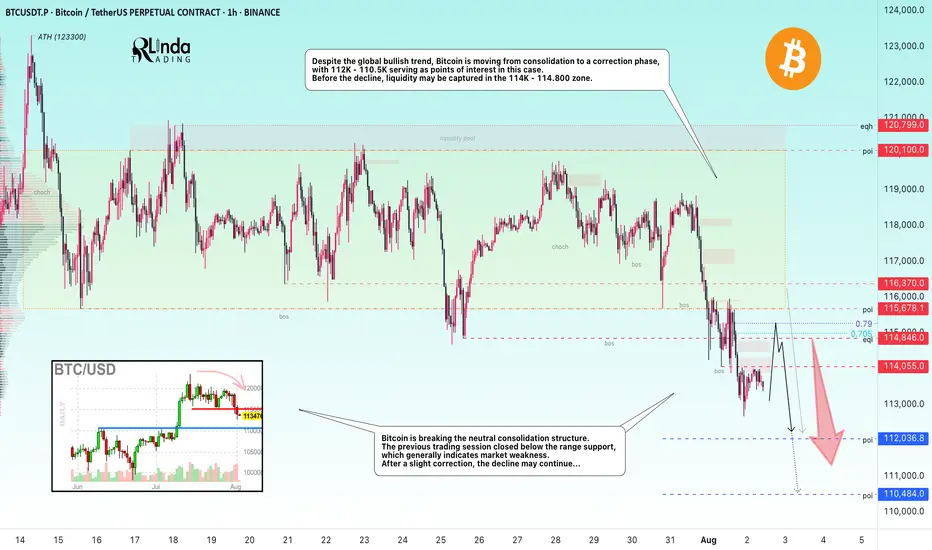
BITCOIN → From consolidation to distribution. Market weaknessBINANCE:BTCUSDT.P is moving from consolidation to a correction phase. The price broke through the support zone of 114.5–115.5, closing within the Friday trading session in the sell zone...
Previous idea from July 22: BITCOIN → Consolidation and compression to 116K. Correction?
The fundamental background is shifting to neutral, the hype has temporarily ended, and there are no bullish drivers yet. And for the health of the market, a correction is needed. Bitcoin is breaking the neutral consolidation structure. The previous trading session closed below the support range, which generally indicates market weakness. Despite the global bullish trend, Bitcoin is moving from consolidation to a correction phase, with 112K - 110.5K serving as points of interest in this case. Before the fall, liquidity may be captured in the 114K - 114.800 zone.
Resistance levels: 114.05, 114.85, 115.67
Support levels: 112.03, 110.48
After a strong movement, the market may enter a correction or local consolidation, during which it may test the specified resistance zones before continuing its downward movement to the zone of interest and liquidity at 112 - 110.5.
Best regards, R. Linda!
BTCUST.P trade ideas
BTCUSDT- Why I Took This Trade – Liquidity & Structure ExplainedSTEP 1 - First, I start by marking the higher timeframe structure. On the H4 chart, I saw a market structure shift — signaling that price could be ready to target the sell-side liquidity.
STEP 2 – Liquidity Mapping]
I mark out two key liquidity zones
Buy-side liquidity above the swing high
Sell-side liquidity below the recent lows
Smart money will often target one side before moving to the other.
STEP 3 – CHoCH Confirmation]
On the lower timeframe, we got a Change of Character (CHoCH) — price failed to push higher and started rejecting from the buy-side liquidity zone.
This tells me buyers are losing control.
STEP 4 – Entry Trigger
After the CHoCH, price retraced into a Fair Value Gap (FVG) that also aligned with a bullish order block turned resistance.
That’s my confluence to go short.
STEP 5 – Stop Loss & Target
Stop loss is placed above the swing high for safety.
My target? The sell-side liquidity, where price is likely to run stops before reversing.

BTCUSDT-D Go 130_140 The daily candle is completely fake and the move towards the channel ceiling continues, don't be fooled, avoid selling trades.
Bitcoin Go 130k

BTC-CRYPTO Market - Heavy Drop !!! coming Soon !!! Dear Traders,
I believe the Bitcoin market is nearing the end of its bullish cycle, and the 127K to 131 K range will be its last bullish move. The market will then enter a deep correction and experience a significant drop.
If you are a holder, be cautious. The market could experience a sudden heavy drop from the mentioned levels.
If you found this post helpful, I would appreciate it if you share your thoughts. Support me with a like and comment.
Regards,
Alireza!

Finale is done.So many bearish patterns are there.
Before I said, finale always leads to alt bull-run. But, it is almost ended too.
However, it doesn’t mean cycle is end.
I just think CRYPTOCAP:BTC will be in big box-range. This range is too wide to say that it is just the Healthy Pullback. That’s the reason why I said “finale is end. bearish.”.
Alt finale is also end but I still think alt is better than btc at current markets because btc will be at the big range box price. I prefer low fdv or nice float of cmc/fdv alts from now. Heavy, especailly CRYPTOCAP:ETH needs time to relay the bull run .
Summary
>>Finale is ended. DCA time for $BTC. Trading time for low cap ALTs. No long-term view now.

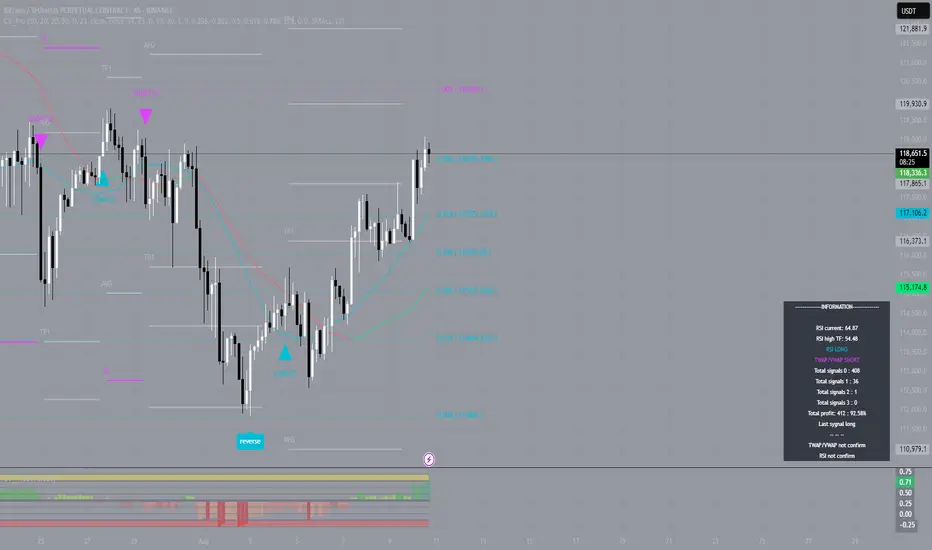
#BTC — TP2 Closed by Indicator SignalAs anticipated, Bitcoin continued its upward movement, and our indicator precisely identified the optimal entry point for a long position. The signal was triggered around the $114,000 level, allowing for a timely entry and guided trade management toward the target levels.
The first target was reached within three days, and yesterday the second Take Profit (TP2) level was successfully closed. Throughout the entire trade, the indicator consistently outlined holding zones and partial profit-taking points, ensuring a systematic approach free from emotional decision-making.
The current price is approaching the TP3 area; however, divergence and convergence analysis indicate an increased likelihood of a correction. Despite the absence of a clear reversal impulse, the risk-to-reward ratio has already reached an optimal level, making profit-taking at the current range a justified decision.
The long position opened on the indicator’s signal delivered strong results once again, confirming that precise entries and algorithm-based trade management enable traders to fully capitalize on market movements.
Bitcoin Go 133300On the daily time frame, three bullish charts indicate another bullish move and another high.
Tp1:125800
Tp2:128000
Tp3:130000
Tp4:133000

Bitcoin Market OverviewBitcoin is currently following the bullish (green) scenario. The 1H RSI is overbought, and the 4H RSI is already above 70, so I'm closely watching the price action. A local correction would be logical before a potential move up toward the resistance zone at $118,319–$120,179 .
If the price drops back below the $115,000 level, I’ll be looking for a decline toward the support zone at $112,300–$110,400 .

Bitcoin is forming a double bottom ┆ HolderStatKUCOIN:BTCUSDT is bouncing from 112,000 support, forming a potential double bottom. The setup aligns with prior bullish continuations from similar consolidation zones. A push toward the ATH region could follow if buyers remain in control.

BTC Analysis – The Most Likely Scenario
BTC Analysis – The Most Likely Scenario 🔥🚀
♦️ BTC ♦️
If today’s daily candle closes bullish and tomorrow we see a red engulfing candle ➡️ time to close positions.
But if we only see a rejection from the 120,000.00 level today ➡️ tomorrow the probability of breaking this zone increases.
🟡 On the monthly timeframe, it’s better to have a stronger candle with a larger body.
🟡 Lately, US traders have been 2-3 days behind Asian traders, so we could see momentum building in the US session in the next few hours.
If BTC.D rises above 60.98 ➡️ look for coins that are bullish against BTC pairs and go long.
If BTC.D keeps dropping or rejects from 60.98 ➡️ most altcoins will pump, and triggers will be easier to find on their charts.
♦️ TOTAL ♦️
Uptrend confirmed ✅ Finally broke the key 3.92 level. Look for triggers in BTC or alts.
♦️ TOTAL2 ♦️
Uptrend ✅ Broke the key 1.53 level.
Break of 1.57 = next trigger.
Break of 1.62 = last entry chance before a possible bull run.
♦️ USDT.D ♦️
After 19 days, we’re back testing 4.13.
Break above = 🔥 major bullish potential.
Rejection = should not go back above 4.20.
♦️ Most Likely Scenario ♦️
BTC stays bullish with rising dominance 📈. Then BTC needs to rest & range, at which point dominance will drop. If this happens, alts — which have been moving small and slow — could explode with huge momentum.
Best to open positions before BTC starts ranging, because once it rests and dominance starts falling, you won’t get an easy entry.
Given current market conditions, rejections and stop hits in alts are possible. But personally, I’d rather enter at these levels and take a stop-loss than miss the move entirely. 😎
🚀 Smash the rocket, follow for more setups, and stay ready for the next big move!

BTC 140K Loading…
We nailed the LONG entry right at the golden zone 🎯
Now CRYPTOCAP:BTC is breaking out with force – bulls fully in control 🐂🔥
📊 Targets in sight:
🎯 T1 – $126,472 ✅
🎯 T2 – $132,320
🎯 T3 – $138,556 (140K psychological level next 🏆)
Weekly + Daily both showing bullish continuation 📈
Every dip = opportunity until we tag that 140K zone 💪

BTCUSDUpdate on this
I’ll keep y’all updated but for now price doesn’t have enough volume since it’s weekend

BTC 4H Ascending Support Retest, Will Supply Zone Reject Again?BTC has been respecting this ascending trendline since late June, with buyers stepping in each time price approached support. Now, price is hovering just above the trendline while the upper supply zone remains a strong ceiling. A clean bounce here could push us back toward 120K resistance, but a breakdown would likely open the door to a deeper pullback toward the June demand zone. Bulls need to defend this level decisively to avoid losing the uptrend momentum.

BTC BUYBitcoin in “interesting spot” during support retest
Bitcoin price comparisons keep coming as market participants see similarities between current market structure and earlier in the bull run.


BTCUSDTPreferably suitable for scalping and accurate as long as you watch carefully the price action with the drawn areas.
With your likes and comments, you give me enough energy to provide the best analysis on an ongoing basis.
And if you needed any analysis that was not on the page, you can ask me with a comment or a personal message.
Enjoy Trading ;)

U.S. Pensions Enter Crypto Amid Quantum Threat to BitcoinThis week, U.S. President Donald Trump signed an executive order allowing retirement 401(k) plans to invest in cryptocurrencies, as well as private equity and real estate. The move opens the door for digital assets to tap into the $12 trillion U.S. retirement savings market.
A Watershed Moment for Institutions
Integrating cryptocurrencies into retirement plans could be a historic step toward recognizing digital assets as a legitimate asset class. Younger investors, in particular, stand to benefit from exposure to high-growth, long-term instruments. However, financial advisors caution that cryptocurrencies remain highly volatile and should be part of a diversified investment strategy.
Risks and Opportunities
While expanding crypto access through pension plans offers significant upside, it also raises questions around regulation, investor protection, and fee transparency. Past market downturns have shown that excessive exposure to volatile assets can harm savings during periods of instability.
The Quantum Threat to Bitcoin
Parallel to the pension plan news, experts are increasingly discussing the potential threat of quantum computing. According to Barron’s, by the mid-2030s, technological advances could compromise the cryptographic security of older Bitcoin addresses. While approximately 75% of BTC is already stored in more modern, secure wallets, the industry is accelerating the development of quantum-resistant protocols.
Defensive Strategies
Blockchain developers — including the Bitcoin Core and Ethereum Foundation teams — are testing post-quantum cryptography algorithms to ensure long-term security. The objective is to stay ahead of technological breakthroughs that could otherwise undermine digital asset safety.
Conclusion
The U.S. decision to allow crypto investments in pension plans is a milestone for the industry, signaling maturity — but it also presents new regulatory challenges. Meanwhile, the quantum computing threat serves as a reminder that the crypto sector must invest not only in growth, but also in securing its foundational infrastructure.

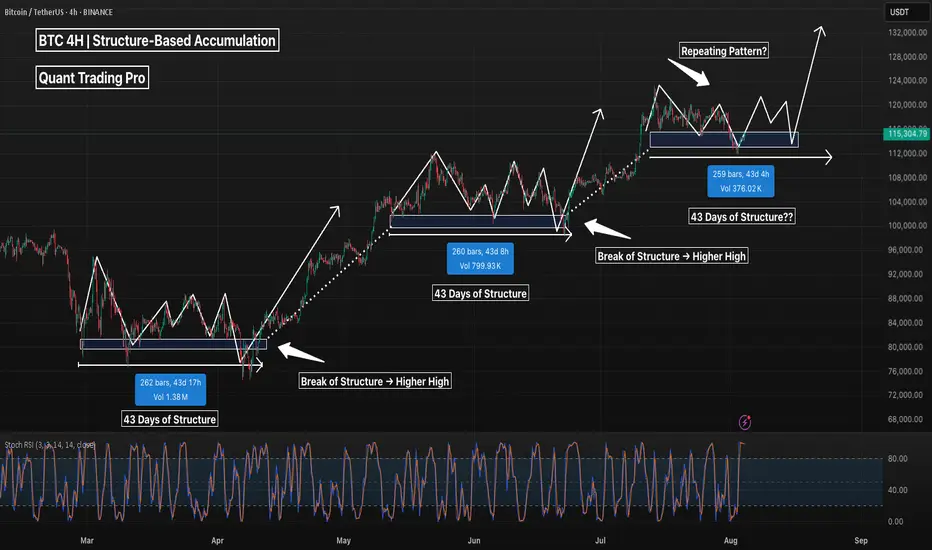
BTC 4H – Repeating Accumulation Pattern, But Will It Hold Again?Bitcoin has shown a clear structural tendency to consolidate for ~43 days at key demand zones before breaking to new highs. This 4H chart highlights three nearly identical accumulation phases, each lasting around 260 bars with a clear base, fakeout, and bullish continuation.
We’re now sitting in the fourth demand zone, with price revisiting the same volume pocket and reclaiming key structure. If history repeats, we may be looking at another breakout leg above $124K+.
Key observations:
– Each consolidation zone lasted ~43 days
– Volume decreases into the base → demand absorption
– Reclaim of structure precedes each leg up
– Current consolidation mirrors previous 3 (in time, shape, and volume)
⚠️ A clean break below ~$112K would invalidate the pattern and suggest deeper retracement.
Are we seeing another accumulation leg… or distribution in disguise?
Drop your thoughts below.
#Bitcoin #BTCUSDT #Crypto #TradingView #PriceAction #MarketStructure #BTC4H #CryptoAnalysis #Accumulation #Wyckoff #SwingTrading #PatternRecognition #TechnicalAnalysis
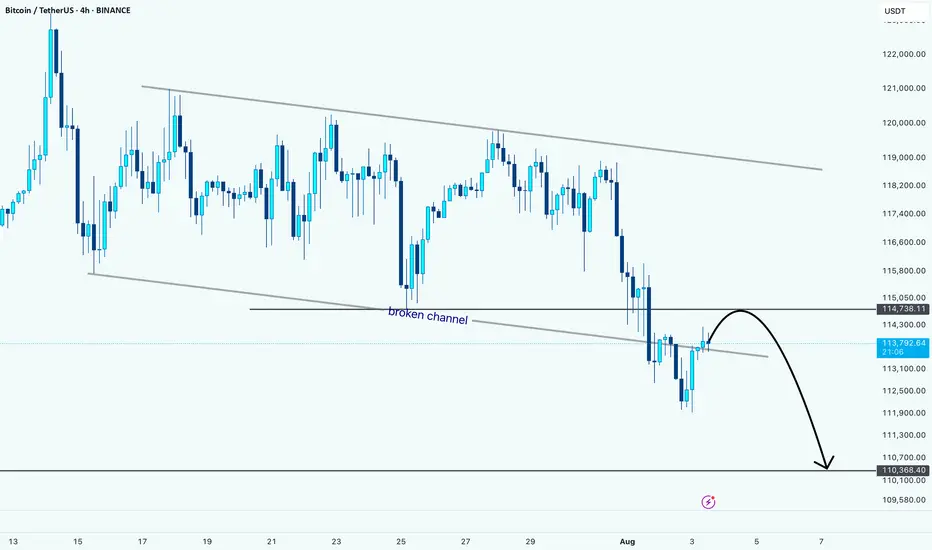
BTC Breaks Down: Retest Could Lead to More LossesHello guys!
Bitcoin has officially broken below the descending channel it was stuck in for weeks. Right now, price is pulling back to retest the broken channel, which is now acting as resistance around the 114,700 zone.
What I'm watching:
Broken channel = bearish signal
Retest zone around 114,700
Downside target near 110,400
So far, it looks like a clean setup for further downside, unless bulls manage to reclaim that broken trendline. Until then, the pressure remains to the downside.
Let’s see how price reacts here... Rejection = short opportunity.
BTCUSD : Short levelHere is a great entry point for those who scalp this instrument or pips. The level is marked with a red arrow. It will be active until I report. It may become inactive over time.
Watch out for trading on the news.

Latest BTCUSDT Update TodayBitcoin surged to an incredible $122,056 by the close of trading on August 11, once again challenging the key resistance level of the world’s leading cryptocurrency. But this isn’t just any number—this is the Fibonacci 1.618% extension, known as the "golden ratio" in technical analysis.
The golden ratio originates from two major market bottoms: the 2018 bear market low and the 2022 bear market low. For those who have tracked Bitcoin through various cycles, these timeframes mark the darkest periods in the history of the cryptocurrency market.
In my view, Bitcoin surpassing new highs is just a matter of time after a month of accumulation. I’ve witnessed strong ETF inflows, more companies buying Bitcoin, and positive remarks from the White House.
While Bitcoin struggles with resistance, Ethereum is on a completely different trajectory. According to TradingView data, ETH has tripled from $1,435 in April to its current price of $4,315.
Bitcoin’s volatility is still near all-time lows, while Ethereum has seen a significant increase. Just a month ago, the market predicted a 5% chance for Ethereum to reach $4,500 in August, but now everything has changed.
Many traders are betting on ETH revisiting its all-time high.
The simultaneous price surge of Bitcoin and Ethereum has pushed the total cryptocurrency market cap to a new record high of $4.14 trillion. This number reflects the strong recovery of the entire blockchain industry after a challenging phase.
With the strong rally this weekend, we expect Bitcoin and Ethereum prices to continue rising, unless there are any tariff shocks.
Will Bitcoin break through and challenge its all-time high? Stay tuned!

NeoWave Alert: BTC G-Wave Sets Up a Brutal Drop After $116K PumpAs anticipated in our previous NeoWave analysis, the market appears to be deep within Wave G of a Contracting Diametric structure (A–G), originating from the March 2025 high.
⸻
🔻 Key Developments:
• After rejecting from $119,000–119,500 (Wave F resistance), price dipped to $112,000, breaking below the previous channel’s lower bound, and now appears to be forming a steeper descending channel.
• This new channel’s resistance has shifted lower to $116,000, becoming a potential bull trap zone.
• The bounce from $112K is likely a liquidity sweep, preparing for one final upside to $116K, followed by aggressive distribution.
⸻
💡 Trading Thesis:
We’re likely seeing a trap-style rally within Wave G, aiming to:
• Attract liquidity up to $116K
• Induce late longs before initiating a more violent selloff toward $105K or lower
⸻
🔍 Smart Money Confluence (SMC / ICT)
• 🟥 Confirmed bearish structure on 1H (Lower Highs + BOS)
• 🟨 Liquidity above $120K already swept during Wave F
• 📉 Order blocks around 119.5K rejected
• 🔻 Price currently trades above $114K, but trapped inside a sharper descending range
• 🧲 Unfilled FVGs between $113K–$110K may serve as magnets
⸻
🧠 Wave G Structure (Diametric)
• Possibly unfolding as a Zigzag or Complex Combination
• Channel boundary now capped at $116K
• Wave G likely targets a breakdown below Wave E ($113K) and toward $105K
⸻
📌 Primary Scenario:
• Final push to $116K → strong rejection expected
• Bearish continuation targeting $110K → $105K
🧯 Invalidations:
• Clean breakout & daily close above $120.5K invalidates this diametric structure
• Watch for triangle or flat morphing if structure shifts
⸻
⚠️ Risk Management:
• $116K = key distribution zone
• Watch closely for rejection and breakdown confirmation
• Shorts valid below $114K with tight invalidation above $117K
⸻
📌 Conclusion:
Bitcoin is nearing the climax of a multi-month complex correction. The current setup favors a liquidity trap toward $116K, followed by continuation of Wave G toward major demand zones. Smart money bias remains bearish below $117K.
⸻
💬 Drop your alternate wave counts or SMC confirmations in the comments!

BTC Trade Plan 03/08/2025 - where to buy BTC?Dear Trader,
Bitcoin's price is currently moving within a double channel, with the midline of the channel around 108,000. The first scenario is that the price reaches the midline of the channel and then starts an upward movement. The second scenario involves a sharp downward move towards a stop hunt target around 97,000-100,000. In both cases, as long as the price remains above the 100822 level(Daily Close), the bullish trend will continue.
Regards,
Alireza!
