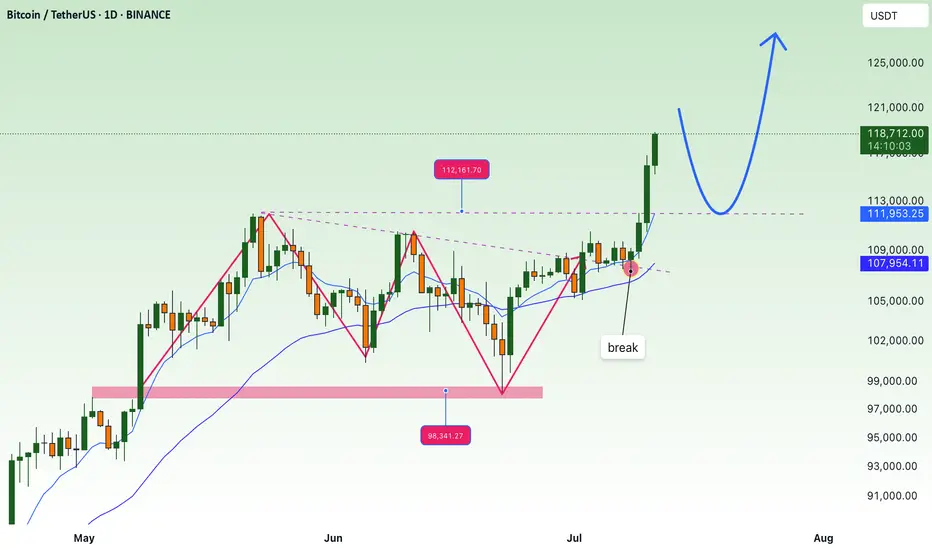
Flawless ExecutionA picture-perfect trade on CRYPTOCAP:BTC from start to finish. 🎯
The Plan: Wait for the breakout above resistance.
The Result: A powerful move straight through our target zone.
Clean analysis, clean execution, clean profits. On to the next one.
#Bitcoin #Trading #Crypto #TechnicalAnalysis #BTC
BTCUST trade ideas

Bitcoin hits a new high! Is this time really different?Bitcoin hits a new high! Is this time really different?
Bitcoin hits a new high! On July 11, BTC broke through $117,000 in one fell swoop, completely igniting market sentiment. Shorts were completely defeated, and 230,000 investors were liquidated within 24 hours, losing $541 million, of which 89% were short orders-this market is simply rubbing shorts on the ground!
But this rise is different from the past.
🔥 Why is Bitcoin so strong this time?
Institutions buy frantically: Bitcoin spot ETFs such as BlackRock and Fidelity continue to attract money, with net inflows exceeding $1.44 billion in 2025. What's even more exaggerated is that listed companies buy directly-143 companies around the world have hoarded 850,000 BTC, worth $95.3 billion! MicroStrategy alone holds 576,000 bitcoins and makes a fortune!
Expectations of Fed rate cuts: The market is betting that the Fed will cut interest rates this year, the dollar is weakening, and funds are pouring into Bitcoin for risk aversion.
Regulatory relaxation: Hong Kong, the EU and the United States are all promoting cryptocurrency compliance. The Trump administration even plans to establish a "national cryptocurrency reserve" to make institutions feel more at ease entering the market.
📈 Technical side: Can it rise again?
Breaking through key resistance: Bitcoin has stabilized at $112,000, the daily level "ascending triangle" breakthrough has been confirmed, MACD golden cross, RSI healthy (not overbought).
Next target: $120,000! But if it falls below $107,000, it may face a correction.
Be careful of high leverage: The current market is dominated by futures, and the spot/derivatives trading volume ratio is only 0.07. Once it pulls back, it may trigger a chain of liquidations!
⚠️ Risk: Don't be blinded by FOMO (fear of missing out)!
Short-term overbought: H4 level RSI has reached 72 and may pull back at any time.
Policy variables: If the Fed postpones the rate cut or the situation in the Middle East worsens, BTC may fall to $55,000!
Regulatory uncertainty: Global policies have not yet been unified, China still bans cryptocurrencies, and the problem of stablecoin reserves has not been completely resolved.
🚀 Operational suggestions: How to operate?
Radicals: Buy when it falls back to around $110,500, with a target of $120,000 and a stop loss below $107,000.
Conservatives: Wait until it stabilizes at $117,500 before chasing the rise, or wait until it falls back to the support level before entering the market.
Long-term holding (HODL): Institutions are hoarding coins, why are you panicking? But don't bet all in, keep some bullets to deal with black swans!
🎯 Conclusion: The bull market continues!
This wave of Bitcoin's rise is driven by institutions + policies + liquidity. Unlike the retail carnival in 2017 and 2021, this rise is more sustainable. But the market will not only rise but not fall, and it may fall back in the short term. Don't use high leverage!
Remember: make money in a bull market and make money in a bear market. Don’t be afraid of missing out (FOMO), and don’t be greedy. Only by surviving can you get the next wave of dividends! 🚀
(PS: If you haven’t bought it yet, don’t worry, wait for a pullback before buying it. There are always opportunities in the market, but if the principal is gone, it’s really gone!)
Bears Getting Ready On #BTC#BTC is approaching a key resistance zone after a strong rally. Bearish signals are forming on the chart, suggesting a potential reversal. A short position could be favorable if the price fails to break above this level. Watch for confirmation before entering the trade
BTC BIG SHORT!We did a mirror retest, and many other signals also point to a sharp decline, indicating numerological codes 69/96.

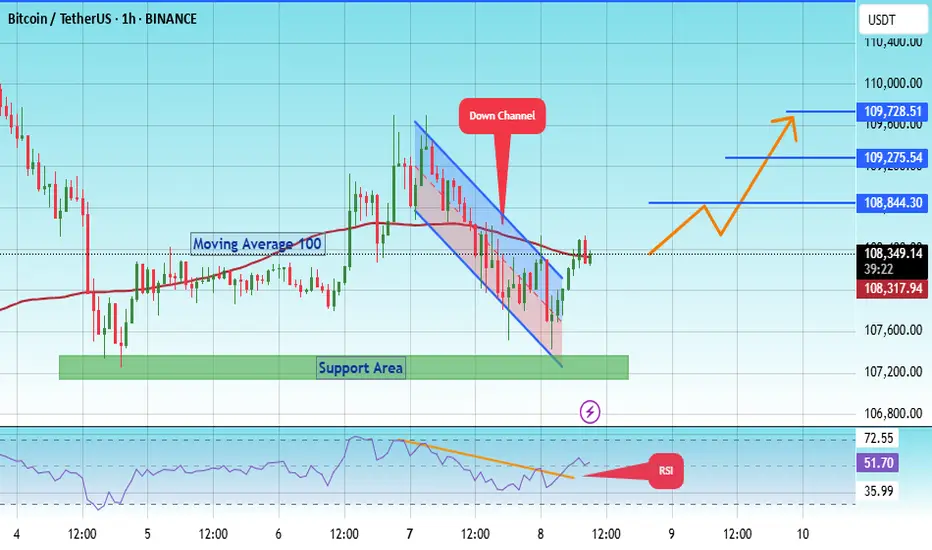
#BTC/USDT Bitcoin Recovers Above 108,000 $#BTC
The price is moving within a descending channel on the 1-hour frame, adhering well to it, and is on its way to breaking it strongly upwards and retesting it.
We are seeing a bounce from the lower boundary of the descending channel. This support is at 107600.
We have a downtrend on the RSI indicator that is about to break and retest, supporting the upside.
There is a major support area in green at 107217, which represents a strong basis for the upside.
Don't forget a simple thing: ease and capital.
When you reach the first target, save some money and then change your stop-loss order to an entry order.
For inquiries, please leave a comment.
We are looking to hold above the Moving Average 100.
Entry price: 108337.
First target: 108844.
Second target: 109275.
Third target: 109728.
Don't forget a simple thing: ease and capital.
When you reach the first target, save some money and then change your stop-loss order to an entry order.
For inquiries, please leave a comment.
Thank you.
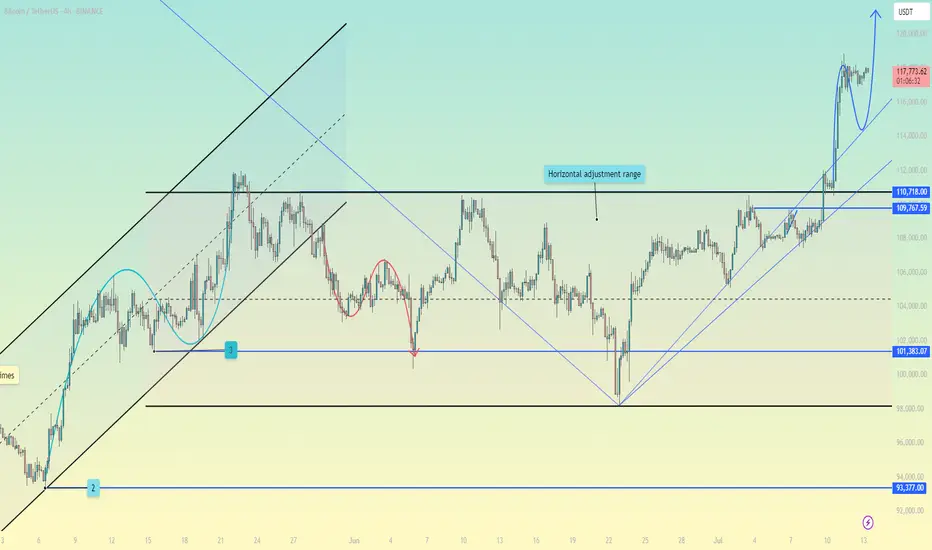
FOMO price increase, create new ATH💎 Update Plan BTC weekend (July 11)
Continuously creating a new ATH, preparing to have a short sale?
The reinforcement of Bitcoin price around the upper boundary of the previous consolidation area was broken at $ 108,355, which ended on Wednesday. The price has soared to the highest level of the new time of $ 116,868 on Thursday. At the time of writing on Friday, the price is fluctuating above $ 116,600.
When BTC entered the price exploration regime and if the trend of increasing continues, the price can expand the momentum to an important psychological level of $ 120,000.
Technical analysis angle
Our community has continuously chose the trend of increasing as the mainstream for all previous transactions and currently preparing to welcome 120k as forecast.
The relative power index (RSI) on the daily chart reaches 71, higher than the excess buying 70, showing a sharp increase. However, traders should be cautious because the ability to adjust the decrease is very high due to over -purchase. Meanwhile, the average divergence dynamic indicator (MACD) has shown a price intersection at the end of June. The indicator also shows that green histograms are increasing on neutral zero, showing that the rising momentum is being strengthened and continues to increase.
However, if BTC must be adjusted, the price may extend the decline to search and support around the upper boundary of the unified area that has been broken earlier at $ 108,355.
Plan has been constantly accurate in the past 2 months, which is the positive signal of the channel that brings value to the community.
Please follow the channel to receive accurate scenarios about gold and BTC
==> Comments for trend reference. Wishing investors successfully trading
BTCUSDT - going to 113866.19$My analysis is based on numerology, all the numbers you see on the chart are from the same place. There is a certain numerological symbolism, which tells me that the price has already put the bottom 49(13) and will make a reversal from the zone 52260+- and then will fly strongly upwards with the target first 89k bucks, and after 113k. It's time to look for a good entry point.

BTC — Harmonic Parabolic Scenario 1. Rise to 110–111k by July 4–5
2. Drop into July 9–10
3. Parabolic move after July 10
4. TP: ATH+
5. Stop: scenario invalid if no breakout

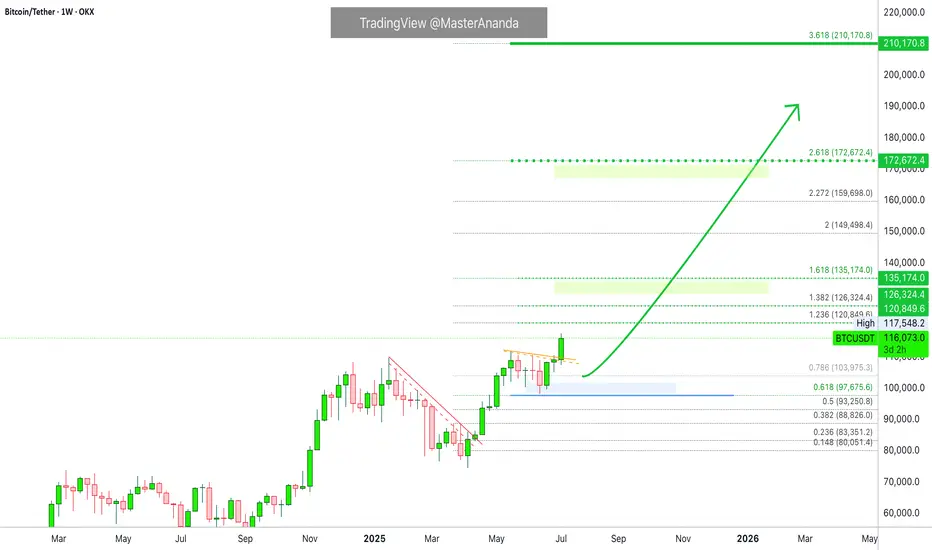
Bitcoin's Next Target Based on a 210 Days Long ConsolidationAfter each 210 days long consolidation phase Bitcoin advanced 137% on average, from bottom to top, since the November 2022 bear market low. Such an advance would put Bitcoin at a price of $170,000 next.
Now, the 137% is just the average. In one occasion Bitcoin rose 83% while in another occasion total growth amounted to more than 200%. We are counting the rise from the consolidation phase lowest point.
Let's look at some numbers:
» An 83% rise would put Bitcoin just above $135,000.
» A 128% rise would put Bitcoin right at $170,000.
» A 202% rise would put Bitcoin at a price of around $225,000.
~200% is how much Bitcoin grew between late 2023 and early 2024.
How much will Bitcoin grow exactly? We don't know. What we can know for sure is that there is plenty of room available for growth.
We are aiming for at least 100% growth starting from 100K, that is, a target of $200,000. Can be $180,000 just as it can be $220,000. That's the cycle top.
Do you agree with this target?
Leave a comment with your number.
Thank you for reading.
Namaste.
July 10th Market Outlook –Charted Waters & Uncertain Momentum🗓️📊 July 10th Market Outlook – Charted Waters & Uncertain Momentum 🌊⚠️
Today’s breakdown is a reality check for traders navigating a market full of setups but short on clarity. Resistance is stacking across the board, but that doesn’t mean we can’t break through — it just means we need to stay sharp and keep our charts close.
🔎 Highlights from the 19-minute video:
Bitcoin is approaching a third and crucial resistance test. A breakout could trigger ultra-FOMO, but failure here could send us lower.
Ethereum is in a pressure zone — the "Symplegades" setup from Greek mythology reflects today’s narrow trading path.
Bitcoin Dominance is clinging to support — if it breaks, altseason could be on. If it holds, alts may stay sidelined.
NASDAQ & Nvidia have delivered massive runs, but signs of exhaustion and reversal risk are showing.
Dollar Index (DXY) showing a Golden Cross, but unresolved rate expectations could catch markets off guard.
💬 I also speak candidly about market manipulation, being someone else’s exit liquidity, and why we might be heading toward a formative trap before any true breakout.
🎥 Watch the full video to catch all the details — from long-term setups to real-time chart reactions.
📌 Stay tuned for detailed updates today on Bitcoin, Ethereum, Bitcoin Dominance, NASDAQ and more.
One Love,
The FXPROFESSOR 💙
Disclosure: I am happy to be part of the Trade Nation's Influencer program and receive a monthly fee for using their TradingView charts in my analysis. Awesome broker, where the trader really comes first! 🌟🤝📈

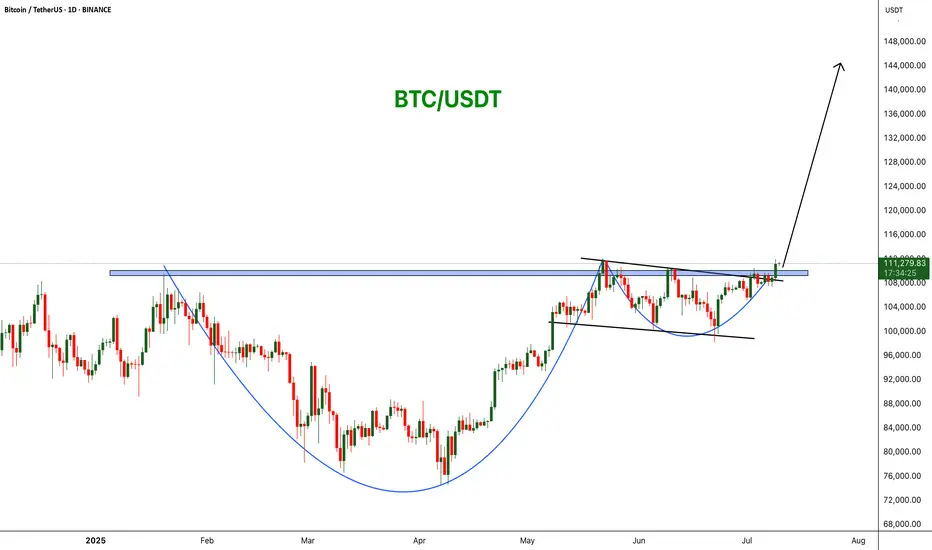
BTCUSDT: Cup and Handle Breakout! BINANCE:BTCUSDT is forming a powerful bullish breakout from a cup and handle pattern on the daily chart. Price has cleared key horizontal resistance around $110,000, signaling strength and the potential for a continuation move toward $144,444.
Stop Loss: $98K
Target : $144k
CRYPTOCAP:BTC
Candlestick Patterns - How to read them like a ProOverview
Candlestick charts serve as a cornerstone in technical analysis, presenting price activity in a visually digestible format. By examining how prices move over a given timeframe, traders gain key insights into potential market direction, sentiment shifts, and trend strength.
Mastering candlestick interpretation is essential for identifying bullish or bearish sentiment, as well as for spotting possible trend reversals or continuations. Still, candlesticks alone don’t paint the full picture—using them without broader context increases the risk of false signals.
---
What You'll Learn
What are candlestick charts?
Common bearish candlestick patterns
Common bullish candlestick patterns
How to apply candlestick analysis in trading
---
What is a Candlestick Chart?
A candlestick provides a snapshot of an asset’s price behavior during a specific time interval, whether it's one minute, one hour, or one day. This format allows traders to quickly assess how the price has moved within that period.
Each candle reveals four price points:
* Open – the price at the beginning of the interval
* Close – the price at the end of the interval
* High – the highest price reached
* Low – the lowest price during that time
Anatomy of a Candlestick:
* Body: The thick section between the open and close. A green (or white) body means the close was higher than the open (bullish), while red (or black) means the opposite (bearish).
* Wicks (or Shadows): Thin lines extending from the body to indicate the high and low.
* Upper wick: Marks the highest traded price
* Lower wick: Marks the lowest traded price
---
Bearish Candlestick Patterns
Understanding bearish candlestick patterns helps traders identify moments when buying momentum might be running out—setting the stage for a potential downward shift.
Evening Star
A three-candle formation that signals a shift from buying pressure to selling dominance. It starts with a strong bullish candle, followed by a small-bodied candle of indecision, and concludes with a large bearish candle that cuts deep into the first. This pattern often appears at the end of an uptrend.
Bearish Engulfing
This setup includes a small bullish candle followed by a large bearish candle that completely swallows the previous one. It indicates that sellers have seized control, potentially marking the beginning of a downward trend.
Shooting Star
With a small real body near the low and a long upper wick, this pattern reflects strong early buying that is ultimately rejected by the close—suggesting fading bullish momentum.
Gravestone Doji
This candle opens, closes, and hits its low all around the same price, leaving a long upper wick. It suggests that bulls pushed higher during the session but were overpowered by bears by the close.
Three Crows
Three consecutive bearish candles, all approximately the same size. These indicate that a sell off is coming soon.
---
Bullish Candlestick Patterns
Bullish patterns can alert traders to possible reversals after a downtrend or strengthen conviction during an uptrend.
Morning Star
This three-candle formation marks a potential turning point from bearish to bullish. It begins with a strong bearish candle, followed by a smaller candle showing indecision, and ends with a large bullish candle breaking upward—signaling buying strength is returning.
Bullish Engulfing
This two-candle pattern begins with a bearish candle, then a larger bullish candle that completely envelops the previous body. It reflects a sharp transition in sentiment, suggesting renewed buying pressure.
Dragonfly Doji
A single candle where the open, close, and high are all very close, with a long lower wick. It shows sellers pushed prices lower but buyers stepped in and brought them back up—an early sign of possible reversal.
Hammer
A classic bullish reversal signal that features a small real body near the top and a long lower shadow. It indicates a battle where sellers initially dominated, but buyers managed to close near the open price.
Three soldiers
Three consecutive bullish candles, all approximately the same size. These indicate that a big buy is coming soon.
---
Trading with Candlestick Patterns
Candlestick patterns become more meaningful when they align with major chart areas—such as previous support or resistance, trendlines, or retracement zones. A bullish signal at a support level can hint that the downward pressure is fading, while a bearish pattern at resistance may warn of an upcoming decline.
To increase the reliability of your trades, combine candlestick patterns with other forms of technical analysis:
* Support & Resistance Zones: These are price levels where the market has historically reacted. Candlestick patterns forming near these zones have stronger potential implications.
* Fibonacci Levels : These help identify likely retracement areas. When a candlestick pattern forms near a key Fibonacci level like 61.8%, it adds strength to a potential reversal setup.
* Liquidity Areas: Clusters of orders (buy or sell) tend to create strong reactions. When patterns appear in these zones, they often precede more decisive moves.
* Technical Indicators : RSI, MACD, Moving Averages, and Stochastic RSI can provide confirmation. For instance, a bullish reversal pattern that appears when RSI is oversold strengthens the signal.
💡 Tip: Don’t rush into trades based on one candlestick alone. Always wait for the next candle or price confirmation (e.g., a break of a previous high/low) to validate your signal.
---
Thanks for Reading!
✨ If you found this helpful, show some love by liking or commenting!
🔔 Don’t forget to follow for more technical breakdowns and trading insights coming soon!

BTC - Last Chance to be Mindful of Potential Flash CrashBTC is at the top of the zone of this bearish retest.
DXY is currently retesting a major breakdown on the monthly time frame - which projects out a 2-4 year bull run for BTC.
Due to this major macro turning point, it’s possible we see an extreme liquidity grab crash on Bitcoin - recovering liquidity as shown on this chart.
Projected movements marked here.
Be prepared for anything - volatility expected

$BTC - Much Higher or Much Lower. EoY '26I'm not gonna lie, I drew these lines with my balls. I use them to move my cursor on my computer monitor.
This is not financial advice. This is just how my deep gut instinct likes to draw brushstrokes.
I gave 4 optional trajectories.
These will likely not happen, nor is it likely that the Price Action and Valuation will stay within these lines.
Enjoy and Happy Trading!
Mr. Storm

Bitcoin's New All-Time High = Altcoins Market Bull MarketThe shy new all-time high is in and it is good to be Bitcoin today. It is good to be Bitcoin, to be in Bitcoin and profit while trading Bitcoin but the bears got rekt and that's oookkkk. We accept their loss and it is their loss they earned it by being short when the market is good, bullish and strong. Who would short Bitcoin right before a new all-time high? I don't know.
A new all-time high was hit today, the price $112,000 but this is not the end. Not even close. This is the beginning of the next bullish wave.
I know what you are thinking, or might be thinking; Wait, but what about a drop? What about the correction? Will it go lower? Can I buy Bitcoin at 90K? I told you to buy when prices were low... "You would look like a genius for buying below 80K," 100K is already gone. No, no correction! Bitcoin is going up.
When resistance breaks it means higher. When prices move higher it means higher. When a new all-time high hits it means the bulls win. Now that the bulls won, the battle for the rise or the drop, we can expect higher prices. If you have any doubts, look at the altcoins. The altcoins market says we are entering a period of long-term growth.
Bitcoin will continue to hold strong. It will continue to rise surely, slowly, or fast, but long-term. It doesn't matter the speed; Bitcoin for the whales, altcoins for retail.
A small capital will grow faster with the altcoins because they have higher room for growth. The projects being smaller, more volatile makes for a good trading experience. Higher risk but also a higher opportunity to grow in the short- and mid-term. Bitcoin is good to retire now. Bitcoin is great to hold value, to support the market as it continues to grow.
For me and for you, welcome to the altcoins market bull market.
Thanks a lot for your continued support.
Namaste.

BTC makes new all time highs!Crypto has been soaring today.
Ethereum and BTC pumping liquidity!
Fed minutes came out today around 2pm, indicating rate cuts at next meeting and throughout the rest of the year and crypto absolutely loved that.
Crypto thrives in a cheap liquidity environment, rallying in potential rate cuts.
We took profits on IBIT calls - still holding longs in the BTC market expecting higher price.

All Binance Coins Watchlist 2025 JULY If you want to create a full list of all coins from the exchange you use, you can:
1. Go to Screeners
2. Set these filters:
a. Exchange (eg. Binance)
b. Quote currency - USDT
c. Symbol type - Perpetual
3. Keep Scrolling till the end of the list so that all coins are populated. There should be about 400+ coins.
4. Select one of the coins, then click Ctrl A to select all.
5. Right click > Add to an existing Watchlist or Create a new watchlist.
Here's my list i created on 4th July 2025. You can import it if you want.
www.tradingview.com


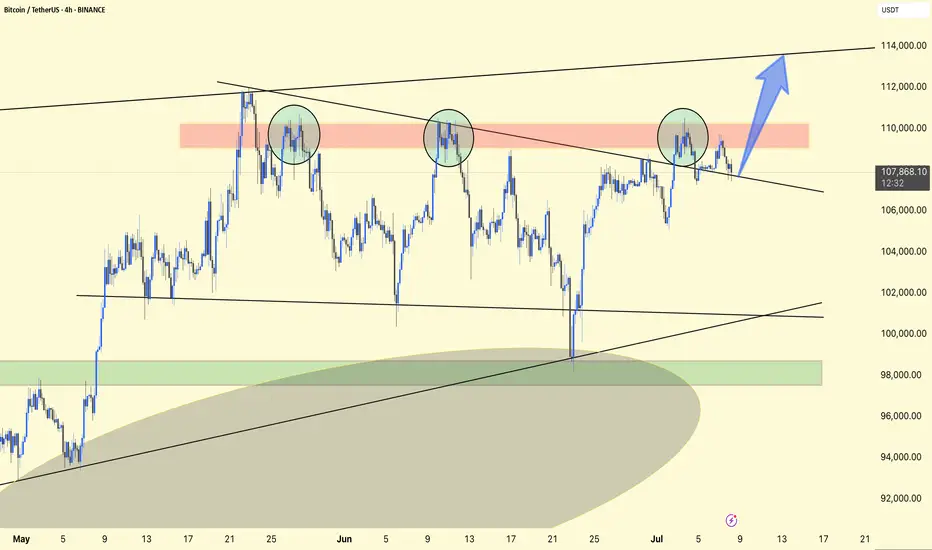
BTC/USDT Chart Analysis (4H)Patterns and Structure:
Bitcoin remains inside a larger converging structure (symmetrical triangle/wedge) visible from the diagonal trendline.
The price has recently broken above the descending resistance trendline but is hovering near the red resistance area (~$109,000–$110,000).
Ichimoku Cloud:
The price is currently above the Ichimoku Cloud, which acts as support (~$107,000–$108,000 area).
The cloud below the price is green, indicating bullish momentum.
Key Areas:
Resistance Area: $109,000–$110,000 (red box). Multiple previous rejections from this area.
Support Zone: $106,000–$107,000 (cloud and trendline support).
Key Lower Support: The green box near $98,000–$100,000, in case of a deeper retracement.
Possible Scenario:
As your blue arrow suggests, if Bitcoin consolidates above the breakout level (~$108,000), a rally towards the next major resistance between $112,000–$114,000 is likely.
Conversely, losing the breakout zone could see BTC return to retest lower support levels around $106,000 or $100,000.
Short-term Outlook:
The trend bias remains bullish as long as BTC stays above ~$107,000.
Monitor price reaction to the red resistance zone for breakout confirmation or potential rejection.
Conclusion:
BTC is showing signs of strength, but the $109,000-$110,000 resistance zone is crucial. A confirmed breakout above this zone could accelerate the move towards the $112,000-$114,000 targets.
Stay tuned for updates and key levels to watch!
Thanks for your support!
DYOR. NFA

$BTC/USDT Eyes $121KCRYPTOCAP:BTC has broken out of the descending wedge and is holding above key support around $106K.
The structure looks bullish with a potential move toward $121K (+11.24%).
As long as the price stays above the breakout zone, momentum favors the bulls.
DYOR, NFA

TradeCityPro | Bitcoin Daily Analysis #122👋 Welcome to TradeCity Pro!
Let’s dive into the latest analysis of Bitcoin and major crypto indicators. As usual, this update will focus on potential triggers for the New York futures session.
⌛️ 1-Hour Timeframe
On the 1-hour chart, Bitcoin is once again ranging between the 107,853 and 108,619 levels.
✔️ Last night, Bitcoin briefly faked out below the bottom of this range, so we now need to wait and see how the price reacts upon revisiting this area.
💫 I believe it’s best to hold off on entering a short position until we identify the precise location of the support line. As price retests this area, we can pinpoint the true support level.
✨ Once that level is confirmed, and if it breaks, a short position could be considered. The next support zones would be at 106,586 and 105,370.
📊 Make sure to watch the volume closely for this trade, and I strongly recommend waiting for a volume confirmation before entering.
📈 As for a long position, if 108,619 breaks to the upside, we could consider going long. The buying volume in the current upward leg is increasing, and if this trend continues, a breakout above 108,619 would make a long position reasonable.
👑 BTC.D Analysis
Moving on to Bitcoin dominance — it has once again reached its trendline and is currently being rejected from it. If this rejection continues, BTC.D could decline toward 65.04.
🔍 However, if the trendline breaks, the 65.31 level will be the bullish confirmation trigger.
📅 Total2 Analysis
Now on to the Total2 index (altcoin market cap excluding BTC), it has bounced from the 1.14 support and is moving toward 1.16.
🔑 A breakout above 1.16 would serve as a bullish confirmation for long positions, with 1.17 acting as the main breakout trigger.
📅 USDT.D Analysis
USDT dominance is also moving downward and has reached the 4.78 support zone.
💥 A breakdown below this level would confirm a bearish continuation toward the 4.72 level..
❌ Disclaimer ❌
Trading futures is highly risky and dangerous. If you're not an expert, these triggers may not be suitable for you. You should first learn risk and capital management. You can also use the educational content from this channel.
Finally, these triggers reflect my personal opinions on price action, and the market may move completely against this analysis. So, do your own research before opening any position.

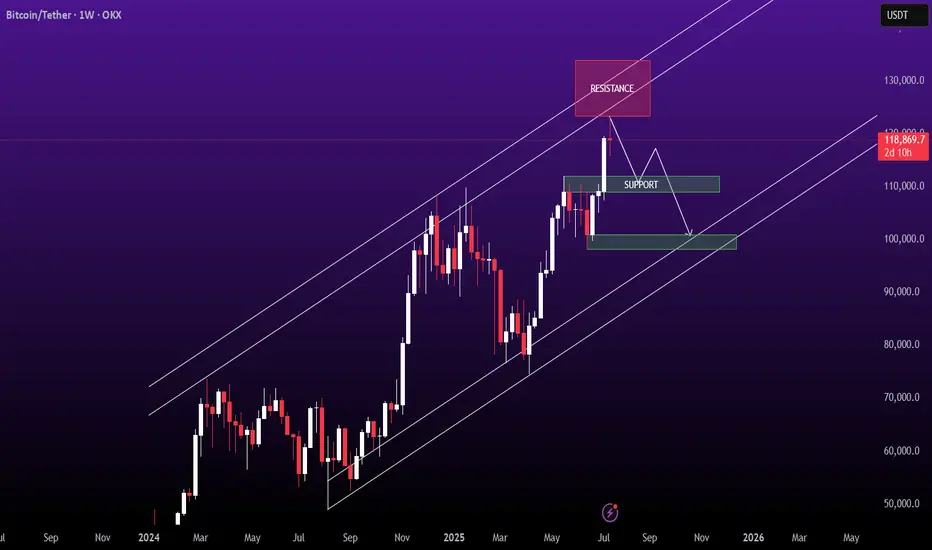
Is Bitcoin Getting Ready to dump?
In this analysis, I looked at the weekly, daily, and 4-hour timeframes and found some key signals that suggest a major shift might be coming in Bitcoin’s movement over the next few days and weeks.
If you don’t want to get caught off guard by the next big move, make sure to watch the video all the way through!

BTCUSDT 4H Analysis
BTC is consolidating below the key resistance zone highlighted in red (~$109,000–$110,000).
The price continues to form higher lows, showing bullish pressure despite rejection in the red zone.
The structure resembles an ascending triangle, indicating a potential breakout.
Upside Target: ~$113,500–$114,000 if the price moves above ~$110,000 with strong volumes.
Support Zone: ~$106,000–$106,300 must hold to keep the bullish scenario intact.
If the support breaks, the price could retest ~$102,000–$103,000.
Small Insights: Repeated retests of resistance suggest that bulls are absorbing supply. A strong push above the red zone could trigger a short squeeze.
Stay alert!