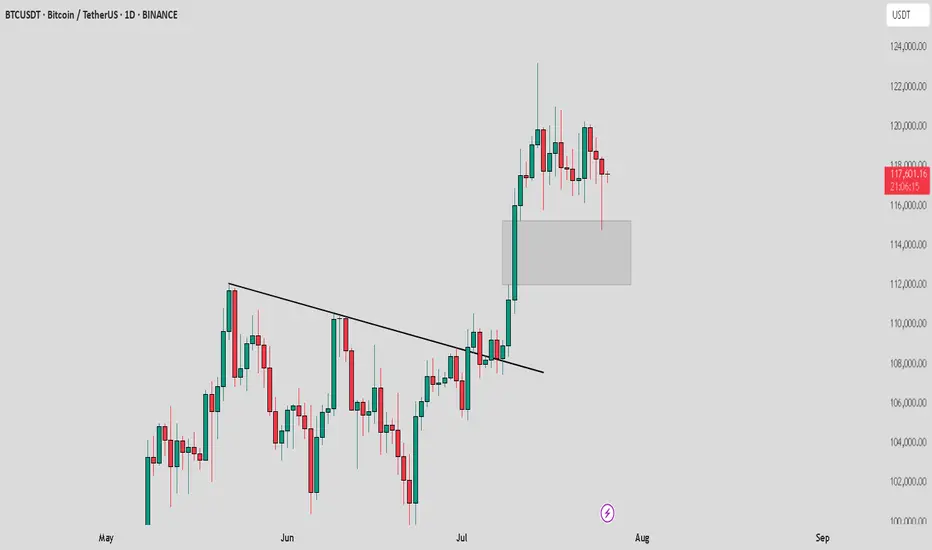
Bitcoin is OverheatedI’m observing the current situation in the BTC market and want to share a brief reflection. The latest upward impulse doesn’t just look confident—it’s starting to resemble overheating.
The price has detached from its averages, and the movement is accompanied by local euphoria. I see the community piling in “at the highs,” hoping for continuation. But it’s crucial to understand: markets don’t grow forever. Especially when the growth lacks proportional volume and fundamental support.
I use a comprehensive technical approach, and one of my indicators has given a clear signal—the market is overheated. We’re currently seeing a classic state of overbought conditions: the price is moving too far, too fast.
This doesn’t mean you should immediately short or panic. But as a trader, I understand that in such a phase, it’s wiser to:
– Partially take profits,
– Move stops closer to the market,
– And absolutely avoid entering new longs on emotions.
Typically, after such surges, the market either consolidates or corrects by 10–20% to shake off the overheating and provide an opportunity to enter at fairer levels. Personally, I’m waiting for a return to balance and a reset. I don’t rule out a final “explosive” move upward on news, but such breakouts usually end as quickly as they begin.
BTCUST trade ideas

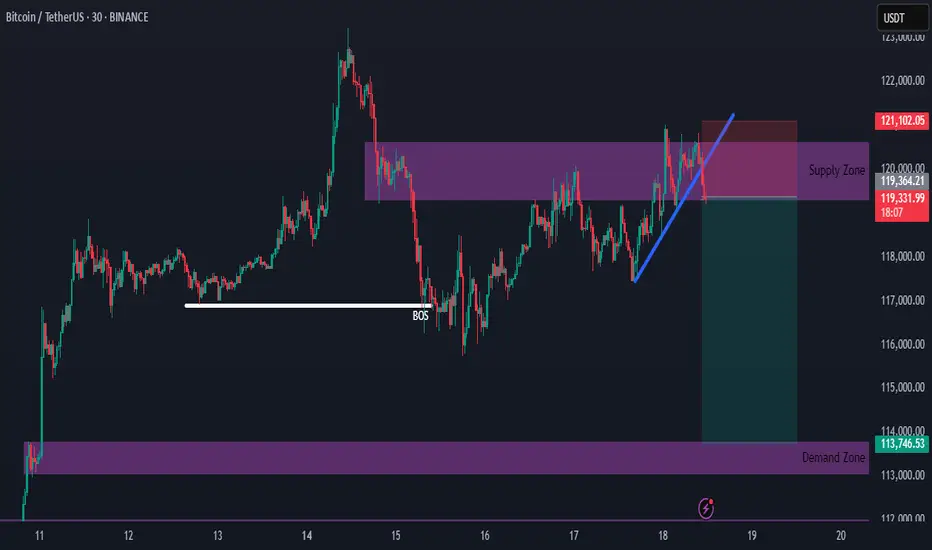
Bitcoin Supply Zone Intact — New Short Setup DevelopingHello everybody!
The supply zone we discussed in the previous idea is still holding.
We have a new opportunity to go short upon the break of the upward trendline.
The most likely target is around 114,000.
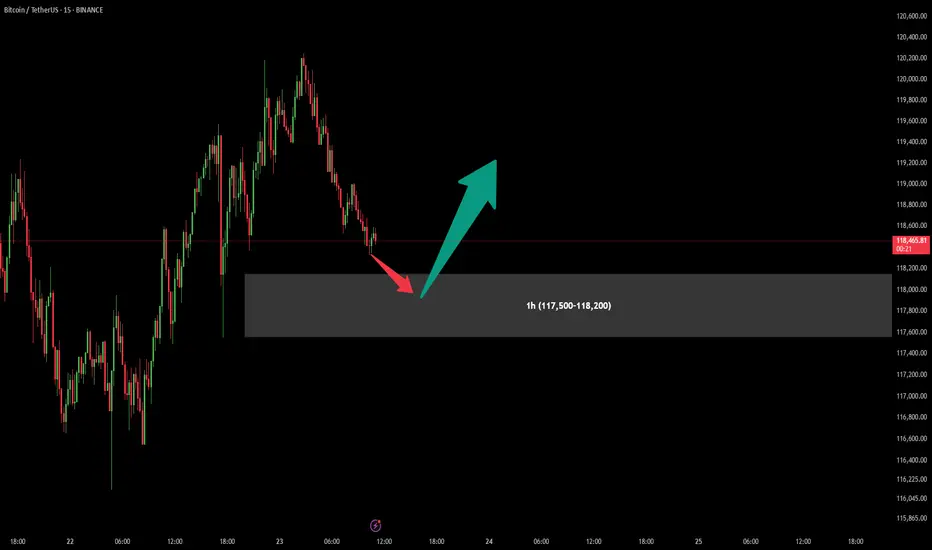
BitCoin BUY OfferAfter previous signal which have given us a good profit (more than 1:10 Risk to Reward), There is another chance for one more Buy position in specified are (117,500-118,200).
Attention : In my chart areas Stop Loss would be under the area (Over the area in Sell positions) and first Take Profit sets for at least R:R = 1:1
Let's see what will happen...
BTC /USDT : Getting support from FVG BTC Support from FVG - Bullish & Bearish Scenarios:
Bullish Scenario:
BTC is holding support from the FVG. As long as BTC stays above this zone, the market remains bullish. A bounce here could lead to further upside.
Bearish Scenario:
If BTC breaks below the FVG, it signals a potential downtrend. A breakdown may lead to more pain and further declines in the market.
Tips:
1. Wait for Confirmation: Look for a clear candle close above/below FVG for validation.
2. Risk Management: Set stops near the FVG to manage potential losses.
3. Monitor Volume: Strong volume during support retests increases bullish potential.
4. Stay Flexible: Be prepared for a market shift if BTC breaks the FVG support.
BTCUSDT It’s coming soon in 2 or 4 weeksRegardless of the positive comments coming from various media and news, the market flow is already moving as it has been set.
After 2 to 4 weeks, a strong and rapid crash comes.
Nasdaq and S&P also fall together.
GOOD LUCK!!
The stock market is highly volatile. Please be very careful with your investments.

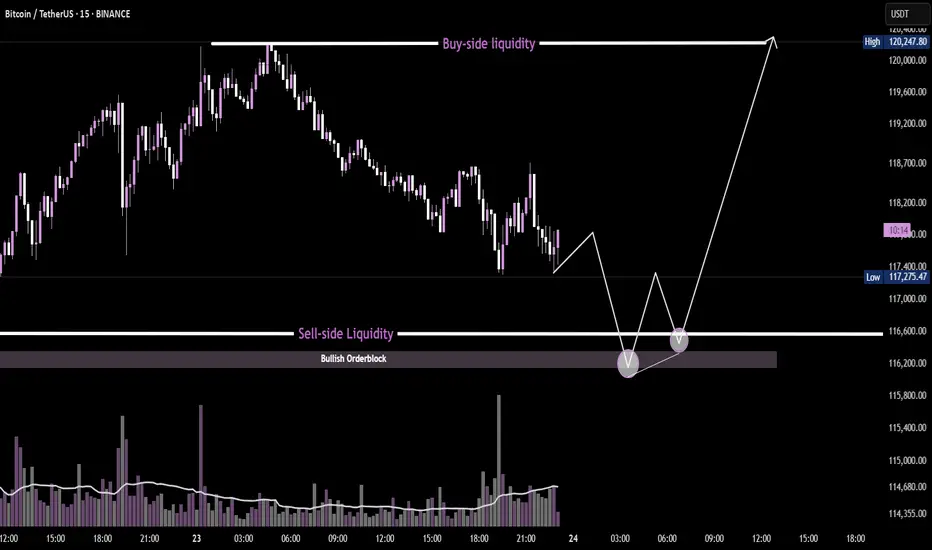
BTC/USDT 15min - Liquidity Sweep + OrderBlockPrice is approaching sell-side liquidity resting below equal lows, aligning with a key bullish order block. A potential W-pattern formation, combined with a volume spike at the sweep zone, suggests smart money accumulation. If confirmed, price may target the buy-side liquidity above, offering a high-probability reversal setup.

Tariffs incoming...July 23: Markets are booming.
August 1st: Tariffs.
I'm just saying, it might be a nice discount...
#market #finance #tariff #trump #crypto #forex #stocks #economy #trading
BTC- New ATH?BTCUSDT – Potential Reversal from CME Gap Support
Bitcoin is currently trading around a key demand zone aligned with a CME gap between ~$115,272 and $114,000. Price recently swept local lows with increased volatility and is showing signs of absorption just above the 0.382 Fibonacci retracement ($113,660), which adds confluence to the area.
If BTC continues to hold above this zone and shows volume confirmation, I expect a strong bullish reaction. This move could initiate a rally toward the previous high and potentially lead to a breakout to new all-time highs (ATH), as outlined in the red projected path.
Key levels- LQ, Fibbo 0.382, CME gap - futures

BTC dropping like a brick....bound to happen sooner or laterHard drops follow big spikes. Happens every time, just look back in time. But this time it's different? Maybe to some extent, but as long as there are short term profit takers and insane volatility this trend will continue. Only 2 cents is to not SHORT SELL. You will only contribute to the potential squeeze and will lose money. If you're up now, your priority should be to retain value and sell before it goes down to it's next support level which is under 100k! Maybe it does or not, but the dips do happen and with automated trading bots it could hit more aggressively and faster. If anything, but the dip when there's sufficient support. Best of luck!


Potential head and shoulders pattern appears on Bitcoin’s globalHey everyone!
I've been on TradingView for a while, but this is my first post — so go easy on me 😄
I'll keep it short and straight to the point.
---
A head and shoulders pattern is forming on the global Bitcoin chart
The pattern is not yet fully formed, and it is difficult to draw any conclusions, but what has already formed may indicate the implementation of this pattern, which we may see in the near future, which means that an upward movement is possible, before the head is formed
Current price: $118k
With this pattern, there is a low probability of a price breakout to $103.4k
The head of the pattern may be at $124k or $129k, provided there is no strong positive news background from the US government regarding Bitcoin
This analysis is based on the technical pattern and also incorporates AI to provide more accurate results.
---
I'd be happy to hear your thoughts, feedback, or any constructive criticism in the comments!
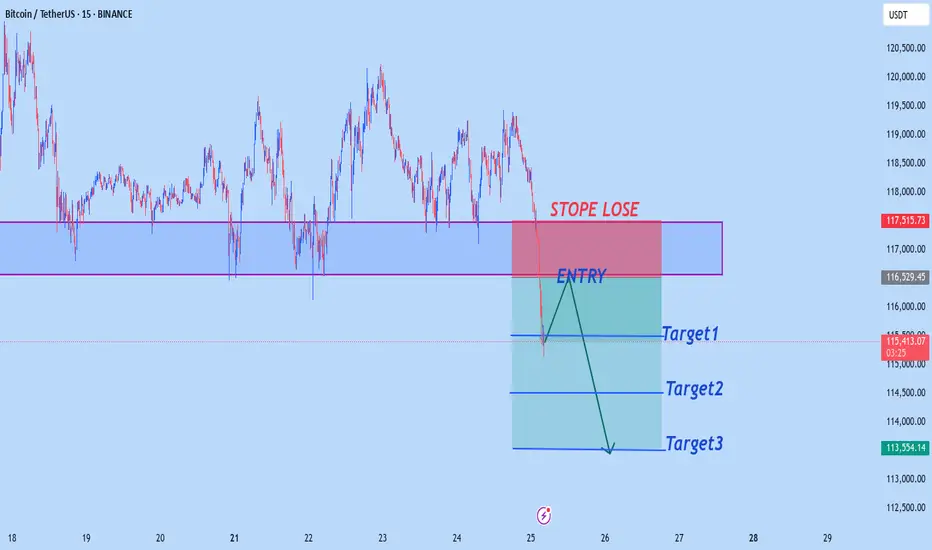
BTCUSD M15 OUTLOOKBtcusd sell from 116,500
target1 115,500
target2 114,500
target3 113,500
Stope Lose 117,500
Trade at your own risk
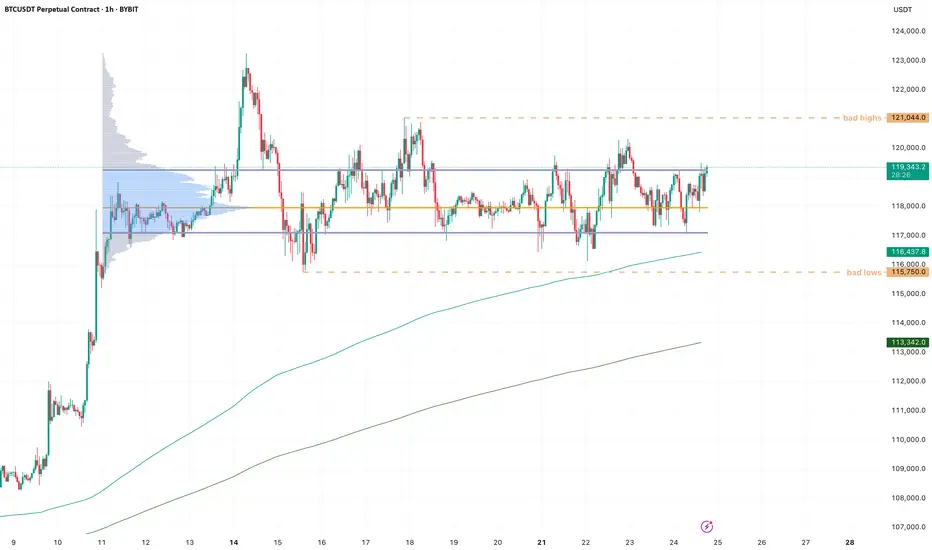
BTC - RotationsStill pingponging between VAL and VAH, so there is not much to update on BTC.
I think patience is key here, most of all don't chase moves but position at the extremes for opposite side, then you are much better placed for continuation moves.
I never try to have much expectations, but there is a smol gut feeling that ETH puts in a new high locally (let's say around 3920-50) while BTC takes out the internal highs at 121k and makes a lower high.
I can be wrong and we simply keep drifting higher, but divergences between ETH and BTC are often worth watching, because the market as a whole usually struggles to maintain strength when alts attract more capital than BTC does (relative to mc).
Is it time for BTC big reverse?According to oscillators and volumes, we can expect BTC to soon undergo a significant correction:
- RSI peaks are declining, forming a divergence. A divergence is also observed on the weekly timeframe.
- MACD also shows a divergence.
- Falling volumes amid rising prices.
Horizontal lines mark two levels with minimum volumes in the profile. Such volume drops usually characterize support levels, which can be used as targets for shorting.

This time it's not different. Still The same macro structure. This time it's not different. we are in the last phase of the bull market cycle.
BTC AI Prediction Dashboard - 6h Price Path (23.07.25)
Prediction made using Crypticorn AI Prediction Dashboard
Link in bio
BTCUSDT Forecast:
Crypticorn AI Prediction Dashboard Projects 6h Price Path (Forward-Only)
Forecast timestamp: ~11:00 UTC
Timeframe: 15m
Prediction horizon: 6 hours
Model output:
Central estimate (blue line): -118,258
Represents the AI’s best estimate of BTC’s near-term price direction.
80% confidence band (light blue): 118,206 – 118,719
The light blue zone marks the 80% confidence range — the most likely area for price to close
40% confidence band (dark blue): 117,712 – 119,423
The dark blue zone shows the narrower 40% confidence range, where price is expected to stay with higher concentration
Volume on signal bar: 133.21
This chart shows a short-term Bitcoin price forecast using AI-generated confidence zones.
Candlesticks reflect actual BTC/USDT price action in 15-minute intervals.
This helps visualize expected volatility and potential price zones in the short term.

[SeoVereign] BITCOIN BULLISH Outlook – July 24, 2025We are the SeoVereign Trading Team.
With sharp insight and precise analysis, we regularly share trading ideas on Bitcoin and other major assets—always guided by structure, sentiment, and momentum.
🔔 Follow us to never miss a market update.
🚀 Boosts provide strong motivation and drive to the SeoVereign team.
--------------------------------------------------------------------------------------------------------
Hello.
This is SeoVereign.
I am still holding the long position that I suggested in the idea posted on July 9th.
Regarding the upward trend that started around 107,200 USDT, I have consistently maintained my position without much doubt until just before posting this idea, as there were no clear signs indicating a decline.
However, at the time of writing this idea, some elements suggesting downward pressure are gradually being detected. Nevertheless, this idea is constructed around the upward scenario. The reason is that, as mentioned in this idea, a ‘single upward move’ is expected to occur with relatively high probability. Whether this rise leads to a trend reversal or serves as a precursor to a downturn will likely depend on how the chart unfolds.
The average TP (target price) is set around 119,300 USDT.
As always, I will carefully observe how the chart develops over time and will update with further explanations that organically integrate the detailed interpretations and grounds of this idea accordingly.
Thank you.

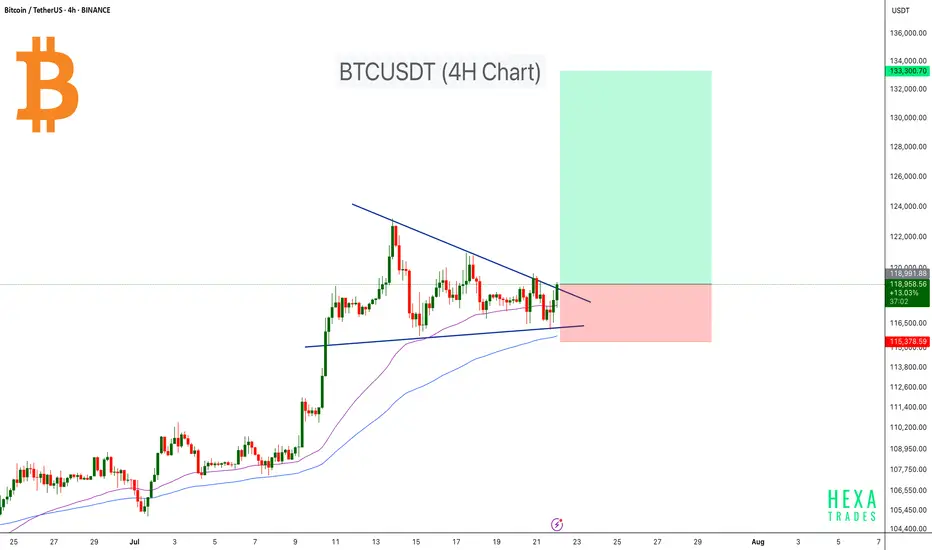
Bitcoin Ready for the Next Leg Higher!Bitcoin is currently consolidating within a symmetrical triangle on the 4-hour timeframe, showing signs of a potential breakout. After a strong rally earlier in July, BTC has entered a compression phase, forming lower highs and higher lows — a classic setup for a volatility breakout.
Price is moving near the apex of the triangle, suggesting that a decisive move is imminent. The 50 EMA and 100 EMA are both acting as dynamic support, helping bulls maintain control of the structure. A breakout above the descending trendline could initiate a sharp move toward the $130K–$133K target zone.
Cheers
Hexa
BINANCE:BTCUSDT
Accumulate BTC over 115K💎 BTC PLAN UPDATE (July 23rd)
NOTABLE NEWS ABOUT BTC
Bitcoin (BTC) and Ripple (XRP) are approaching their all-time highs, while Ethereum (ETH) continues to grow steadily toward the important $4,000 mark. These top three cryptocurrencies by market capitalization are showing signs of a new bullish momentum, supported by strong technical structures and increasing investor interest.
TECHNICAL ANALYSIS PERSPECTIVE
1. Main Trend
The overall trend remains bullish, with a clearly rising price channel (black diagonal line).
However, BTC is currently in a short-term correction phase, consolidating sideways after the recent strong surge.
2. Key Price Levels
🔵 Strong Support Zone: 116,000 – 117,000 USDT
This zone includes the 200-day moving average (MA200), horizontal support, and a previous bottom — making it a decisive area for the short-term trend.
If this zone breaks, BTC could fall to a deeper support area around 111,000 USDT.
🔴 Resistance Zone: 122,000 – 123,000 USDT
This is a previous peak and a recently “false breakout” area — a strong psychological resistance.
If broken convincingly, BTC could surge to the 130,000 USDT zone (Fibonacci extension 1.618).
3. Possible Scenarios
✅ Bullish Scenario:
Price retests the 116,000 – 117,000 support zone and then bounces.
If it breaks through the 122K resistance, the next target is 130,000 USDT.
❌ Bearish Scenario:
If price breaks below MA200 and the 116K support zone → it could drop to the deeper zone around 111,000 USDT.
4. Technical Signals
There is a triangle accumulation pattern (with flat tops and bottoms).
The “false breakout” at the resistance zone shows that buyers are not yet strong enough and a retest of support is needed.
Follow the channel for the latest and continuous updates on XAUUSD, CURRENCIES, and BTC.

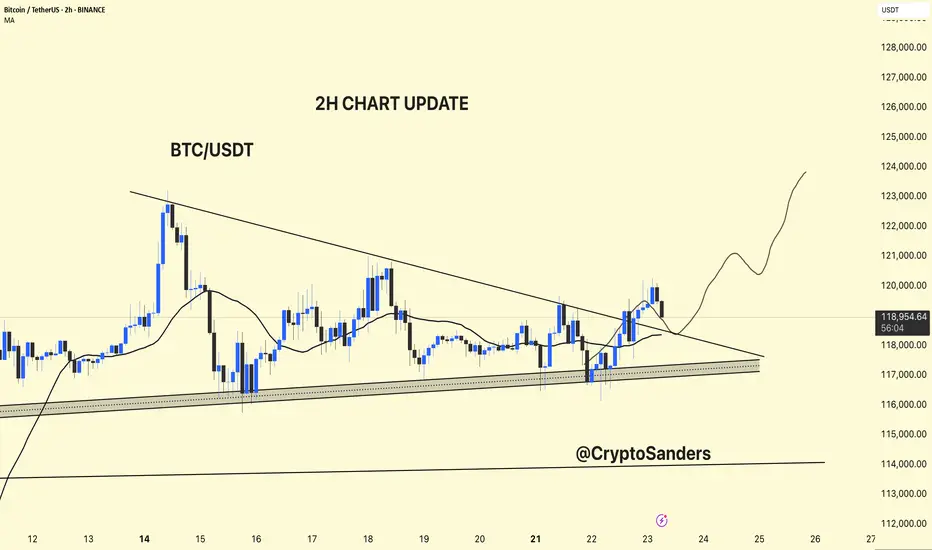
BTC/USDT – 2H Chart Update!!BTC/USDT – 2H Chart Update
Breakout Confirmed:
BTC has broken above the descending trendline but is currently facing resistance at around $ 119,500.
Support Zone:
Strong ascending support between $ 117,000 and $ 118,000 remains intact.
Moving Average:
Price is currently testing the 2H MA (~$118.3). Holding above this could confirm bullish continuation.
Outlook:
If BTC holds above $ 118,000, a move toward $ 123,000–$ 125,000 is likely.
Failure to hold may retest $117K support.
Bias: Short-term bullish unless price breaks below ascending trendline.
Thanks for your support!
DYOR. NFA
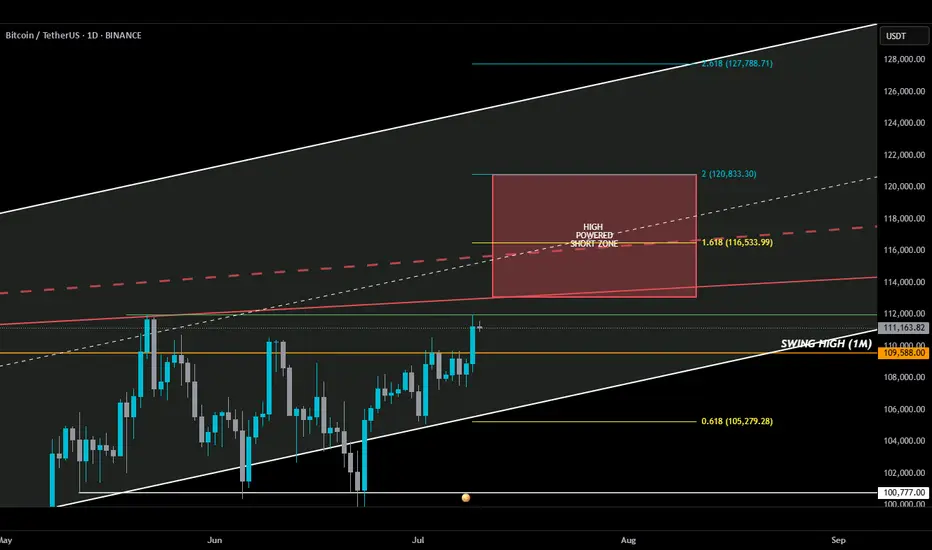
HIGH POWERED SHORT ZONE 2.0HIGH POWERED SHORT ZONE ⚡️
Usually, a 3% move doesn’t make anyone blink—but this one? It sent BTC into all-time high territory. I almost popped the champagne… until I remembered I’m in a short.
Not because I don’t believe in upside—but because my add zone in the HIGH POWERED SHORT ZONE hasn’t been tagged. Yet.
Here’s the breakdown 🧵👇
________________________________________
Before anyone goes bUCK wilD and cracks open that dusty bottle of Veuve, double-check something:
📅 The July 10th daily candle needs to close above the monthly swing high (orange line).
If BTC bulls lock that in, then a move deeper into the HIGH POWERED SHORT ZONE becomes real...
play-the-game real…
________________________________________
Where’s this HIGH POWERED SHORT ZONE coming from?
🔻 Solid red line – a trendline from Dec 2024 that has held strong through three separate tests — marking it as a key line on the sand.
🔻 Dashed red line – goes all the way back to Dec 2017. A seasoned veteran of resistance.
I also drew in a white ascending channel—not just for looks. If BTC breaks out, this channel will help us ask:
“How high is too high?”
________________________________________
Now enters Fibonacci — where nature maps out key alignments on the chart. 🌱
🟡 Gold lines = Fib golden ratios
🔵 Teal lines = Fib Degen Ratios
It’s wild how they just line up:
• 2.618? Right on the top of the channel.
• 1.618? Sitting on the 2017 trendline.
• 0.618? Near current support + bottom of the channel.
Also had to draw that horizontal support white line to keep an eye on.
A Bounce or bust? Ask the bUCKmOON!