BTC NEW VOLUME TREND 122KThis is a small time frame update, where BTC can try to target 22K again in the coming time frames. Since the last 15H breakdown volume, BTC can enter new uptrend volume
From the box level, there is a good chance for a new uptrend.
BTCUST trade ideas

A bearish 12 Month candle could be in the cardsBitcoin made an yearly high of 20% after 6 months in on the yearly candle
This does not make me feel great about the rest of the year
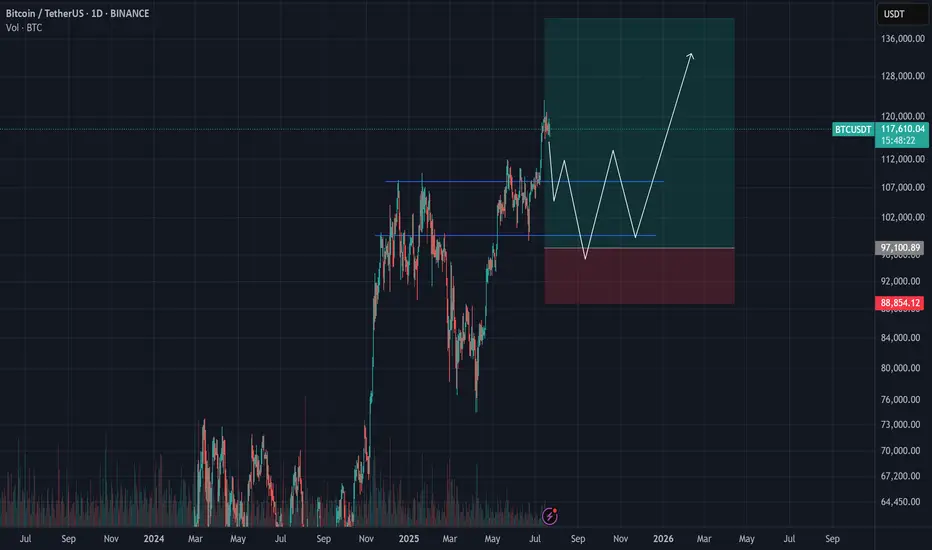
a clear sell signal would be an higher timeframe close under 100k after an upthrust to new ath around 110k - 120k
around 50k-54k for me is an good buy level to build an longterm position:
0.382 fib retracement for an primary 1-2 wave
0.500 fib retracement from the 25k low
0.886 fib retracement from 49k low
50% pullback from current high to projected low
where will bitcoin go ? i don't know, but i do know where i want to buy and when i want to sell

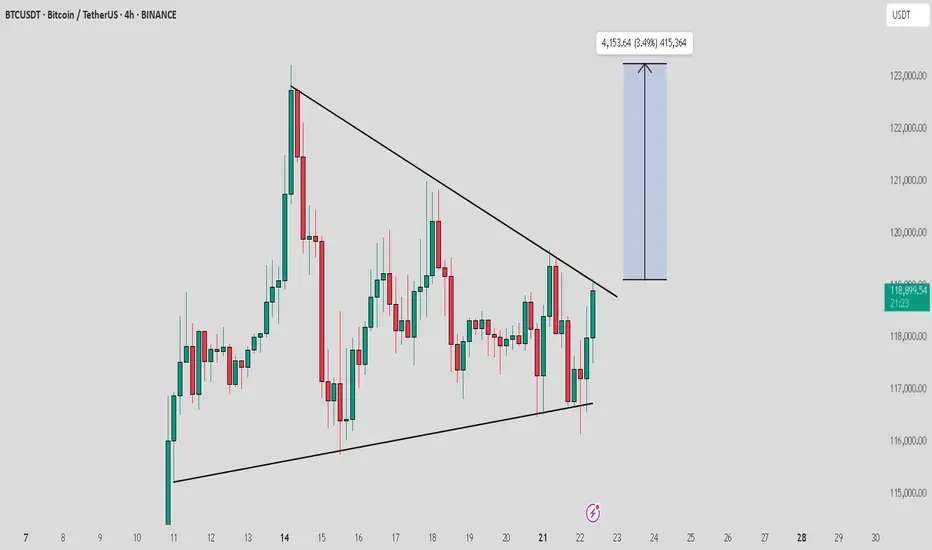
BTC Triangle Consolidation: Ready for TakeoffBTC is gearing up for its next move following a triangle consolidation
BTC Correction in progress - Can it invalidate? BTC downside pattern triggered on 30 min chart. If it can get back above the green line it will invalidate, though right now the red downside path is looking more likely.
BTC - Long SET-UP BINANCE:BTCUSDT
Bitcoin AMC Pattern Forming?
BTC is showing signs of an AMC-style accumulation after a range-bound consolidation. A clean breakout is possible if price respects the 113k–113.8k support zone — potential entry zone for smart money 📈
Alternatively, deeper liquidity may be tapped at the 110k–112k OB zone, offering another high-probability buy setup🔁
Watch for signs of bullish intent in these key zones — price structure suggests upside potential once liquidity is swept✅

BTC possible failed range breakout - Aggressive Move The BTC ATH rally began post cash close and had very thin volume on the break out before setting this range on the higher time frames. Normally, a range after ATHs are made I would be extremely bullish and I am.
Aside from the failed breakouts at the highs, the attempts paired with nuances such as the crypto week impulses, the day of signing GENIUS and new regulatory acts being drafted now, the attempts to break those ATHs were nudged off.
Sometimes come failed moves come fast moves, and so I have to be prepared that BTC will trade between these thin areas on the volume profile from 111k to 115k. 113k being the most noticeable node in the entire profile.
Similar to my analysis on the break to ATHs, I would expect this move to be aggressive and remind us of a 2020 cycle style flush in Altcoins. Kind of already seeing it with the performance of alts today preempting the failed move up on BTC at range highs.
I will NOT be shorting anything in crypto, these are just areas that I am heavily interested in buying. Currently flat perps and will wait for BTC to make its mind up.
Entering Green Markets or Getting Close to Liquidation?They told you it’s a green market, time to buy... but something’s off.
Most major losses begin with a green candle, not a red one!
Before jumping in, ask yourself: why does everything suddenly look so clear?
Hello✌
Spend 3 minutes ⏰ reading this educational material.
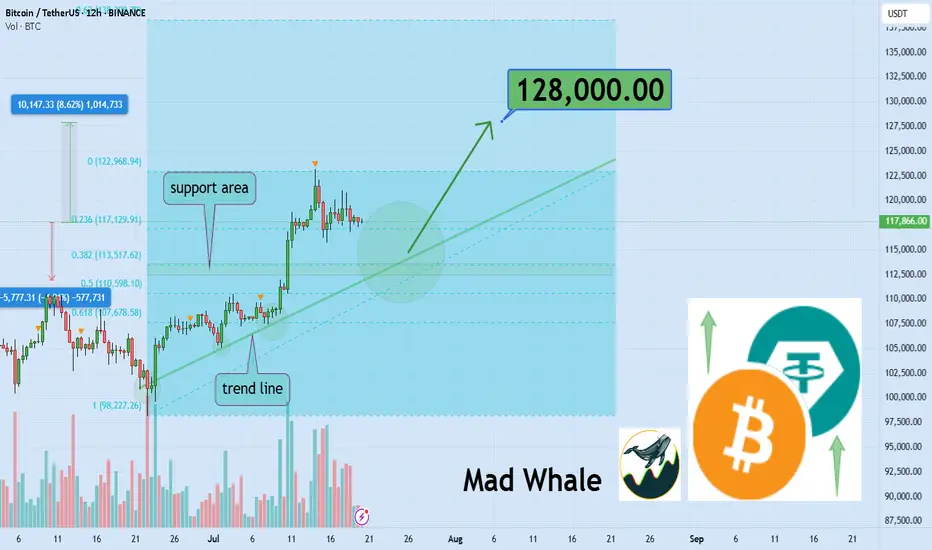
🎯 Analytical Insight on Bitcoin:
Strong volume confirming daily trendline and Fibonacci support signals a potential 8% upside, with a key target near $128,000 📈. This confluence could offer a solid entry opportunity for BINANCE:BTCUSDT traders 🧭.
Now , let's dive into the educational section,
📉 Green Doesn’t Always Mean Safe
Many traders jump into green candles, feeling they’re missing out. But most pumps end where excitement begins. The market isn’t always bullish it’s often just using collective emotion against you.
🧠 They’re Targeting Your Mind, Not Just Your Capital
Whales don’t need your money they need your mind first. The moment you think you're "too late" and must enter now, is often when they’re selling.
💡 You’re Fueling Their Profits, Not Your Trade
Those who bought early are waiting for someone like you. If you enter now, you're not beating the market you’re just helping others close in profit.
🔍 Why Most Liquidations Happen After Green Moves
Contrary to belief, major liquidations often come after green runs. That’s when confidence is high, stops are forgotten, and greed kicks in perfect timing for a rug-pull.
📊 History Doesn’t Repeat It Rhymes (Loudly)
Go back and look at Bitcoin’s chart since 2017. Nearly every major drop followed a smooth-looking pump. It’s not a warning. It’s a recurring pattern.
🎯 Hidden TradingView Tools for Spotting Green Traps
The market looks bullish. But the truth is, many pumps are just emotional traps built to bait late entries. TradingView has tools that, if used right, help you spot these traps before you step into them:
✅ Volume Profile (Fixed Range):
Use this to identify where the most trading volume occurred. If price rises on weak volume, be suspicious. It could be a fakeout or engineered pump by whales.
✅ RSI + Manual Divergence Drawing:
RSI seems simple, but traps often hide when RSI climbs while price action lags. TradingView allows manual drawing spot bearish divergence before the fall.
✅ On-Balance Volume (OBV):
If price is rising and OBV is flat or falling, warning lights should flash. A rally without money inflow is often a visual illusion.
✅ Session Volume HD (from Public Library):
See when most liquidity enters. Many fake bullish moves happen during the Asia session when volume is low and price is easier to manipulate.
✅ Multi-Timeframe Analysis:
If you're looking at the 15-min chart while the 4-hour sits in resistance, you may just be playing into a bull trap. Cross-reference your timeframes.
🧭 How to Avoid the Green Traps
Watch volume, not just candle color
Wait for level confirmations, not hype
Use TradingView’s combo indicators
Always ask: who profits if I enter right now?
✅ Final Thoughts
Not every green candle is hope sometimes it’s bait. The market is after your emotions, not your charts. Step back, zoom out, and use the right tools before you act.
✨ Need a little love!
We pour love into every post your support keeps us inspired! 💛 Don’t be shy, we’d love to hear from you on comments. Big thanks , Mad Whale 🐋
📜Please make sure to do your own research before investing, and review the disclaimer provided at the end of each post.
BTC correction august/septemberBTC has reached overbought territory, there is also bearisch divergence. It also didnt go above 123k anymore. i expect a correction in august/september.
dont chase FOMO, be prepared. Nothing goes in a straight line. there are always corrections.
CRYPTO:BTCUSD BINANCE:BTCUSD CME:BTC1! BINANCE:BTCUSDU2025

My thoughts on Bitcoin.. ABC -> 129K Top?I think we correct down to 112K area to fill the FVG and CME then we Turn up, topping at 129K and then the rest of the Alts blow off top from there..
Thoughts?

Bitcoin Wave Analysis – 22 July 2025
- Bitcoin reversed from support level 116065.00
- Likely to rise to resistance level 122775.00
Bitcoin cryptocurrency recently reversed up from the key support level 116065.00, which also stopped the earlier minor correction 2 at the start of June.
The support level 116065.00 was further strengthened by the support trendline of the daily up channel from June and the 38.2% Fibonacci correction of the upward impulse from July.
Given the strong daily uptrend, Bitcoin cryptocurrency can be expected to rise further to the next resistance level 122775.00 (which stopped the previous impulse wave 1).

$BTC Macro UpdateBitcoin Macro Outlook BINANCE:BTCUSDT.P
Weekly
Bias & momentum remain bullish. Price is pressing toward new ATHs despite last week’s pullback.
Next macro target: ~$133,550 (extension of the current DeCode V-Range: 111,959.5 – 77,111.0).
A weekly close back inside that range (<111,968.0) = Failed Auction → serious red flag for reversal.
Daily
Clean rejection off the 21-Day Rolling VWAP + bounce at the structural HL V-Level (116,862.4).
A strong bullish engulfing today would set the tone for follow-through this week.
10-Hour
Structure is still bullish. Multiple Failed Auctions from ~116,960.0 are driving price toward the ATH.
Intraday
Choppy and hugging range lows → harder read. That behavior near balance edges triggers AMT Rule #5: “If time/volume builds at the edge of balance, price is likely to push through.”
Auction Market Theory – Quick Reminders
Price : advertises opportunity
Time : regulates opportunity
Volume : tells you if the auction is succeeding or failing
Rule #5 (above) is in play right now. Stay patient, wait for confirmation, and don’t FOMO.

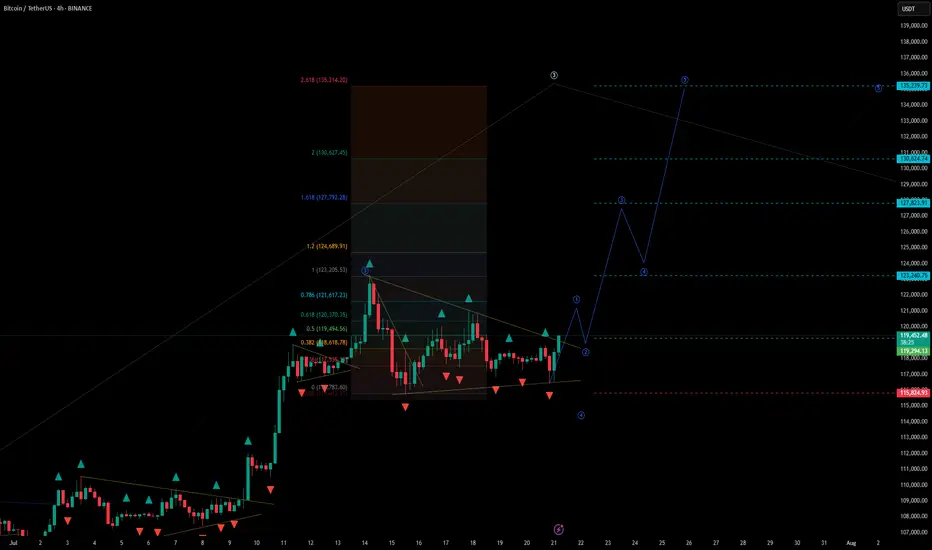
BTCUSDT - UniverseMetta - Signal#BTCUSDT - UniverseMetta - Signal
H4 - Formation of a triangular formation in continuation of the trend, for a more confident entry you can wait for a retest and formation of the 3rd wave. Stop behind the minimum of the 1st wave.
Entry: 119294.13
TP: 123240.75 - 127823.91 - 130624.74 - 135239.73
Stop: 115824.93
targetRemember, day trading is risky and most traders lose money. You should never trade with money you can’t afford to lose. Prove profitability in a simulator before trading with real money.
❗❗My results are not typical. We do not track the typical results of past or current customers. As a provider of trading tools and educational courses, we do not have access to the personal trading accounts or brokerage statements of our customers. As a result, we have no reason to believe our customers perform better or

HolderStat┆BTCUSD consolidatedBINANCE:BTCUSDT is consolidating between $129K and $137K. Breakout above $137K could lead to new highs. Key support remains at $125K.

Guys. Thoughts?Just having a conversation with a trading jedi master and then they taught them to set a buy stop with heavy risk above the lower high at the top of the market cycle in the sell side of a previously resolved block after exceeding the statistical high of the dealers range for the day. Just for some more insight, this all happened while venus was in retrograde. Hopefully that paints a clear enough picture. Don't hesitate to ask questions.
Signing off, yours faithfully,
ChartCharmer.

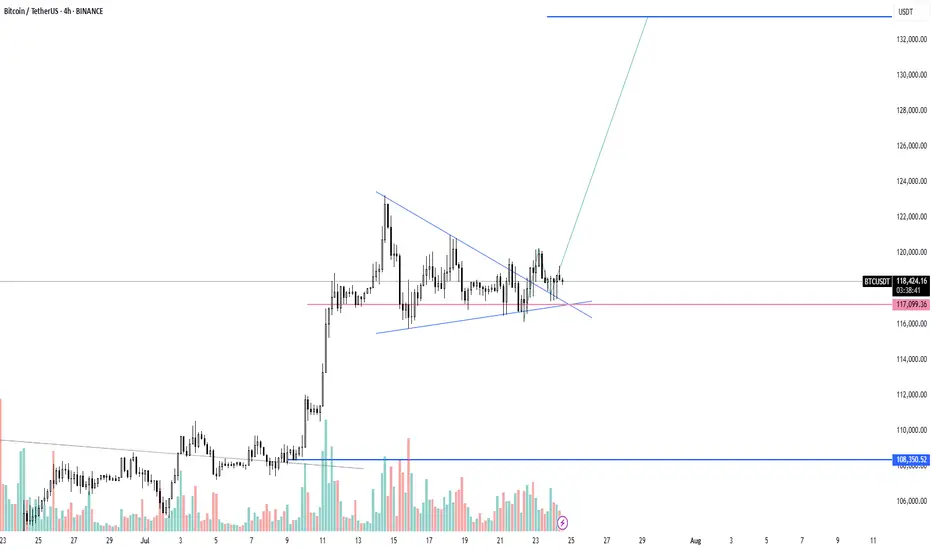
BTC - LTF Breakout? Here is an update to our last post:
After monitoring for a breakout we are seeing early signs of just that.
We saw a rejection from yesterday's test but this morning have broken above our white dotted line with the first breakout candle. Now with this 4H candle we could be seeing the confirmation breakout. After wicking down the bulls have pushed price back up where the candle is holding support above the white dotted trendline.
Technically this current 4H candle would be considered a bearish candle, but due to the circumstances it could easily be negated.
If price does fall in the next 4H period and we do not see another close above the white dotted line, then this would be considered a fakeout and we would most likely see much lower prices. However, what we want to see is price push above this current candles 4H high which would negate the bearish candle and most likely start the rally towards our yellow line target.

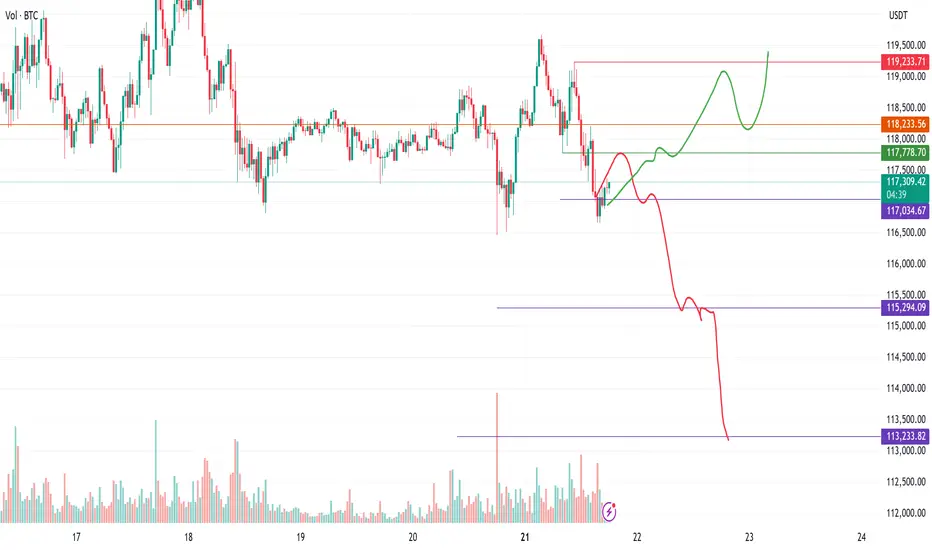
Trading plan for BitcoinLast week, Bitcoin established a new ATH at $123k before entering a corrective phase. The price action has since developed into a clear consolidation pattern and currently trades below the weekly pivot point.
Key Observations:
Proximity to last week's low increases probability of a full ABC correction targeting $113k
Break above noted resistance could invalidate bearish scenario and suggest ATH retest
Critical Levels:
Resistance: $119,500
Support: $113,000 (ABC target)
Trade the range until the market declares its next direction.

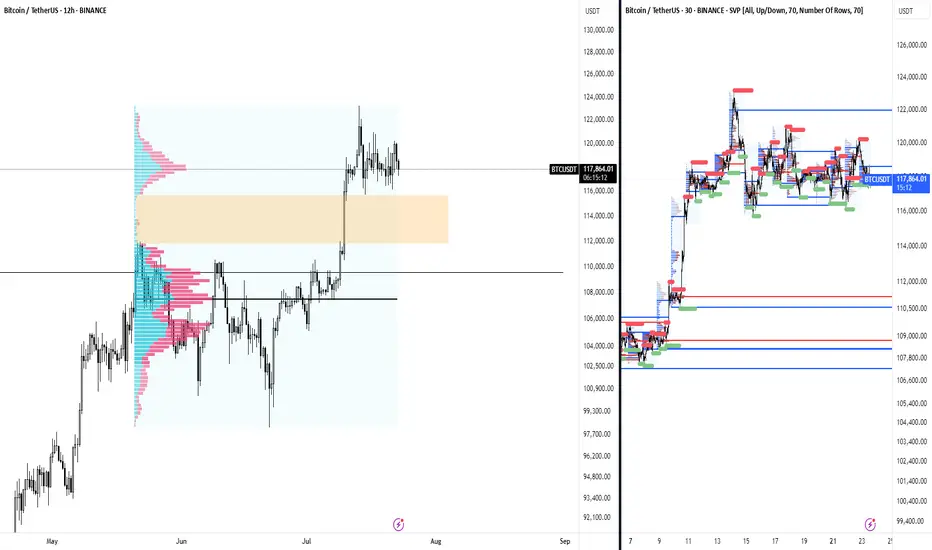
BTC - Sideways forever?!Compressing really hard here on BTC, look at:
- volume range becoming very concentrated, clean pingpong between VAL and VAH
- H4 trend compressing to almost a single point
- you can see from the purple lines that only internal liquidity is being taken on both sides
imo this sets us up for a potential fake out setup. There is so much liquidity on both sides in this small range, that on a very clean sfp of one side, the other side would have to rush out which pushes price quickly to the other side. We saw a little bit of that already with the sweep during the asia session today.
Of course the sfp needs to be valid, wait for a reclaim setup, there is always the chance the breakout/breakdown is valid, you don't want to be on the wrong side of that either.
BTC/USDT Analysis: Rotation Continues
Hello everyone! This is a daily analysis from a trader-analyst at CryptoRobotics.
Yesterday, Bitcoin continued to rotate within a narrow sideways range, and so far, there has been no breakout. We retested the lower boundary of the range and once again saw absorption of market selling at that level.
At the moment, the scenario remains valid — we expect a breakout to the upside. Several factors support this outlook: strong defense at the lows, delta absorption across the entire range, and buyer control on the most recent local upward wave.
A less likely scenario is a dip into the lower buy zone, a liquidity grab, and another attempt to move higher.
Buy Zones:
~$115,000 (zone of initiating/pushing volumes)
$110,000–$107,000 (accumulated volumes)
This publication is not financial advice.
BTC / USDT near to breakout from trendline resistanceBTC is testing its trendline resistance after a steady buildup. A successful breakout could trigger a strong move toward the $122,000–$125,000 range. Worth watching closely in the coming sessions.
Bitcoin support and resistance areas to observeI've identified some very clear support and resistance areas that could provide some gains on the daily chart.
If it breaks the upward resistance line then the next stop could be all time high resistance.
If it breaks the downward support line then the next stop could be $111,600 area.
One to watch over the next few days to see if it respects those lines.

Crypto Market: What You MUST Know Today!⚠️ Crypto Market: What You MUST Know Today!
📌 Risk Management is 🔑
As we said yesterday, in a market like this, risk management, break-even planning, and timely profit-taking are essential. Every position should come with a clear and structured plan.
📰 Major Fundamental Updates
🔻 Bitcoin has dropped below $117,000 today.
👉 Main reason: Profit-taking after recent gains.
💸 Over $131 million has been withdrawn from Bitcoin ETFs in recent days, adding selling pressure to the market.
🎤 Jerome Powell is scheduled to speak today. The market is nervous he might hint that interest rates will stay high. Investors are on hold.
⚖️ Key crypto regulation bills in the US are facing setbacks. Legal uncertainty is keeping investors cautious.
💰 Capital is rotating from BTC into altcoins. Solana is up 🚀, while Ethereum and Ripple are slightly down.
📉 Technical indicators like RSI and MACD show overbought conditions. The market is correcting now, and the uptrend is weakening.
🏛️ A crypto policy report from the White House is expected today. Many are waiting for clarity before taking big steps.
📊 US inflation remains high → The Fed is unlikely to cut rates soon. Crypto markets need looser monetary policy to thrive.
💥 A large number of leveraged long positions are concentrated around $115,000. If BTC falls further, liquidations may cause additional selling pressure.
♦️ BTC Technical View
The weekly chart shows both buying and selling pressure.
Strong buy wicks indicate active buyers around the $114K–$116K zone.
If price breaks below this level sharply, expect a deeper drop.
If the price approaches this zone slowly, buyers (both takers and makers) may step in to defend it — potentially triggering the next leg up.
⚠️ Important Note
❌ No short positions in our strategy.
Even if price drops, our plan is: “No problem, we missed it 😄”
Our approach = No shorting at these levels. Stay disciplined. 💪
♦️ BTC Dominance (BTC.D)
📉 After a sharp drop, a bounce to 62.15–63.63 is possible.
Once this correction completes, we’ll watch for altcoins that are still ranging and getting ready to break out.
📈 If BTC starts printing green candles with rising volume:
➡️ Focus on altcoins in your watchlist near breakout levels.
📌 Two Main Scenarios:
• ✅ BTC breaks $120K and dominance drops → Early signs of altseason
• ❌ BTC drops and dominance rises → Altcoins likely to drop further
♦️ USDT Dominance (USDT.D)
🔁 Yesterday’s session didn’t break above 4.14 → No bullish confirmation for BTC or alts yet.
📈 If 4.26 breaks upward → Expect more correction across the market.
📉 If 4.14 breaks downward → We may stay in our positions with more confidence.
✅ What to Watch For Today
📊 Jerome Powell’s speech
📰 White House crypto policy report
📉 USDT.D movement at 4.14 / 4.26
🔍 BTC price action near the $114K–$116K zone
🚀 Altcoins approaching breakout levels
🚀 If you found this helpful:
👉 Tap the rocket to support
🔔 Follow for clear, no-hype market updates
💬 Drop your thoughts in the comments!

Bitcoin (BTC) Analysis – July 21, 2025We’ve previously discussed the significance of the $110,000 level — a zone where long-term holders typically take partial profits.
After multiple pullbacks from that region, a new wave of short-term investors stepped in around $97,000, managing to push the price as high as $123,000.
⚠️ I know many traders are tracking Bitcoin dominance and expecting a correction from this zone — and I partly agree.
However, issuing a sell signal here feels premature and potentially risky.
✅ Instead, I’d suggest looking for a re-entry opportunity around $95,000, where market structure and buyer activity may offer a much better risk-reward ratio.