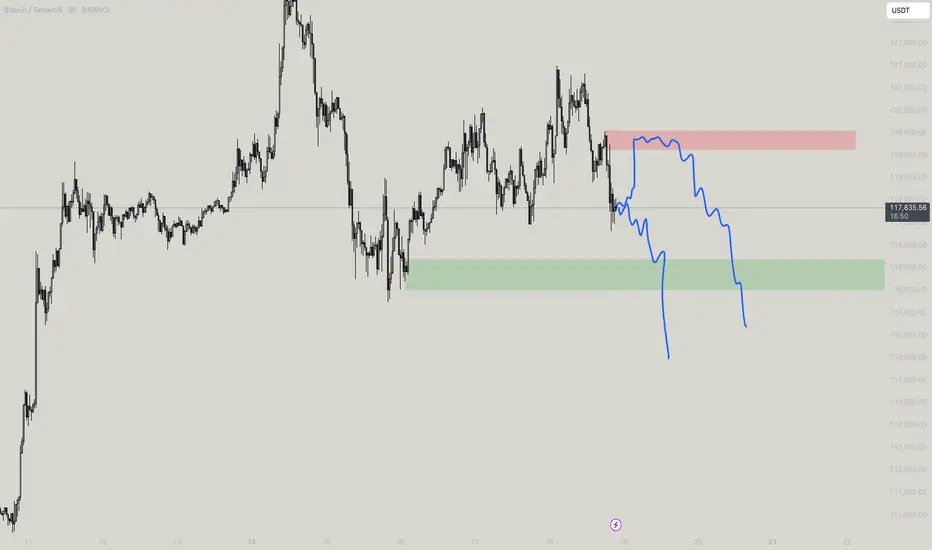
BTC Pullback Near 200 EMA – Bounce or Breakdown?Bitcoin is currently undergoing a measured pullback after its recent push toward $121K. On the 1H timeframe, price has tested the 200 EMA and held so far, forming a short-term support near $117K. This aligns with a prior consolidation area and is showing some early signs of bottoming.
On the 4H chart, price is also consolidating after a healthy run-up. While momentum has cooled, BTC remains above key moving averages. RSI is approaching mid-range levels (~48), and the QQE is lightly bearish but not aggressive.
Key Zones to Watch:
Support (1H + 4H confluence):
🔹 $117,000 – $117,300 (EMA 200 + historical pivot + bounce region)
Resistance/Breakout Target:
🔹 $118,500 – $119,500 → Area where shorter EMAs are clustered
🔹 $121,000 → Previous local high
Take Profit (if bounce plays out):
🔹 TP1: $119,200
🔹 TP2: $120,800
🔹 TP3: $122,800
Scenarios:
Bullish Bias (if price reclaims $118.5K+):
Reclaiming EMAs and printing higher lows would suggest continuation.
RSI crossing 50 and increasing volume would confirm short-term bullish momentum.
Bearish Bias (if $117K breaks):
Breakdown from this base could send BTC to test $116K or even back to $114.5K range.
Look for volume spike + MACD/QQE confirmation for further downside.
Summary:
BTC remains in a constructive uptrend on higher timeframes. The current pullback is still within normal range, especially while price respects the 200 EMA on both 1H and 4H charts. This is a key decision zone—bulls want to see a reclaim of $118.5K, while bears need to break below $117K to take control.
BTCUST trade ideas

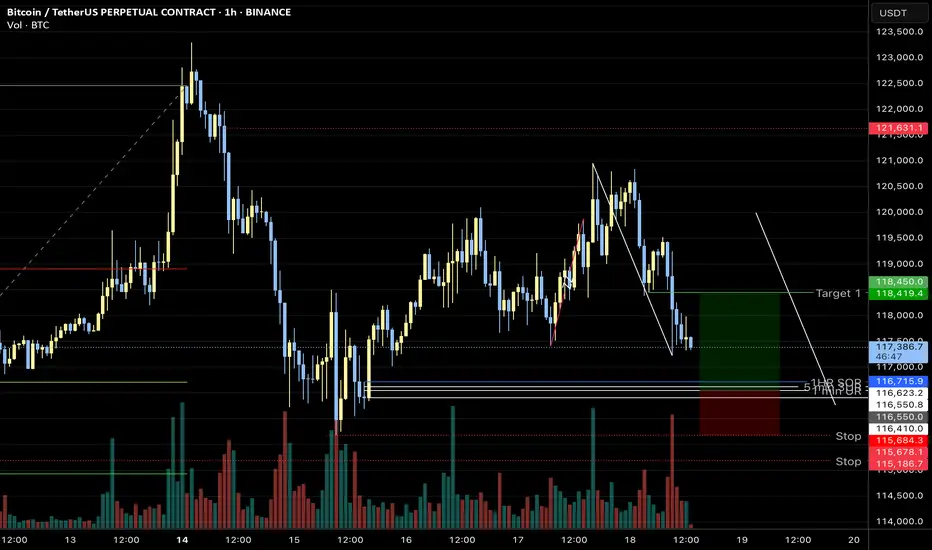
BTC/USDT (1H) Market Analysis – July 19
BTC is hovering just below the 200 EMA, having recently bounced off it with a small recovery candle.
The recent downtrend from the $121K peak has flattened, and price is forming a potential short-term base above the $117K support.
There's low-volume chop, suggesting indecision or a pause before the next leg.
Key Technical Levels
Support zone: $117,200 – $117,500 (200 EMA + recent wick support)
Resistance zone: $118,500 – $119,000 (cluster of short EMAs + prior supply)
Breakout level: $119,500 (for a bullish continuation)
Breakdown level: $116,800 (for further downside)
Indicator Insights
RSI: 42.86 and curling up slightly → shows a potential recovery attempt but still below neutral.
QQE MOD: Deep in bearish territory (–8.53), but we’re seeing the first signs of easing negative momentum.
ATR: 681 and gradually falling → declining volatility, aligning with consolidation.
Bias & Scenarios
Bullish Case:
If BTC holds above the 200 EMA and breaks above $118.5K with volume, we could see a retest of the $119.5K–$120K zone.
RSI breaking 50 and QQE printing lighter red would confirm upward momentum.
Bearish Case:
Failure to reclaim EMAs and a drop below $117K could send price toward $116K or even back to the breakout base at $114.5K.
Watch for volume spikes on red candles and RSI breaking back under 40.

Sell and wait because of the 100days growth rule 100 days for ETH BTC and most. Some more days for doge maybe and solana. Then i may buy back if it is a quick drop.

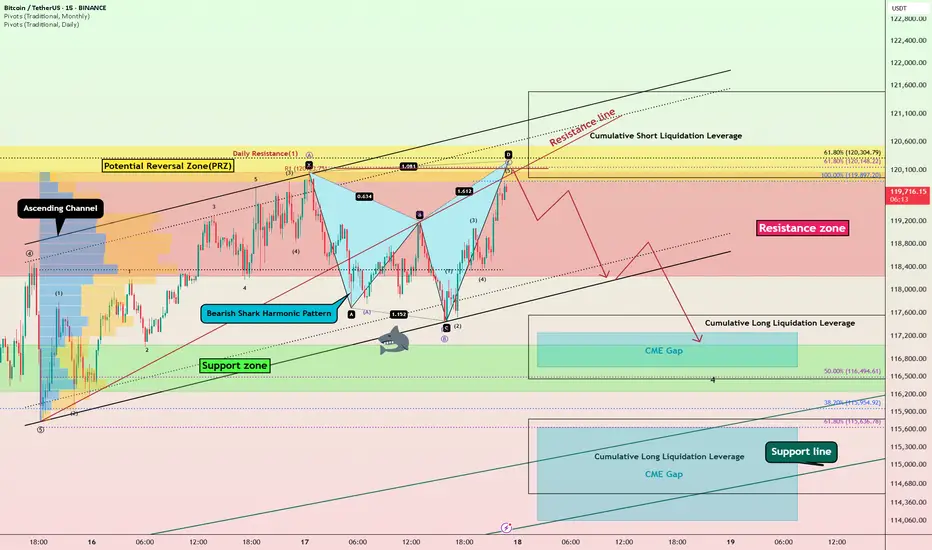
Bitcoin Bearish Shark Detected – CME Gap Below $115K in Sight?Today's analysis is on the 15-minute timeframe , following the previous analysis I shared with you on the 1-hour timeframe .
Bitcoin ( BINANCE:BTCUSDT ) is currently trading in the Resistance zone($120,100-$118,240) near the Potential Reversal Zone(PRZ) and Cumulative Short Liquidation Leverage($121,490-$119,965) .
From a technical perspective , it looks like Bitcoin is completing the Bearish Shark Harmonic Pattern on the 15-minute timeframe .
From an Elliott wave theory perspective, it looks like Bitcoin is completing the microwave 5 of wave C of the Zigzag Correction(ABC/5-3-5) .
I expect Bitcoin to start falling from the top of the ascending channel and at least decline to the lower line of the descending channel, and if the ascending channel breaks this time, we should wait for the CME Gap($117,255-$116,675)/CME Gap($115,060-$114,947) to fill.
Cumulative Long Liquidation Leverage: $117,556-$116,465
Cumulative Long Liquidation Leverage: $115,773-$114,513
Do you think Bitcoin can create a new ATH again?
Note: Stop Loss(SL)= $121,620
Please respect each other's ideas and express them politely if you agree or disagree.
Bitcoin Analyze (BTCUSDT), 15-minute time frame.
Be sure to follow the updated ideas.
Do not forget to put a Stop loss for your positions (For every position you want to open).
Please follow your strategy and updates; this is just my Idea, and I will gladly see your ideas in this post.
Please do not forget the ✅' like '✅ button 🙏😊 & Share it with your friends; thanks, and Trade safe.
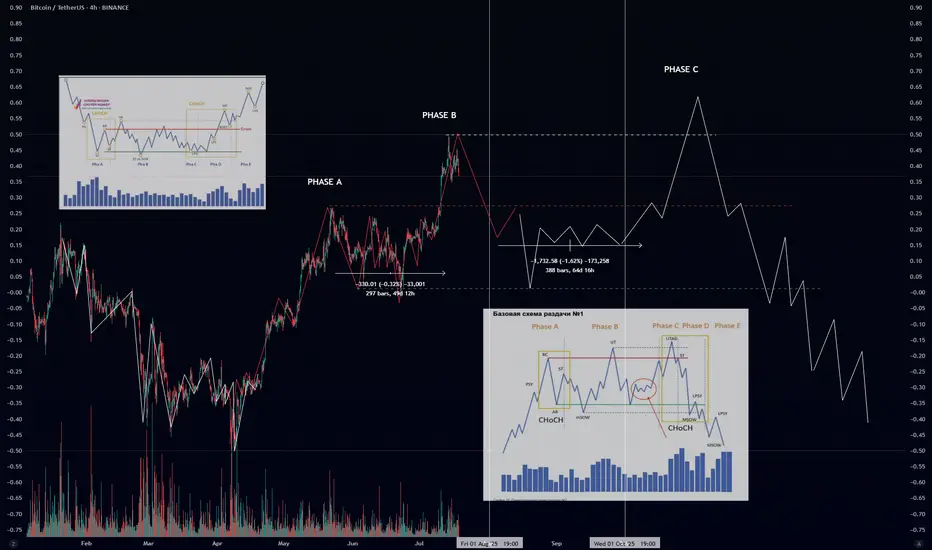
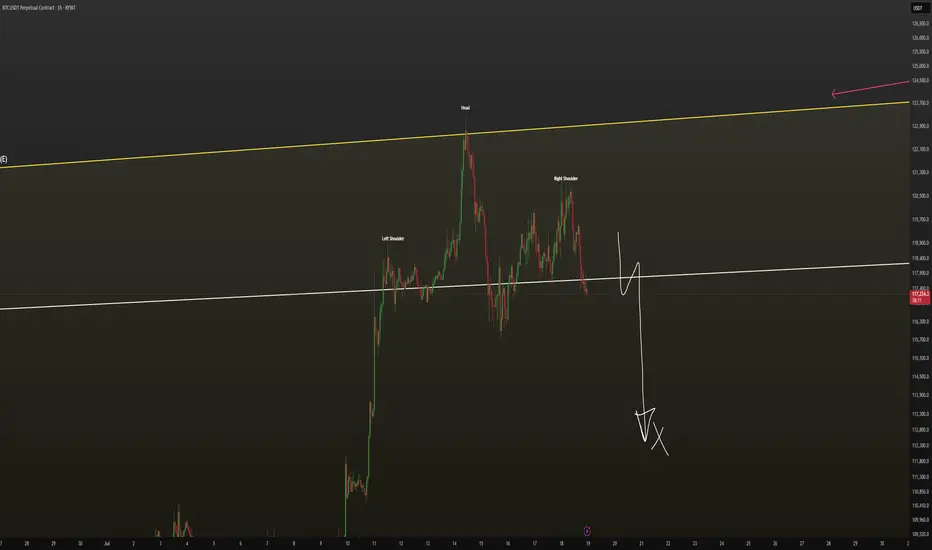
Wyckoff Distribution Schematic #1 – ExplainedIf you’ve ever wondered how smart money offloads their positions before a major downtrend — this is it. The Wyckoff Distribution Schematic #1 is the mirror opposite of accumulation. It reveals how institutions distribute (sell) to retail before the market collapses.
🔍 Phases Breakdown:
🟠 Phase A – Preliminary Supply & Buying Climax
PSY (Preliminary Supply): First signs of selling pressure.
BC (Buying Climax): Sudden surge in price with high volume – often traps late buyers.
AR (Automatic Reaction): Price drops as buyers lose momentum.
ST (Secondary Test): Retest of the top – often with lower volume.
🔄 CHoCH (Change of Character): Early warning sign that supply is increasing.
🟡 Phase B – Building the Cause
Sideways price action where large players distribute their holdings.
UT (Upthrust): Fake breakout above resistance.
mSOW (Minor Sign of Weakness): Slight breakdowns showing cracks in structure.
🔴 Phase C – The Trap
UTAD (Upthrust After Distribution): Final fakeout to trap bulls before the real drop.
Market often shows strength… right before the collapse.
Another CHoCH confirms the shift toward bearish control.
🔵 Phase D – Breakdown Begins
LPSY (Last Point of Supply): Final bounces with weak demand.
MSOW (Major Sign of Weakness): Strong breakdown on high volume — momentum shifts decisively.
⚫ Phase E – Downtrend
Distribution complete.
Price trends downward with weak rallies.
Retaiя is left holding the bag.
📊 Volume matters: look for volume spikes on upthrusts and breakdowns, and declining volume on bounces.
🔁 Compare with Accumulation:
Accumulation ends in Spring → Uptrend 📈
Distribution ends in UTAD → Downtrend 📉
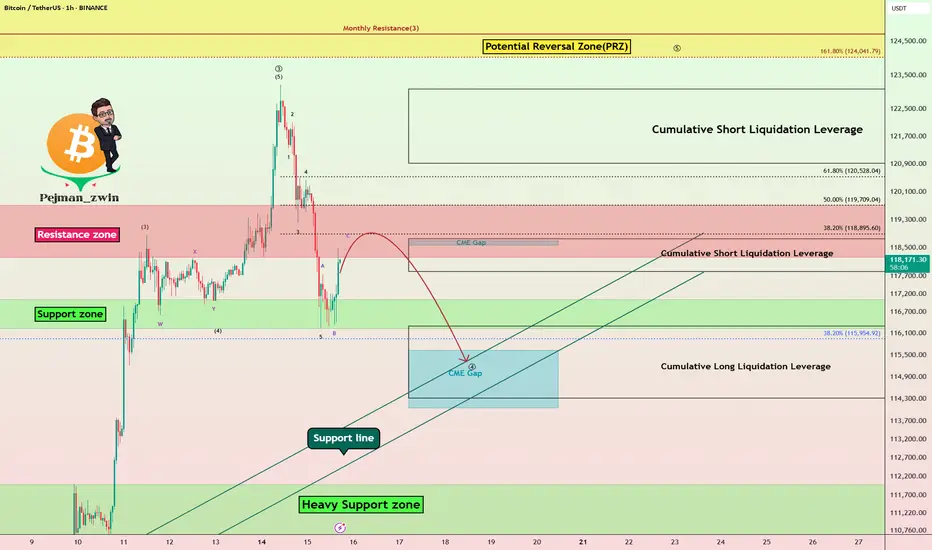
Bitcoin Struggles Below $120K:Will the CME Gap Pull Price Lower?Bitcoin ( BINANCE:BTCUSDT ) has been experiencing a high momentum bullish trend in recent days, which few people expected, especially when it crossed $120,000 . However, in the past 24 hours , Bitcoin has fallen back below $120,000 .
Bitcoin is currently trading in the Resistance zone($119,720-$118,240) and Cumulative Short Liquidation Leverage($118,757-$117,829) on the 1-hour time frame .
In terms of Elliott Wave theory , Bitcoin appears to be completing a main wave 4 . Main wave 4 is likely to have a Zigzag Correction(ABC/5-3-5) .
I expect Bitcoin to attack the Support lines and fill the CME Gap($115,060-$114,947) in the next hour.
Cumulative Short Liquidation Leverage: $123,087-$120,922
Cumulative Long Liquidation Leverage: $116,305-$114,325
Do you think Bitcoin can create a new ATH again?
Note: Stop Loss(SL)= $121,000
Please respect each other's ideas and express them politely if you agree or disagree.
Bitcoin Analyze (BTCUSDT), 1-hour time frame.
Be sure to follow the updated ideas.
Do not forget to put a Stop loss for your positions (For every position you want to open).
Please follow your strategy and updates; this is just my Idea, and I will gladly see your ideas in this post.
Please do not forget the ✅' like '✅ button 🙏😊 & Share it with your friends; thanks, and Trade safe.
BTC - local situation (1h) SHORT🔻 Breaking down from a bearish pattern.
I expect a local decline to $114,000 - $112,000 on the 1h timeframe.
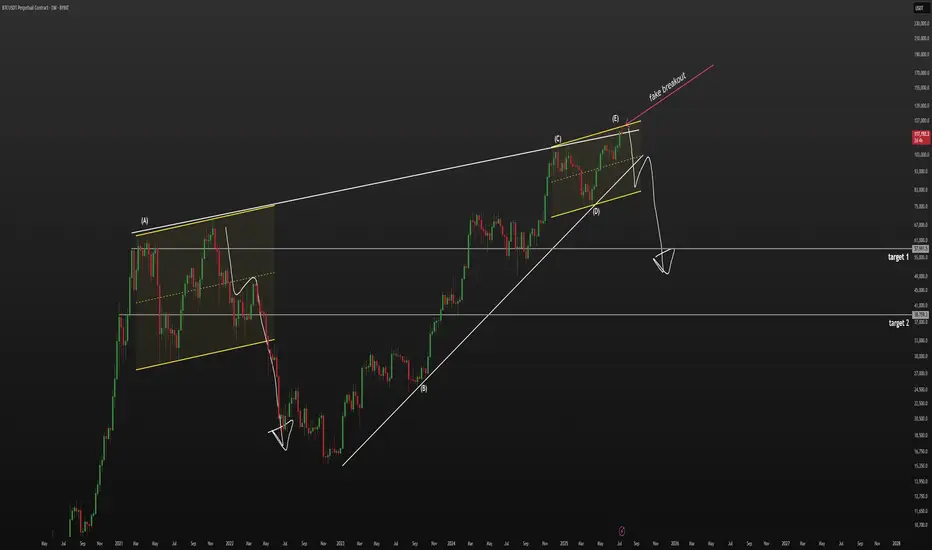
BTC - bearish wedge, 60k$ not a joke🔻 Globally, we are in a bearish wedge.
The price made a fake breakout and currently looks weak. On the 1D timeframe, we’re in an ascending channel similar to what we saw in 2021. Back then, after making a second higher high, the price sharply reversed downward.
📉 I believe the relevant downside targets are $60,000 and $40,000.
🔺 I’m currently in a short position, with a stop at $125,333.
ABC Short PositionThis is a live trade, ABC short position on the 1hr time frame. There is a larger short position on the 4hr chart if we break 111,865 area. Watching for reversals & ABC formations to the upside to closeout trade.

BTCUSDT - Short Term Buy Cycle BTCUSDT
Short term buy cycle
TP at 120558
% bubble ratio
Currently in a negative bubble either fair value at 120558, the cycle is a short term and expected to be closed within maximum 6 months
Spot trading plan:
Start to buy from (-10%) bubble ratio and below

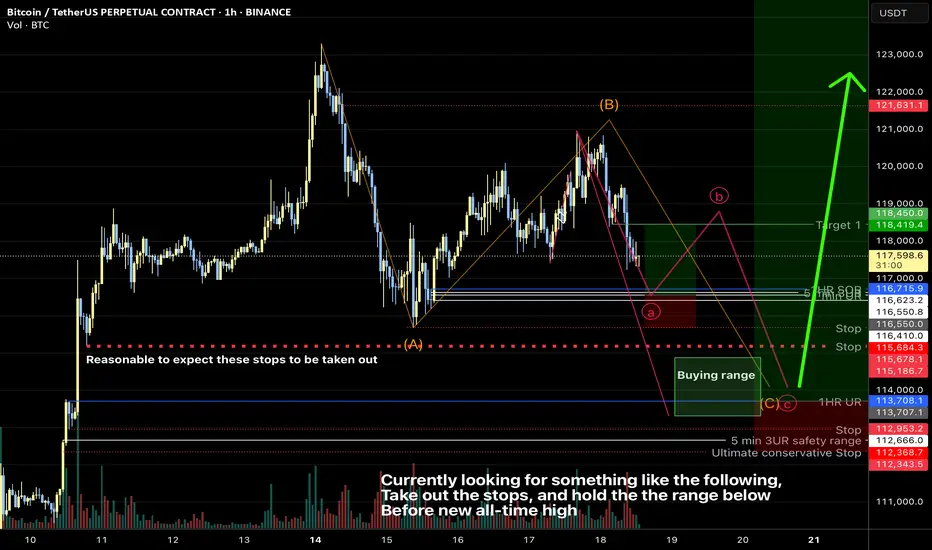
Bitcoin Overall: New local low b4 ATHCurrently looking for something like the following, Take out the stops, and hold the the range below Before new all-time high
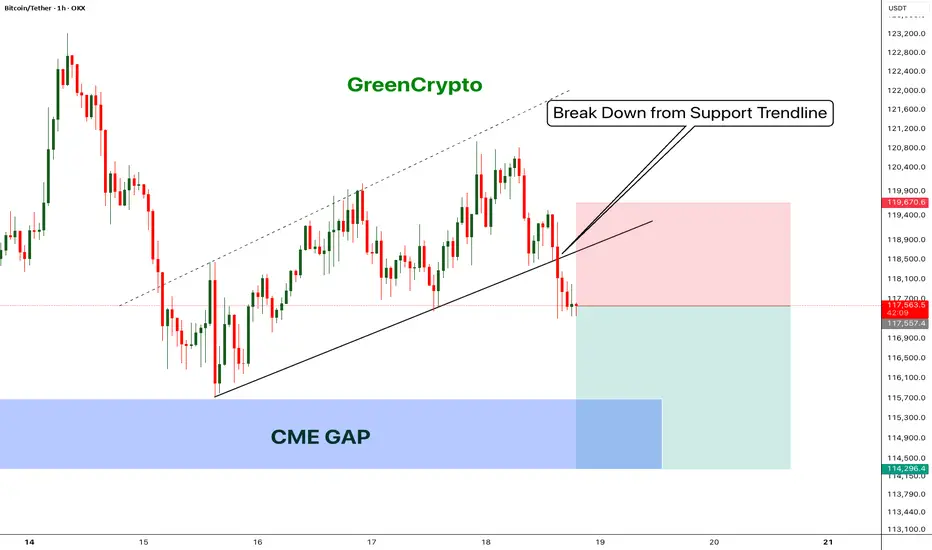
Bitcoin - Bears will push the price fill CME Gap- Bitcoin has broken down from the trending support,
- Price has been going down without any retracement on 1H candle.
- Looks like bitcoin will CME gap before going up further.
- A high risk Short Trade opportunity is here
Entry: 117,431
Stop Loss: 119,670
TP1: 116152.8
TP2: 114403.6
Move SL to Breakeven on TP1 hit
Don't forget to like and follow
Cheers
GreenCrypto
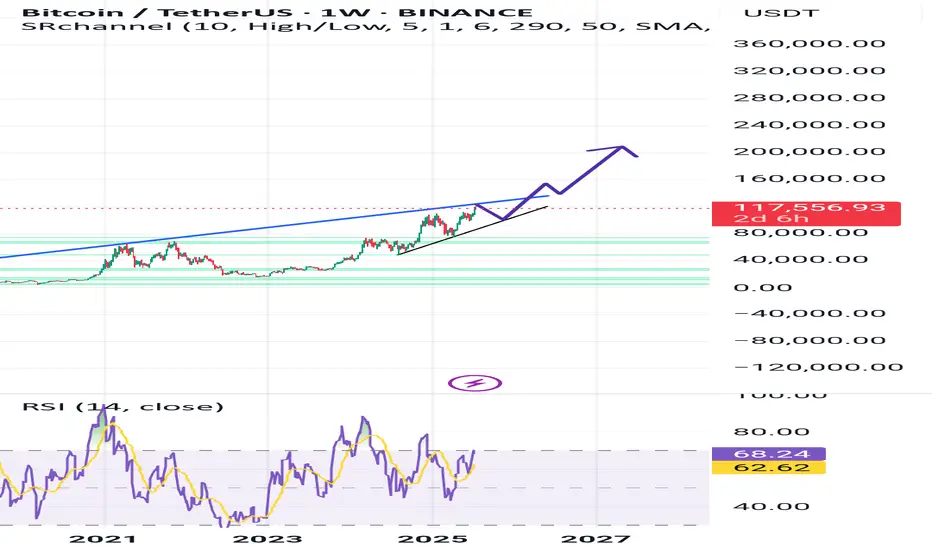
Need to retest $91k before next big moveI think now Bitcoin can take healthy correction before to takeoff 🛫 for major upside move.
And if BTC break $124k than we can see $134.5k before take correction..
Let's see what will happen next..
2RRI believe bitcoin is eventually making a new local lower low, however, that it will likely bounce off the indicated range first, moving up in a three wave move before continuing lower. Well, the target may need to be adjusted, the indicated trade is attempting to take advantage of this Analysis.
The Critical Blue Line – Will Bitcoin Soar or Sink
🔹 Bitcoin Technical Analysis – Key Blue Line, Bear Trap Possibility & Long-Term Scenario
On the Bitcoin chart, the blue horizontal level has acted multiple times as both support and resistance. The price has broken it several times but failed to sustain above, indicating high-volume decision-making zones by institutions and large players.
📉 Why this pattern keeps repeating:
Strong supply and demand concentration at this level.
Inability to break and hold shows market indecision.
Repeated fakeouts are likely used to shake out weak hands.
🔍 Important hidden scenario: Bear Trap Potential
If the price dips below the blue line but quickly reclaims it, it may form a bear trap, tricking short sellers into entering prematurely. This move could ignite strong bullish momentum from trapped sellers and renewed buyers.
🔮 If price holds above the blue line:
Signals market strength and potential bullish structure shift.
Targets:
109,800
117,200
120,000+ (Long-term)
📛 If support fails again:
Retracement toward the lower channel near 101,000 or lower is possible.
📊 Conclusion:
This zone is one of the most critical decision points in the current market. Traders should combine volume, candlestick behavior, and confirmation signals to avoid getting trapped by fake breaks

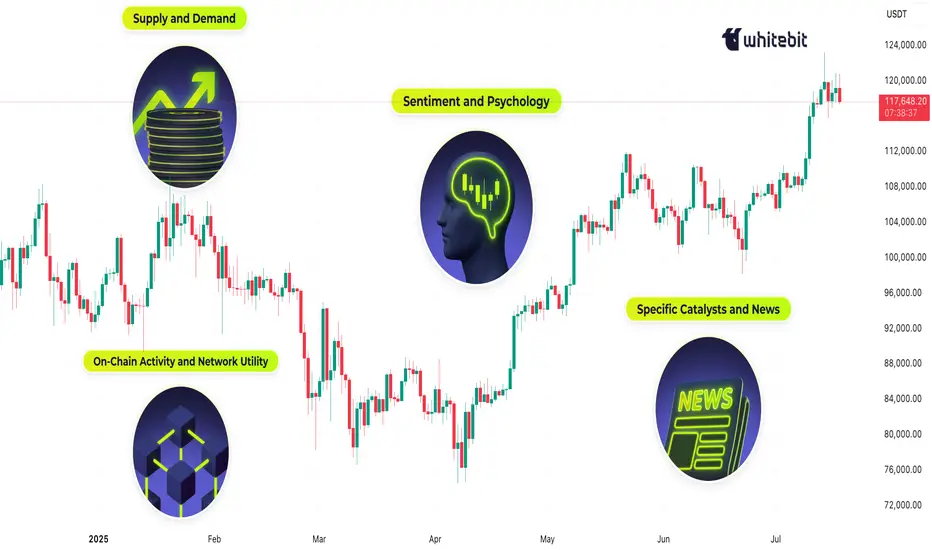
What Moves the Crypto Market?Hello, Traders!
If you’ve spent any time staring at crypto charts, you’ve probably asked: “Why is this happening?” And the truth is… there’s never one simple answer.
Crypto markets are complex, global, 24/7 systems. The forces behind a price move can be technical, fundamental, psychological or all at once. So let’s unpack what really moves this market.
1. Supply and Demand — The Fundamentals Behind the Volatility
At its core, crypto prices are governed by supply and demand. If more people want to buy than sell, the price goes up and vice versa. But it’s not that simple.
Take Bitcoin. It has a fixed max supply of 21 million, and most of those coins are already mined. But available liquidity on exchanges is much smaller and this is where things get interesting. During bull markets, demand surges while liquid supply dries up. That creates parabolic moves. Then you have supply unlocks, token vesting schedules, and inflationary emissions all of which affect how much of a coin is flowing into the market.
Example: When Lido enabled ETH withdrawals in 2023, it shifted the ETH supply dynamics, some saw it as bearish (more unlocked supply), others bullish (greater staking confidence).
2. Sentiment and Psychology: Fear & Greed Still Rule
If you want to understand the crypto market, start by studying people. Emotions drive decision-making, and crypto is still largely a retail-dominated space. Bull runs often start with doubt, accelerate with FOMO, and end in euphoria. Bear markets move from panic to despair to apathy. The crypto psychology chart rarely lies, but it always feels different in real time.
The classic “psychological numbers in trading”, like $10K, $20K, $100K BTC, often act as invisible walls of resistance or support. Why? Because traders anchor to these round levels.
👉 We’ve covered this phenomenon in detail in a dedicated post “The Power of Round Numbers in Trading.” Highly recommend checking it out if you want to understand how these zones shape market psychology and price action.
3. On-Chain Activity and Network Utility
Fundamentals matter. But in crypto, fundamentals are on-chain. The transparency of blockchain networks provides valuable insights into fundamental usage and investor behavior, which often foreshadow price trends. On-chain metrics such as active addresses, transaction volumes, and wallet holdings offer insight into the health and sentiment of the crypto ecosystem:
Network Usage (Active Addresses & Transactions): A growing number of active addresses or transactions might indicate rising network demand and adoption. Empirical studies have found that BTC’s price strongly correlates with its on-chain activity – increases in the number of wallets, active addresses, and transaction counts tend to accompany price appreciation.
Exchange Inflows/Outflows: Tracking the movement of Bitcoin or Ether in and out of exchanges provides clues to investor intent. Large outflows from exchanges are often bullish signals – coins withdrawn to private wallets imply holders are opting to HODL rather than trade or sell, tightening the available supply on the market. For example, in late March 2025, as Bitcoin neared $90,000, exchange outflows hit a 7-month high (~11,574 BTC withdrawn in one day) mainly by whale holders, indicating strong confidence.
Mining Activity and Miner Behavior: In Proof-of-Work coins like Bitcoin, miners are forced sellers (regularly selling block rewards to cover costs), so their behavior can impact price. Periods of miner capitulation, when mining becomes unprofitable and many miners shut off or sell holdings, have historically aligned with market bottoms.
For example, in August 2024, Bitcoin experienced a miner “capitulation event”: daily miner outflows spiked to ~19,000 BTC (the highest in months) as the price dipped to around $ 49,000, suggesting that miners had dumped inventory as profit margins evaporated. Shortly after, the network hash rate quickly recovered to new highs, indicating that miners’ confidence was returning, even as the price was low.
Final Thoughts
In conclusion, the crypto market’s price movements are driven by a complex interplay of factors… Market sentiment and psychology can override fundamentals in the short run, leading to euphoric rallies or panicked crashes. On-chain metrics provide the ground truth of user adoption and big-holder behavior, often signaling trend changes before they happen. Halvings and tokenomics remind us that the code underlying these assets directly affects their value by controlling supply. And finally, specific catalysts and news events encapsulate how all these forces can converge in real time.
For enthusiasts, understanding “what moves the crypto market” is crucial for navigating its volatility. Crypto will likely remain a fast-evolving space, but its price movements are not random. They are the sum of these identifiable factors, all of which savvy market participants weigh in their quest to predict the next move in Bitcoin, Ethereum, and beyond.
What do you think? 👇🏻
BTC - 115 - 113k when?Looks likely today or tomorrow, Just in case if it traps you know how it can and if not you know the fall!

BTCUSD BUY PLAN FROM 4H DEMAND ZONEBTCUSD BUY PLAN FROM 4H DEMAND ZONE
Hence the trend is bullish we can plan for buys from demand zone.

BTC for long *The content on this analysis is subject to change at any time without notice, and is provided for the sole purpose of assisting traders to make independent investment decisions.

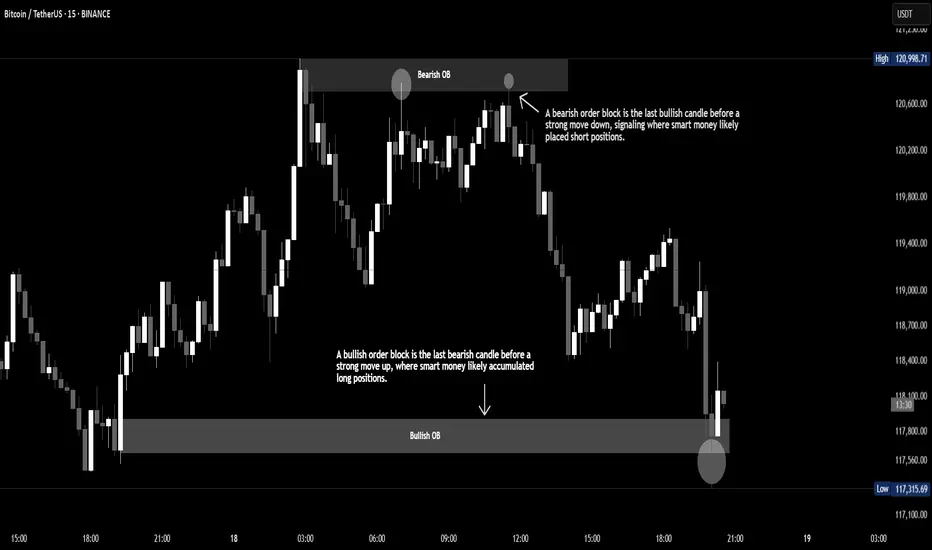
Order Block Explained Order blocks are zones where big players (like institutions) place large orders, often leading to strong moves in price. They act as key areas of interest—bullish order blocks signal potential upward moves, while bearish
BTC - Long the $115k LiquidationsHiya friends,
Hope the market has been treating y'all well.
Long Btc soon for another leg up! Then take profits! LOL
Trade thirsty, my friends!

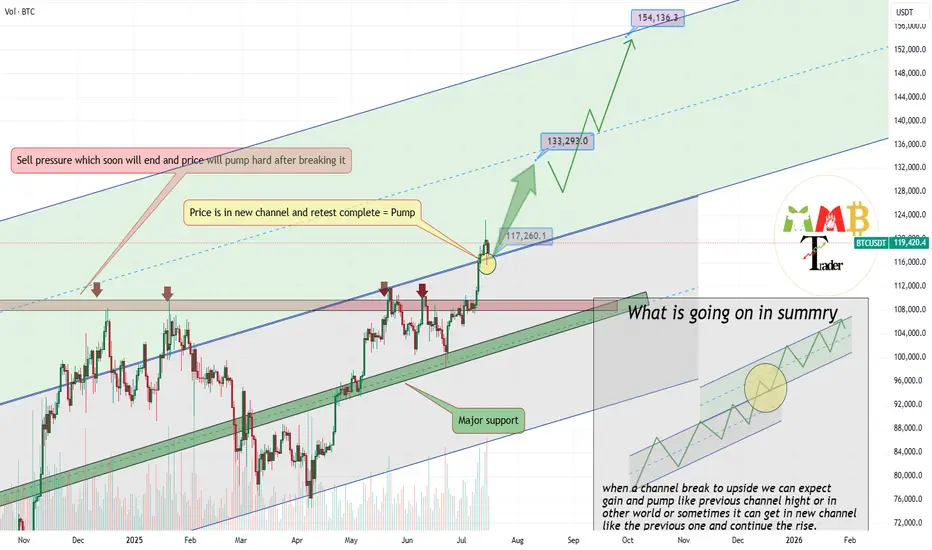
Bitcoin retest of breakout completed soon 133K$As we can see price broke previous channel and now is in new Ascending channel and pointing targets like 133K$ & 150K$.
Major support now is around 116000$ to 117000$ and price hold strong and market can easily continue more pump here like the green arrow.
BINANCE:BTCUSDT is now hitting ATH constantly and this just beginning of this bull run because ALT coins are not yet started.
DISCLAIMER: ((trade based on your own decision))
<<press like👍 if you enjoy💚