BTCUST trade ideas

$BTC - Much Higher or Much Lower. EoY '26I'm not gonna lie, I drew these lines with my balls. I use them to move my cursor on my computer monitor.
This is not financial advice. This is just how my deep gut instinct likes to draw brushstrokes.
I gave 4 optional trajectories.
These will likely not happen, nor is it likely that the Price Action and Valuation will stay within these lines.
Enjoy and Happy Trading!
Mr. Storm

BTC is sitting on a volcanoStrong resistance at 110k and things couldn't get hotter for BTC esp. with the President pumping it and profiting from all of this (ethics 101). Let's recap: yields going up, economy is cooling (S&P going up for a week is not a reflection of things getting better), high interest rates, ultra high historical multiples, tariffs and higher debt, which are inflationary are all in front of us. This is not sustainable, a correction will happen very soon and people could get wiped out.
Always do your own due diligence and best of luck! Profit takers and crypto bros will start selling real soon, just like every other time before.

Bitcoin scalp long back to $112,000 ATHTook a risky scalp long on bitcoin just now.
Aiming for $112000-$112720
1.44-2.78RR
Stop: $110670

BTC/USDT Technical Analysis, 2025-07-07 11:30 UTC📊 BTC/USDT Technical Analysis, 2025-07-07 11:30 UTC
🕒 Binance Spot
📆 July 7, 2025 | 11:30 GMT Candle Observations
───────────────
💡 Price: 108712.97 USDT
📉 EMA200 (Dynamic): 108938.31
🟩 Support Watch: 107512.97
🟦 Resistance Target: 109782.97
───────────────
🔍 We're observing price action developing below EMA200, with a recent Piercing Line formation at a noted dip zone. This setup may suggest buyers are attempting to reclaim short-term control.
⚠️ Key tactical support remains near 107512.97, where historical reaction zones and liquidity zones intersect.
📈 A move toward 109782.97 is being monitored as a potential resistance test, in line with local OBV divergence and recovering bid pressure.
📌 Market Microstructure Notes:
• Order Book Imbalance leaning toward bids (+0.45)
• OBV Trend: +10.17% vs 5-period MA
• Thunder Engine Volume Acceleration: ⚡ Observed
• Whale Ask Cluster: ~640k USDT near top of range
📉 No guarantees of breakout or reversal watching how price reacts around key levels. Maintain cautious positioning near support/resistance pivots.

BTC MTF AccumulationThis is the current accumulation model i am watching to bring BTC back to ATH's and form the second deviation of the HTF distribution model. I would prefer if we could go lower and form a range from there, but at the moment thats all i got.

Lingrid | BTCUSDT Short-Term Bullish Momentum The price perfectly fulfilled my last idea . BINANCE:BTCUSDT continues to trade within a strong upward channel, supported by consecutive higher highs and an ascending trendline. After breaking above the range near $108,200, price briefly peaked above $110,000 before pulling back to retest the mid-support zone. Current action shows a rebound from the upward trendline, suggesting buyers are preparing for another leg up toward $110,500 and possibly the $112,000 resistance zone.
📈 Key Levels
Buy zone: around 108,000 or below
Sell trigger: break below 107,000 with close under channel
Target: 110,500 – midpoint resistance, followed by 112,000
Buy trigger: bounce from trendline and reclaim of 109,000
💡 Risks
Weak rebound could signal range re-entry and stall upside
Break below the trendline may shift bias to 105,000
Multiple rejections near 110,000 could indicate topping pressure
If this idea resonates with you or you have your own opinion, traders, hit the comments. I’m excited to read your thoughts!

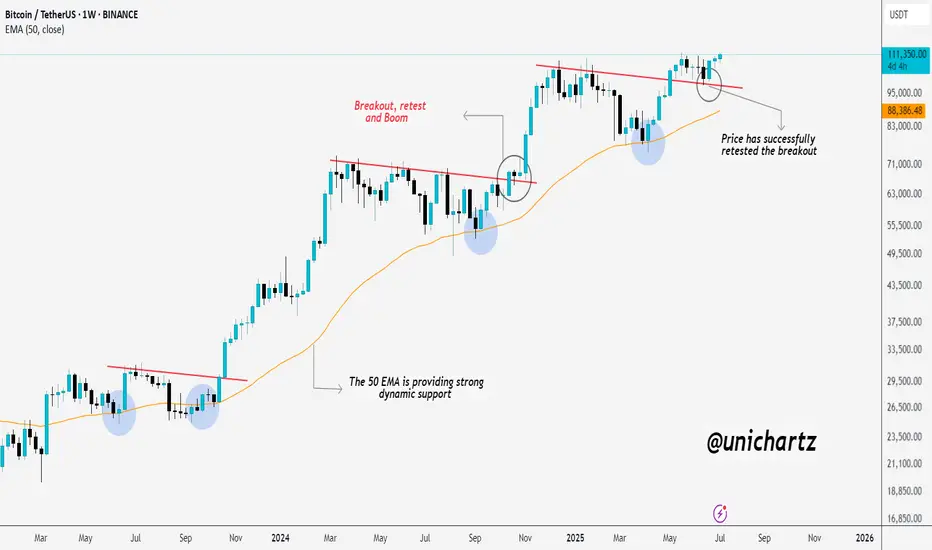
50 EMA Magic: Bitcoin Explodes After Perfect Retest!CRYPTOCAP:BTC just made a new All-Time High (ATH) — exactly as mentioned!
It broke out, retested perfectly, and blasted off.
The 50 EMA is acting like a rocket launchpad, giving price solid support every time.
SPXBank of America expects SPX to close 2025 near 6,300, with a 12‑month projection of 6,600. They note ongoing stagflation risks and do not expect rate cuts this year .

BTC makes new all time highs!Crypto has been soaring today.
Ethereum and BTC pumping liquidity!
Fed minutes came out today around 2pm, indicating rate cuts at next meeting and throughout the rest of the year and crypto absolutely loved that.
Crypto thrives in a cheap liquidity environment, rallying in potential rate cuts.
We took profits on IBIT calls - still holding longs in the BTC market expecting higher price.

Delayed Cycle Kicks Off This March? (Chart)🚀📈 Delayed Cycle Kicks Off This March? 🔥💡
March has (almost) arrived, and Bitcoin has officially confirmed $79,478 as major structural support—a critical level that had to be checked before the next move. This aligns perfectly with my previous idea of a delayed cycle playing out.
📌 Long above 79K
📌 Short below 79K
📌 Short-term target: GETTEX:87K+
With this structural support holding, I expect Bitcoin to push toward the next major test: $113,800. This is the all-time trendline, a level of historical significance.
🔑 What happens at 113K?
This is where Bitcoin’s fate for this cycle will be decided:
✅ A breakout above 113K could unlock a run to 150K - 200K, a true extension of this cycle.
❌ A terminal rejection at 113K could mark the end of this cycle, signaling a broader correction phase.
At the moment, the probabilities lean toward further upside, with an 80% chance of continuation. The 20% downside risk remains for a dip to FWB:65K-66K, but as long as Bitcoin stays above 79K, the bullish thesis remains intact.
💡 March looks strong, and I’m stepping on the gas today.
Let’s make it a powerful month! 🚀
One Love,
The FXPROFESSOR 💙
video:

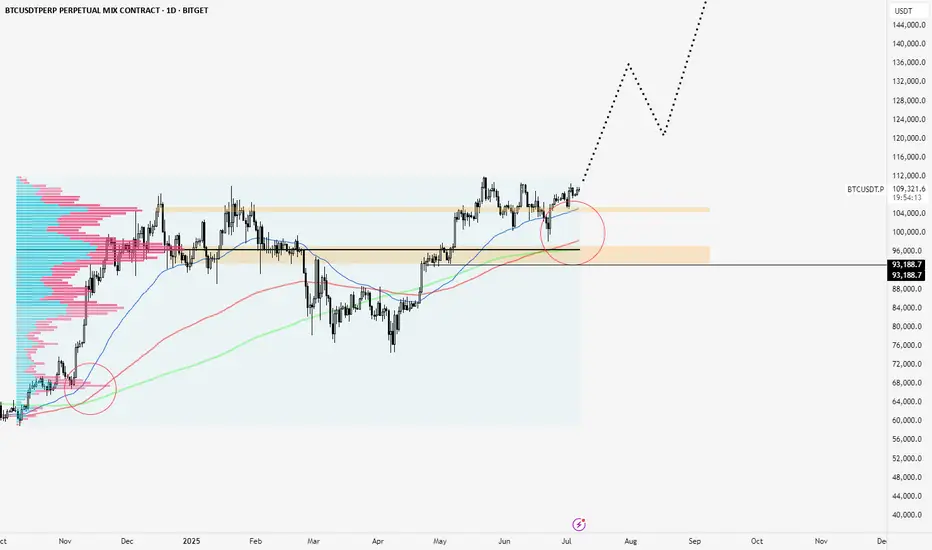
Bitcoin Breakout Ahead of Crypto WeekBitcoin has a great chance at cracking new all time highs and breaking out into price discovery this month. On July 14th, the US is considering it Crypto Week. Signing in the GENIUS bill, and more around crypto assets.
Bitcoin has held this volume shelf at around 104/105k for a while and these relative equal highs on the daily look like they can crack. I have highlighted some zones on the chart that I'd consider extremely important levels.
If we do crack these highs , I am on the side that the price action will be extremely expansive after all the work that has been done at those high volume clusters. If it fails I believe we should trade back to the high volume clusters, and if that doesn't hold, then we should trade through the thinner volume to do more business before bouncing off of the POC at around 96.5k.
The 50,150 & 200 EMAs are all signing ideal strength. Virtually all expansions in their early stages from 2023 to now contained these crosses on the Daily TF.
I am long BTC on a high timeframe. Macro narratives are strong, the asset is strong, and the downside is always in our control to be limited.
When will the media talk about BTC so I can SELL?!?!?!Waiting for the mainstream media to talk about BTC and the mass to buy bitcoin so I can sell my BTC LOL, I HAVE A WEDDING TO PAY!

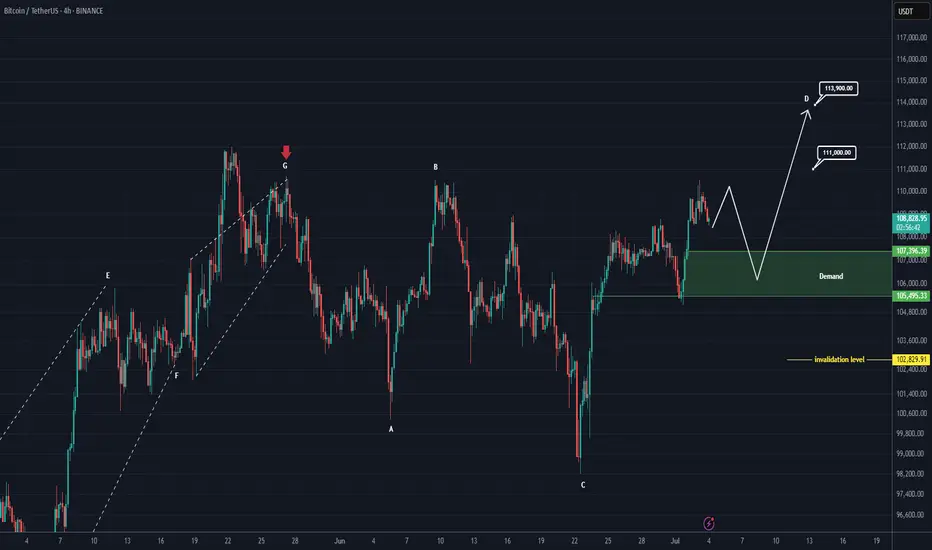
Bitcoin New Update (4H)This analysis is an update of the analysis you see in the "Related publications" section
If we were to publish an update for Bitcoin, wave D could move toward higher levels.
After hitting the green zone and gaining momentum, it could once again move upward to liquidate short positions.
In this update, we've naturally raised and revised the invalidation level.
The new targets have been marked on the chart.
A daily candle closing below the invalidation level would invalidate this analysis.
For risk management, please don't forget stop loss and capital management
Comment if you have any questions
Thank You
Lower time frameI've shared an analysis from a lower time frame, that could indicate the start of a big move.

BITCOIN → Market manipulation. Chance for growth to 110KBINANCE:BTCUSDT , as part of a correction triggered by negative news from the US regarding tariffs, is testing liquidity in the support zone. There is a chance of recovery to 110K.
Bitcoin is reacting with a decline to fundamentally negative data on tariffs from Trump. Technically, the price is facing support and forming a false breakdown, the purpose of which was to capture liquidity. This could lead to a recovery within consolidation in an uptrend, but again, there are conditions...
Countries that have received notification of tariffs are responding positively to cooperation (if this trend continues, Bitcoin could receive a local bullish driver).
The market perceives this as positive, and after liquidity is captured, the price could recover to the resistance of the trading range.
Resistance levels: 108230, 109690
Support levels: 107500, 106500
Bulls are trying to hold the local interim bottom at 107500. There is a reaction to the false breakdown of support. The focus is on 108230; if the market can break through this level, we will have a chance to grow to 110K.
Best regards, R. Linda!
