BITSHARES Technical Analysis - BTSUSD - 850% Profit Expected...BITSHARES Technical Analysis - BTSUSD - 140%-850% Profit Expected
Big Trade Coming For Bitshares ... 8x - 9x Gains Expected.
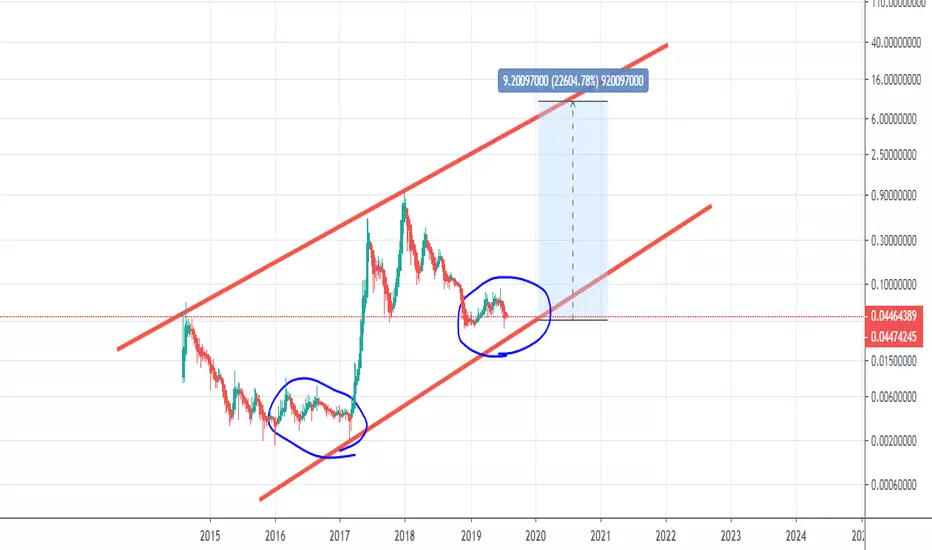
Based on AB=CD pattern, Time Ratio & Gann Analysis, It's a potential long position with great returns :)
In a lower time-frame (4hrs) this long position has also been confirmed.
For Bigger Time-Frame
Target Profit Range - 0.036 - 0.114
(140%-850% Profit Expected)
TP - 1 - 0.036
TP - 2 - 0.053
TP - 3 - 0.079
TP - 4 - 0.066
TP - 5 - 0.095
TP - 6 - 0.114
Buying Zone! Long Position
Early Entry Trigger Point - 0.013 - 0.015
Ideal Entry Trigger Point - 0.010 - 0.012
***If you want to get in this trade from this point 0.026 you can still make 38.5% profit till TP1 is reached. There is a very high probability that price may continue to move upwards before it moves downwards towards my ideal entry point., It is recommended to enter with a smaller lot size if you want to go long right away & manage your stop loss accordingly.
Short-term Trade- 1hr- chart
I see a possible move going upwards and may hit 0.035 or it can even touch 0.04 mark that's why I have mentioned the points in a chart for a short-term long position too. As it's a short term risky trade, it is highly recommended to enter with a smaller lot size if you want to go long right away & manage your stop loss accordingly.
Good Luck.!
Disclaimer - This is not financial advice. This is my personal view and analysis of this chart.
If you follow this idea please plan your trade according to your lot size and account equity.
Don't forget to like, comment & follow, If you agree with my analysis :)
BTSUSD trade ideas

BTS & XLM PatternXLM is leading the way for BTS by 7 weeks. These two have followed similar patterns for most of their existence.
We'll keep tracking BTS for some bullish momentum.
Good luck.

Alternate Count: Descending ABCDE Tri What do you think??? I need to see where a measured 1:1 move will put us, will update later...

BTSUSD - BitsharesI really like this DEX..
Just wish it had more volume. Definitely a quality coin.
Just revisiting my initial idea and keeping this for future reference.


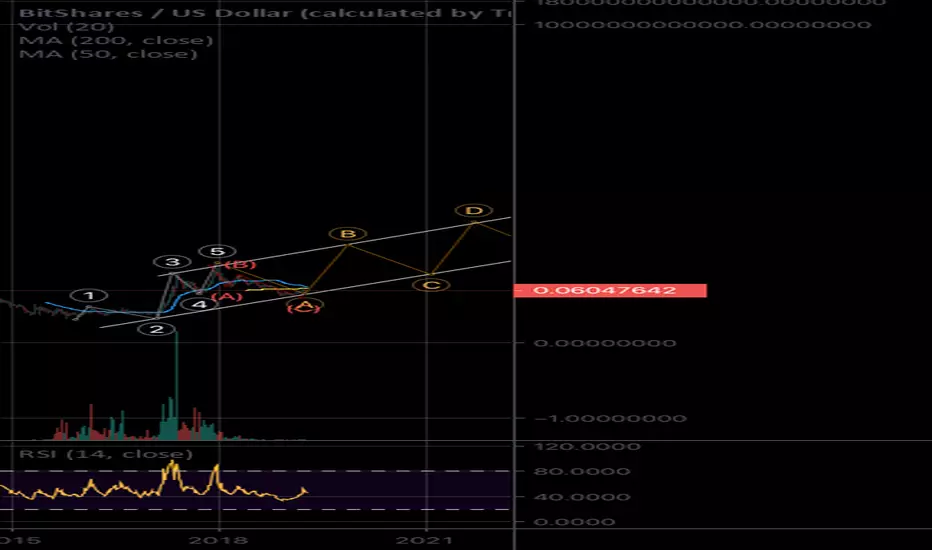
ABCDE Bull flag, then moon?If this is an ABCDE bull flag, then we could have up to another year or so of correction before we see an impulse up to the triple digits after it finishes.
I expect a low of .01c . Haha. Just for fun, but what if?!?

Bitshares= double bottom before impulseLooks like it is printing a similar corrective structure to me. Expecting a long sideways double bottom before next big impulse.
BTSUSD : May, monthly projectionFollow back on april projection :
So for april we almost had it. the resistance is 0.08 and not higher as expected. I should have consider the 5th as the spike right after the 3rd.. dat greedy subconsciousness.. hoping to reach higher resistance ! But overall success on the retracement :
_______________
Scenario A :
If we reach a higher high then i will consider the past resistance as new support and may wait before scalping as bigger pattern might form. Put your eyes on a probable daily MACD bullish crossover. It should happen in the first week of May :
Scenario B
If we dont reach a higher high its gonna be most probably an ABC retracement normally ending in the wave 1-2 price zone. In this case i will secure my position with sell limit. Watch the daily MACD, we going toward neutral spectrum where high fluctuation happens when MACD bearish/bullish crossover :
______________________
On the longer term my ideas are :
MACD going directly toward positive spectrum - optimist
or
MACD pause, we retrace then gradually going up - careful
like this

BTS on the road to 0.1USDBTS is currently trading at 0.06... it's on a slow uptrend, at the current rate it should surpass 0.07USD by July... There is still a few weeks before a breakout from 0.08USD can occur if that happens we will have a very strong support at 0.07USD due to the slow build up... It's advisable to stock up BTS right now before July. On the downside BTS has a strong support at 0.04USD and 0.03USD should things go bearish...
N/B this is not trading advice

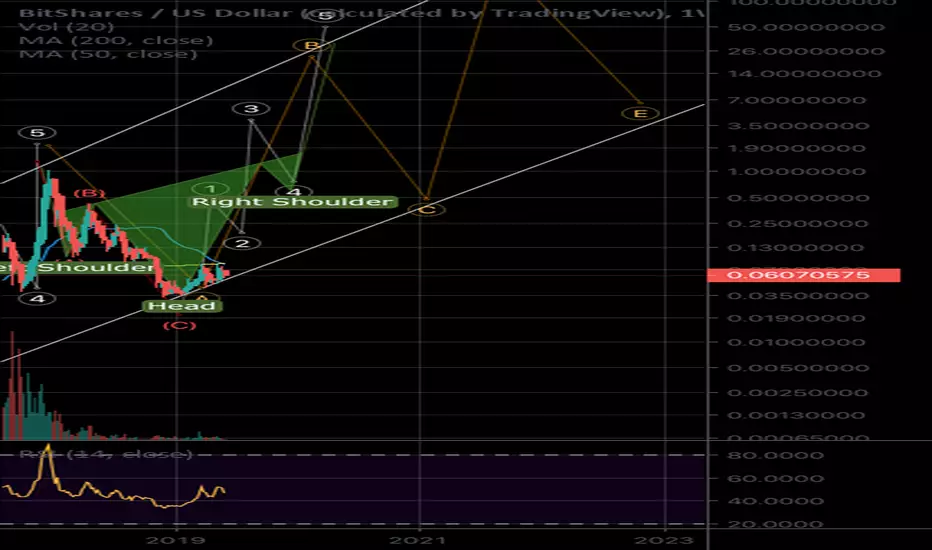
BTS in an Inverse Head and Shoulders?I’m not the best at this, more or less publishing to get some feedback. Let me know y’alls thoughts!


BTSUSD : 0.09 likelyHi guys,
So same BTC logic applied here for BTS. I expect a little end pike to 0.09. The macd seems to make a projected bearish crossover in the next few days but the higly positive spectrum (Y positive value where MACD is at) that the bearish crossover effect will be mitigate and probably retry a up near 0.09.
We already almost hit resistance zone so maybe add a little precaution here but right now im waiting to get better price like 0.08-0.09 zone before selling a part of my positions.
---------------------------
past count/update is here :
_________________
I look foward to update the post but dont be shy to ask ponctual update as im pretty busy since the new year has started. Your notification will remember me to take a look.

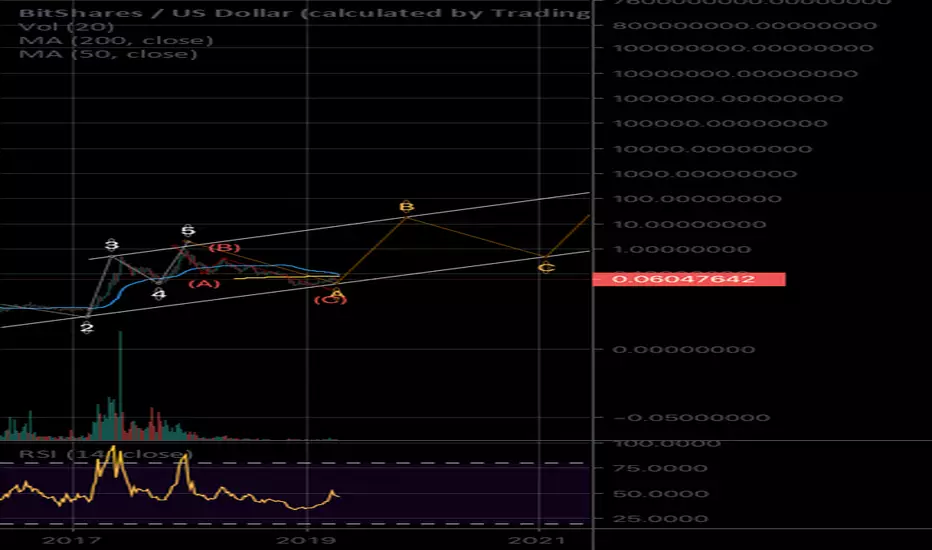
BTSUSD Weekly Chart Projection What do y’all think about this on a log chart? I would love to hear some feedback!
BITSHARES +70% profit opportunity Buy SignalPattern: Higher Low Channel on 1D.
Signal: Bullish.
Target 0.08680 (the 1W Resistance Zone).


BTSUSD : New mid term target 19/01/23Hi guys,
Sorry to be less active but things going full speed here.
Last month post target reached :
now what ?
Weekly seems to have found a temporary bottom. I will not call the absolute right now but wave count seems in. MACD 1W is in bullish position but its so deep in the spectrum that his state is not reflected in price movement :
Overall i expect BTS to return to 0.05 and testing resistance. I need 1.5 week to call 0.07 as highly probable. For now, 0.05 seems the most possible short/mid term target for scalper/day trader

$BTS is currently catching my attention...$BTS is at the moment catching my attention.
There is definitely a good amount of Daily Volume to Swing Trade this one even Day Trade it.
I suggest to keep a close eye on it...it may very well get a little volume spike which will create a decent run.

The great coin raceHere's how the 10 coins have done since Jan. 1 2019. Follow if you like for future race updates.
--------------------------------------------------------------------->ADA 18%
------------------------------------------------------------------------------------------------------------------------------------------------------------>TRX 42
----------------->XRP .5%
-----------------> ETH 1%
-------------------------->BTC 4.5%
--------------------------------------------------------------------------->LTC 20%
--------------------->EOS 2.5%
--------BCH -3%<----
BSV -5%<---
-------------------------- ->XLM 6%
-5 -4 -3- 2- 1 0 1 2 3 4 5 6 7 8 9 10 11 12 13 14 15 16 17 18 19 20 21 22 23 24 25 26 27 28 29 30 31 32 33 34 35 36 37 38 39 40 41 42

BTS/USD A decent targetIf we can maintain this fractal of growth of 1 magnitude per 2 major market waves, we can forecast up to 10USD for the next high. Hard to know when this bear market will end though, so the date of 4 and 5 is a guesstimate here. It could be a short or long bear market, but I tried to match the angle for waves 3 and 4 with 1 and 2, which seems to work out decently. It's also possible that if the BTS platform becomes more mainstream and does well, we can see even more amplitude in this this next growth cycle, so we could see more than one magnitude of growth for the next high wave (odd wave), maybe 10-100 USD in that circumstance. Another reason for extra magnitudes of growth from a speculation standpoint is that BTS is now on a lot of Chinese exchanges (props if you trade there).
Good luck, have fun <3

BitShares Hardfork Trade AnalysisBTS or Bitshares will be hardforking on the 4th of December 2018. This usually leads to a pump as a result of two new coins being released.
What do the charts say?
Bullish
MACD on the 1D Chart has flashed green for the first time since early June 2018 - the last time this has happened we saw a 70% pump.
The market has twice rejected a fall below $0.04275, indicating whilst there may be a volume gap that needs to be filled here - it is unlikely that it will occur.
A volume gap has to be filled at $0.06 and $0.07 and $0.08
A double bottom at $0.049 indicates we are seeing the start of an uptrend - we are unlikely to go lower than this present level.
It is more than likely that BTS will revisit its previous local area last seen in the middle of November, where it was $0.010 - this indicates a close to 2X move or 87% increase.
Bearish
RSI Stochastic on the 1D has recently crossed-over indicating that despite two new coins being released, a sell-off of both of the coins could see to a large downtrend.
A volume gap has presented itself at 0.04275 - there is a high chance this may be filled.
Nouvive Says: To invest or Trade in BTS at its current levels with a take profit for investors at $0.10 or a take profit for short-term traders at $0.07. A stop loss for both trades should be at $0.04680.
