BTSUSD : ending semi-circular formHi guys,
I expect BTS to behave like i described in my last post : A semi-circular pattern then proceed to impulse.
I kind of expect a good and strong impulse on the outcome of this semi-circular pattern as for now BTS behave like this between each cycle, independently of his strenght.
1h and 4h MACD are on bearish divergence and once we will be there we will have all indicator ready to have a bullish crossover on all thime fram. This is where i expect the impulse will have. Will update on this tho.
BTSUSD trade ideas


A new trading opportunity to buy in BTSUSDTechnical analysis:
. BITSHARES/DOLLAR is in a range bound and the beginning of uptrend is expected.
. The price is below the 21-Day WEMA which acts as a dynamic resistance.
. The RSI is at 27.
. While the RSI and the price downtrend in the Daily chart are not broken, bearish wave in price would continue .
Trading suggestion:
. There is a possibility of temporary retracement to suggested support zone (0.1210 to 0.0438). if so, traders can set orders based on Price Action and expect to reach short-term targets.
Beginning of entry zone (0.1210)
Ending of entry zone (0.0438)
Entry signal:
Signal to enter the market occurs when the price comes to "Buy zone" then forms one of the reversal patterns, whether "Bullish Engulfing" , "Hammer" or "Valley" in other words,
NO entry signal when the price comes to the zone BUT after any of the reversal patterns is formed in the zone.
To learn more about "Entry signal" and the special version of our "Price Action" strategy FOLLOW our lessons:
Take Profits:
TP1= @ 0.1855
TP2= @ 0.2379
TP3= @ 0.3170
TP4= @ 0.4536
TP5= @ 0.5638
TP6= @ 0.6736
TP7= @ 0.9800
TP8= Free

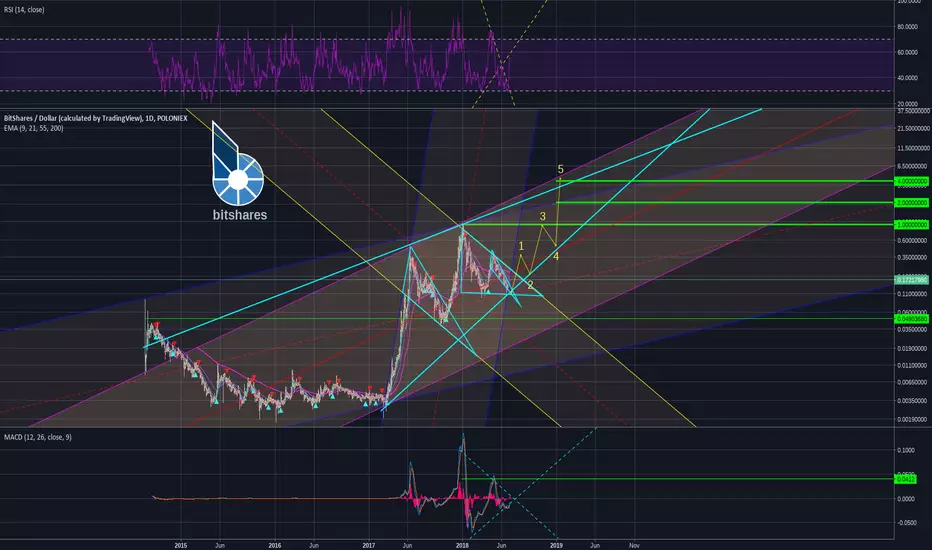
BTSUSD : probable pathwayHi guys,
So we like i posted, maybe 3 weeks ago, the retracement is going like expected. The thing his we might have a macro 1-5. On the past post i was saying that we were due for an ABC. there is different form of ABC. So it might goes as you see in the post or end there. So the hypothesis is 'if resistance is broken do not expect further retracement :
For now i expect a short/mid term bounce as daily histogram stabilize but is located in the negative spectrum :
So by experience it could be a little bounce for a deeper retracement.
OH ! and btw BTS is finally added to lykke platform with a 4 month late implementation. I was telling the community here about Lykke fiat on/off for BTS back in April. Its maybe i have good contacts that i had an early information or just their team that didnt prioriotize it as wanted.

Bitshares - blue buy zones and flag formationWe are seeing some juicy buy zones approaching with BTS. These are at fib levels so important levels to see possible bounces. I am waiting for bounce and confirmation of breakout from flag formation. If we see that with 5 wave impulses upwards we could have confiration of major reversal happening.

BTSUSD : most likely to follow BTC projected retracementHi guys,
I reworked my projection with the new data. BTS didnt folowed the last impulse that BTC made. So here we are with an exhausting histogram that i will project to make a signal bearish crossover.
An another form hypothesis :

Bullish scenario for BTS!Given the similarity of both market cycles, I was wondering what a possible bullish set-up for Bitshares would be. The previous market cycle reached its all-time-high at 2.272 fib level. When we would apply the same calculations on the current market cycle, it would drive up the price to approximately $2.20!
Just like the previous market cycle, the black trendline functions as heavy resistance, which is exactly where it got rejected yesterday as well. It will most likely retrace from here to gather enough strength to push through resistance. Let's see how it evolves.

BTSUSD : the most probable target price zone + MACD educationalHi guys,
It seems that my last month of reviewing my method starts to give fruits (french expression). We encountered different form but overall the price followed the most probable pathway.
So for this post, i might start counting wavse but if you follow me since a long time you know that i put to light that BTS is very hard to count in sub timeframe due to his many extended waves and subwaves. So lets adopt a posture where we try to have the bigger picture and not lost us into details. For now, this chart is my main pathway. Fibo extension seems to correlate with resistance.
we remember that i said, if you wanna have good performance, keep your eyes closely on this interaction :
Right now, MACD 1D bounced on the signal and made a centerline bullish crossover and in few time the signal will crossver centerline making a strong background indicator of the state of the market which you be described as : bullish rally confirmed. Normally this indicate a huge rise of 30%-50%. As you see my rule of MACD interaction is still valid as we passed from 0.14 at 0.223.
How to project huge price fluctuation ?
On this subject, if you are a MACD advanced user, we can see that our bullish signal started near the 0. When you working with MACD you need to ask yourself at least 2 questions : Where is the MACD (location in space) located on the latitude 'y' (negative/neutral/positive spectrum) ? And : What is the most probable interaction the MACD could have over time 'X' (macd-signal/macd-centerline/signal-centerline/bearish crossover/bullish-crossover) ? If you wanna be expert in this you need to mesure the strenght of the current trend to help you understand the macd behavior with the histogram (red waves) and understand expansion/contraction.
All of this to say that a centerline bullish crossover that happens right near 0 = have a greater weight for a huge extension in price since the rise happen in a low-lets name it like this- gravity resistance. Now you understand why i wrote 'huge fluctuation expected' in my last post. And it happened
For example :
A bullish centerline crossover happening with a start point at -100 will have a lesser extension (e.g. :20%) and have higher chance to be a bulls trap and fall hard. Think of a rocket with not enough fuel that fail to enter orbit, it gonna crash. So expect a price crash
A bullish centerline crossover happening with a start point at -5 have greater chance to have better extension (e.g. : 50%) and could indicate a bullish rally more than other thing. Think of a rocket launch near the equator. the distance at the equator to reach orbit is less than other places on earth. It required less energy to reach orbit and can use his fuel to reach a maximum distance (in this case price extension).
Note Bena ; dont forget to put the perspective of the interaction on the time frame your are working with.

Bitshares - 21 cents soonLooks likely we can see a nice continuation of current impulses up towards 21 cent zone (or higher).

BTSUSD : retracement been deeper.high price fluctuation expectedHi guys,
So we started here :
but the dip as gone a little bit under expected zone forcing me to count wave and spot the reversal zone, which has been well projected :
-----------------------
I wanna put to your eyes this. MACD 1D is at the perfect position for big price fluctuation. Im talking 20-30% to 50%. MACD is near 0 which is a perfect position for a full extension :
Right now, the direction is neutral, you see the head of the MACD flat going sideway. MACD crossover the centerline would be bullish or MACD crossover signal would be bearish. If you are a trader more than a holder you must take this seriously since it could have major impact on your performance

Bitshares Bullish Broadening Pattern...target Bullish bitshares broadening pattern shows the potential of a massive rise upon its next ascent...target to the $1.70+

BTSUSD : retrace like expected. but whats nextHi guys,
So, the continuation of the last post :
I played the risk and my order have been filled here :
Our strong signal stalling in the middle, which would make a huge rise in price if stil lvalid after the pattern that i highlight :


BTSUSD : Bears last standHi guys,
I make a small continuation of the last post of BTS. We left our discussion with this form :
I still think that BTS will/must retracement to give a better extension on the next impulse. The form let me suspect that projection :
Overall, we have 1 good indicator that shows that bulls are back in town but buying power have slowed which noramlly conduct to a little retracement. The bigger picture here where i expect BTS to fly up and test MA200, BL and major ATH resistance :
Once/if we break it, Im confident to expect tremendous gain on a major scale.

BTSUSD : most likely to retrace before another impulseHi guys,
It seems we completed a 2 lvl 1-5 waves. Im expecting a retracement, which is normally an ABC with short A short B and long C.
On the 4h chart. We are starting a bearish crossover but still a the positive spectrum so the chance that we stay bullish after this retracement exist.
it could be a good occasion to add +-10% easy to our stack before the next projected move up
Risk moderate/Reward moderate

BTSUSD : Another resistance broken. Indicators to watchHi guys.
BTSUSD start to looking good again. finishing an ABCDE and broke major resistance but the game is not over for bears. Bulls need to keep a certain momentum.
Right now, i see that we formed and finished a 2 lvl 1-5 with golden ratio. Normally we can expect a standard ABC retracement to wave 1. The tricky thing is if we are in a subwave of major 1-2. the ABC can morph into a flat ABCDE. I spotted some fractals form the previous low that match our current form.
Anyway i will keep my eyes on this :
I recognizev the double bottomd semi-arc that i was hunting before. Happened at a lower level than expected. Im still hodl since my buying signal at 0.20 with long position that i added at lower price. I reviewed what i missed and it seems that my brain function with ABC spotting by default and that the WXY (which took place) retracement wasnt part of my consciousness. This what i won in this 'loss', knowledge, priceless knowledge, so at the end of the end im still richer than i was :) Be humble and always try to gain something positive out of everything, if its not $ than its IQ and restart until you win what you want"
Concerning this move, if you bought in the lower price level when we broke the major resistance. the risk/reward of playing this ABC is not shiny as we are already near an actual bottom. If you are still out of the market. start adding position from time to time when/if price will go under this support :


LT BTS PredictionWill be interesting to see how EOS/BTS integration plays out. If BTS catches on, insofar become bitAssets become widely understood, and used, BTS holders are in for huge earnings.
*Not Financial Advice

BTSUSD : Just broke major resistance. Bulls emergingHi guys,
To follow up my old post of BTS which can be resumed here :
It looks like BTS found his bottom. I still expect a little retracement at the first resistance test but overall the picture is better than few weeks ago.
In this post, you see BTS finished a ABCDE pattern and followed the EW count which normally after an ABCDE you see price going throught majors resistances but it could stop at 0.14, the optimistic resistance test is at 0.15ish. I will be more active in july since i switched job and will start a new one in a national institute of cardiology only in august
lets keep it simple for now, no bigger picture projection like i did in the past post.
Take care, Simon.

Bitshares - correction analysisWyckoff theory says that after a decline in price (usually 5 waves down) you enter the accumulation phase. BTS shows this very clearly before the last bull run. We had a small accumulation phase followed up by a markup phase, distribution, and now mark down. I think we have a little lower to go but after we finish this I expect another accumulation phase with possible new ATH. July 4th - 18th would be a key time to watch out for movements in price.
