BITCOIN Trending Higher - Will Buyers Push Toward $104,550?COINBASE:BTCUSD has broken above a key resistance zone and is now pulling back for a potential retest. This area previously acted as resistance and may now serve as support, aligning with a potential bullish continuation.
If buyers confirm support at this level, the price is likely to move upward toward the $104,550 level, which serves as a logical target for this setup. Conversely, a failure to hold support could signal a potential bearish shift.
Traders should monitor for bullish confirmation signals, such as bullish engulfing candles, strong wicks rejecting the support zone, or increased buying volume, before considering long positions.
Let me know your thoughts or any additional insights you might have!
BULLUSD trade ideas

Bitcoin - All time highs will come next!Bitcoin - CRYPTO:BTCUSD - prepares a significant move:
(click chart above to see the in depth analysis👆🏻)
Over the past couple of months, we basically only saw sideways price action on Bitcoin. However, this does not mean, that Bitcoin is now slowing down; actually the opposite is true and Bitcoin is setting up for a major move higher. New all time highs will come very soon.
Levels to watch: $100.000
Keep your long term vision!
Philip (BasicTrading)

BITCOIN Analysis: Potential Pullback and ContinuationCOINBASE:BTCUSD is currently trading within an ascending channel, reflecting a clear bullish structure. The price may pull back toward the lower boundary of the channel before potentially continuing higher. This dynamic support offers a confluence area for a possible bullish reaction. A successful retest here could open the path for a move toward the $102,000 level, which aligns with the upper boundary of the channel and represents a logical bullish target.
However, a failure to hold this dynamic support could indicate weakening bullish momentum and may shift the short-term bias to neutral or bearish.
Traders should watch for confirmation signals such as bullish engulfing patterns, strong rejection wicks at the lower trendline, or increasing volume on the bounce before considering long positions.
Let me know your thoughts or if you see it differently! 🚀

Bitcoin: First Leg Of Wave 5 To 109K.Bitcoin has lingered around the 95K resistance area over the previous week. In my opinion this is a sub wave iii completion (5 mini waves can be counted within the bullish breakout leg). This implies there is a greater probability of a retrace or sub wave iv (see wave count on chart). The retrace can go as low as the 90K support without overlapping sub wave i which would keep the bullish impulse in play. Also there is enough evidence here to suggest this structure is likely the first wave of the broader Wave 5 which can see a test of the 109K high over the coming months.
The current high (see arrow) shows signs of potential reversal at a location where such a pattern can be expected. The question is, when will it retrace and how far? It is anyone's guess. This is where you have to have the ability to adjust as the market provides new information. Until then the best we can do is assess loose probabilities and wait to see how the market aligns or not.
The adjustment process is two fold: evaluating support/resistance levels and assessing the RISK associated with a given scenario. For example, the illustration on the chart shows a retrace back to 90K, this or some variation of this scenario may or may not unfold. The key is to have levels identified in advance and then WAITING to see how the market behaves at such levels. Does it confirm our idea or not? In the case of Bitcoin now, the 95K area resistance is sticking and a reversal pattern has appeared which adheres to the retrace scenario, but how far it retraces is up to Bitcoin. We have to wait and see what type of bullish reversals appear and where they appear before RISK can be assessed for a swing trade on this time frame.
Markets that linger around levels can be very hard to trade if you are the type that forces trades or assert opinions. Slow grinds are especially tough to sit through which is why I always suggest evaluating smaller time frames while keeping this bigger picture in mind. There are plenty of smaller opportunities to capitalize on if you can recognize the support/resistance levels and trend structure on the smaller time frames without losing site of the bigger picture.
On this time frame for swing trades, I am not interested in the short side. I prefer to wait for the retrace (wave iv) measure to see how far it goes, WAIT for the reversal confirmation, then quantify the RISK from that point. IF this scenario appears, I would be anticipating a retest of the 100K resistance and expecting a greater chance of a breakout to a higher high (low to mid 100ks)? This can take at least two weeks to play out in my opinion. And if this scenario does not play out, then adjust to the whatever new information the market is presenting.
Thank you for considering my analysis and perspective.

BTC - Will history repeat itself?In this description, I will compare the current price action of BTC with the market behavior seen in 2021. Both cycles share notable similarities in their structure.
-------------------------------
2021 bullmarket
During the 2021 bull market, BTC displayed classic topping price action. The chart showed slightly higher highs and higher lows, eventually forming a bearish Head & Shoulders pattern. This signaled a shift in momentum, and BTC subsequently broke down, confirming the bearish outlook.
At the lows later in 2021, Bitcoin’s price action became more corrective, with slightly lower lows and lower highs-often an early indication of a potential trend reversal. That reversal materialized as BTC launched into a strong impulse move to the upside, rallying all the way to the key Golden Pocket Fibonacci level before experiencing a modest retracement.
Following this healthy pullback, BTC gathered enough strength to break through resistance and surge to a new all-time high (ATH), which ultimately marked the peak of that bull cycle.
-------------------------------
This bullmarket
In the current bull market, BTC formed a classic double top pattern, echoing similar setups from previous cycles. After reaching highs near $110k BTC experienced a significant correction, dropping to around $74k. At this level, the price action turned corrective, with a series of slightly lower lows and lower highs-reminiscent of the consolidation seen at the 2021 market bottom.
During this consolidation, BTC established three notable lows, forming a potential base for a reversal. Following this corrective phase, BTC surged upward in a strong impulse move, reaching the critical Golden Pocket-the 61.8% to 65% Fibonacci retracement zone, which is widely regarded as a key area for potential reversals or continuation of trends.
Currently, BTC is consolidating near this Golden Pocket. Traders are watching closely to see if the price will face rejection here, as it did in 2021, or if it can break above and sustain a new uptrend. The outcome at this level will likely determine whether the next major move is a continuation to new highs or a deeper retracement.
-------------------------------
Conclusion
When comparing the corrections following the 2021 and 2025 peaks, the similarities are striking. Both cycles feature a bottom formed through a similar pattern, followed by a strong move up to the Golden Pocket Fibonacci level. The key question now is whether BTC will experience another corrective pullback before making a renewed attempt at the all-time high, or if it will break through resistance and continue its upward momentum. Only time will tell which path the market will choose.
-------------------------------
Thanks for your support.
- Make sure to follow me so you don't miss out on the next analysis!
- Drop a like and leave a comment!

BITCOIN - Bullish Continuation After BreakoutCOINBASE:BTCUSD has broken above a key daily resistance zone and is now pulling back for a potential retest. This area previously acted as a resistance and may now serve as support, aligning with a potential bullish continuation.
If buyers confirm support at this level, price is likely to continue upward toward the 102,000 level, which serves as a logical target based on previous structure. Conversely, a failure to hold this support could signal a potential shift and invalidate the bullish continuation.
Traders should monitor for bullish confirmation signals, such as bullish engulfing candles, strong wick rejections from the support zone, or increased buying volume, before considering long positions.

(BTC/USD) 1H Trade Setup – Key Entry, Stop Loss & Dual TargetEntry Point: 95,431
Stop Loss: 95,264
Target Points:
Upside (Target 1): 100,674 (Potential gain: +5.36%)
Downside (Target 2): 86,614 (Potential loss: -7.57%)
Trade Setup:
Risk-Reward Ratio:
Approx. 1:0.7 (Not ideal; the reward is smaller than the potential loss)
Support Zones:
Highlighted in purple beneath the entry zone — this indicates a historically strong support area.
Resistance Zones:
The upper purple zone marks the next significant resistance around 100,000–100,795.
Technical Indicators:
50 EMA (Blue Line): Indicates mid-term trend support, currently holding price action.
Price Action: BTC appears to be retracing toward support after a bullish rally.
Interpretation:
The setup implies a long (buy) position with a very tight stop loss.
The price is nearing a support zone, and if it holds, there's potential for an upward move to the target at 100,674.
However, if price breaks below 95,264, a sharp drop to 86,614 is anticipated.

SPY/QQQ Plan Your Trade For 5-2-25 : Major CRUSH PatternToday's pattern is a Major CRUSH pattern in Counter-Trend mode. These types of patterns (CRUSH patterns) are usually very large range bars that move against the current price trend. A Counter-trend Major CRUSH pattern would likely be a huge bar that moves counter to a counter-trend - thus potentially BULLISH.
Today, I have my reservations related to how this Major Crush pattern will setup. As I stated in my video, yesterday's price bar setup an Island type of bar (in an Evening formation) which is very typical of a topping pattern.
Today, I'm expecting the markets to sell downward into the Major CRUSH pattern. I believe the move of my MRM system into Bullish Trending yesterday sets up a perfect opportunity for the markets to shake out the longs on a big CRUSH pattern today.
But, I've also highlighted bullish breakaway levels on the SPY/QQQ chart for traders to be prepared for any outcome today.
In short, I believe the May 2-5 Major Bottom aligns with this Major CRUSH pattern as a downward price trend today. But, I'll be prepared to take my lumps if I'm wrong and the markets rally straight upward.
Over the past few days, we've seen some interesting developments in China and other places. I do not believe the US market is immune from the global slowdown which is taking place right now. Therefore, I urge traders to continue to stay protected from risks and to keep allocation levels rather small.
It may seem like a fantastic time to throw out some big trades - but it is still very dangerous in this extreme volatility.
I see Gold and Silver trying to base/bottom near recent lows over the next 5+ days. I still believe Gold will be trading at or near $4100 before the end of May.
Bitcoin seems to have followed the SPY/QQQ upward since April 21. I believe this is pure speculation. I'm still very cautious of a breakdown in the markets right now.
Let's see how this Major CRUSH pattern plays out.
It should be interesting - one way or the other (again, I'm still leaning toward a BEARISH breakdown in price today).
Get some...
#trading #research #investing #tradingalgos #tradingsignals #cycles #fibonacci #elliotwave #modelingsystems #stocks #bitcoin #btcusd #cryptos #spy #gold #nq #investing #trading #spytrading #spymarket #tradingmarket #stockmarket #silver

BITCOIN is filling all gaps as it should.Bitcoin (BTCUSD) is having its strongest 1D green candle since April 22 (for now) and basically today's analysis is a continuation/ modification of our April 14 buy call (see chart below):
Our Target was $99500 but we now update it to $106000 as we see a different pattern through filling the Lower Highs gaps. As you can see, since BTC's April 07 bottom, the rebound has filled one Lower High of the downtrend after the other.
At the same time, it has posted identical rallies before consolidating, the 1st one +15.37% and the 2nd +15.11%. We are currently on the 3d and if it makes again +15.11%, then it gets us to $106.9k. That is marginally above the Lower High of January 30, practically the first Lower High after the January 20 All Time High (ATH).
Moreover, the 2.0 Fibonacci extension level is at $106k and this is why we've moved our short-term Target there. This fills all dynamic conditions of this uptrend.
Do you think that's a fair estimate? Feel free to let us know in the comments section below!
-------------------------------------------------------------------------------
** Please LIKE 👍, FOLLOW ✅, SHARE 🙌 and COMMENT ✍ if you enjoy this idea! Also share your ideas and charts in the comments section below! This is best way to keep it relevant, support us, keep the content here free and allow the idea to reach as many people as possible. **
-------------------------------------------------------------------------------
💸💸💸💸💸💸
👇 👇 👇 👇 👇 👇

BITCOIN (BTCUSD): Will We Test 100k Support Soon?After a strong uptrend last week, ⚠️Bitcoin has paused its growth and is now consolidating. A familiar bullish pattern, an ascending triangle, is forming on the 4-hour chart.
Currently, the neckline of this pattern is being tested. If there is a breakout above 96,000 and a 4-hour candle closes above this level, it could signal a continuation of the bullish trend.
The price may rise to 68,000 and potentially test the resistance at 100,000.

SPY/QQQ Plan Your Trade For 5-6 : GAP Breakaway patternToday's pattern suggests a morning GAP will take place and price will continue to break away from yesterday's body range.
Given the fact that the markets are already almost 0.8-0.9% lower than yesterday's closing price level, this suggests the markets will continue to trend downward today.
Is this it? Is this the breakdown for May 2-5, seeking the Major Bottom I've talked about for the past 3+ weeks?
We'll find out over the next 5-10+ days.
Ultimately, the EPP patterns have aligned across multiple instruments/symbols to present a very clear opportunity to the downside. Now, we need to watch and wait as the markets should be moving into the early FLAGGING stage of the downward EPP pattern.
After the FLAGGING pattern, we should get the breakdown into consolidation, which is where I believe big profits can be made. That breakdown into the consolidation phase is usually very aggressive and can often be after the FLAGGING range.
Gold and Silver are making a move higher. I suggested this would be the case over the past 5-10+ days - but, boy, was it frustrating to watch Gold and Silver consolidate over the past few weeks.
At this point, I'm looking for Gold to rally above $3500 and for Silver to attempt to rally above $34.00.
Bitcoin seems to be leading the SPY/QQQ (again) and appears to be about 2-3 days ahead of the major US indexes, attempting to move into a downward FLAGGING formation.
This could be very interesting if BTCUSD continues to lead the SPY/QQQ. Meaning, we may be able to rely on the structures/setups in BTCUSD as a 2-3 day early window of that the SPY/QQQ may be doing (for a while). I'm sure it won't continue to align at some point in the future.
Again, I'm getting great comments from followers and subscribers. Thank you.
I'm doing my best to deliver the best research I can within these 15 to 20-min videos.
Get some.
#trading #research #investing #tradingalgos #tradingsignals #cycles #fibonacci #elliotwave #modelingsystems #stocks #bitcoin #btcusd #cryptos #spy #gold #nq #investing #trading #spytrading #spymarket #tradingmarket #stockmarket #silver

BITCOIN This is where the real BULL started in 2017.We've mentioned on numerous occasions how Bitcoin's (BTCUSD) current Cycle resembles that of 2014 - 2017 and this evidence is self-explanatory on the chart. What we want to bring forward today, and the timing couldn't be better, is that symmetrically speaking, it was the exact same time of the year (April 2017) when the past Cycle started printing predominantly green candles that lasted until the very end of 2017 (December) and the Cycle Top.
The 3W RSI sequences are identical among the two fractals with a Pivot trend-line dominating both Cycles, first as a Resistance (red arrows) and then turned into Support (green arrows). Before the end-of-year Parabolic Rally, the Bull Cycle was classified into 3 pull-back/ consolidation Phases (blue Rectangles) and, no surprise, the mini rallies started around the same times.
Can this indicate that we are about to see a strong rally of predominantly green candles towards the end of the year to form the new Cycle High? What do you think?
Feel free to let us know in the comments section below!
-------------------------------------------------------------------------------
** Please LIKE 👍, FOLLOW ✅, SHARE 🙌 and COMMENT ✍ if you enjoy this idea! Also share your ideas and charts in the comments section below! This is best way to keep it relevant, support us, keep the content here free and allow the idea to reach as many people as possible. **
-------------------------------------------------------------------------------
💸💸💸💸💸💸
👇 👇 👇 👇 👇 👇

Hellena | BITCOIN (4H): LONG to resistance area of 101,000.Dear colleagues, in the coming week I expect price to continue rising in wave “5”. I think that wave “3” is already completed and now we are witnessing a small correction.
Reaching the resistance area of 101,000 will be the end of the big “ABC” correction.
The 91,601 area could be a good support area to complete the correction.
Manage your capital correctly and competently! Only enter trades based on reliable patterns!

BRIEFING Week #18 : Waiting for RotationHere's your weekly update ! Brought to you each weekend with years of track-record history..
Don't forget to hit the like/follow button if you feel like this post deserves it ;)
That's the best way to support me and help pushing this content to other users.
Kindly,
Phil

BTC Roadmap — May 2025🚨 BTC Roadmap — May 2025
Here’s the timeline you’ll want to pin and come back to.
⸻
🔴 May 4–6
Low volume. No major moves expected.
BTC goes DOWN and BTC dominance starts trending down, but it’s not the moment to jump in yet. Patience.
🟢 May 7–9: ALT PUMPS
BTC Volume increases!
BTC UP
This is the first major altcoin opportunity.
🔴 May 10–13: SELL SIGNAL
This is your exit window.
1D SELL confirmed. Prepare for cooling.
BTC Volume drops.
⚪️ May 15–17: May USDT.D will go UP!
USDT dominance reaches a local bottom - BTC HUGE DUMP .
BTC Volume rises again → BIG MOVE up after 17th.
🟢 May 17–20: BTC and ALT PUMPS
Perfect LONG entry zone.
🔴 May 21–23: USDT HIGH — market will go UP faster!
USDT.D peaks. BTC and altcoins prepare for breakout.
BTC Volume high.
💸 Dollar weakens → Risky assets explode (BTC, alts, growth)
⸻
NOT FINANCIAL ADVICE

SPY/QQQ Plan Your Trade For 4-29 : BreakAway in CarryoverToday's pattern is a Breakaway in Carryover mode.
That suggests today's price move will attempt to break away from yesterday's body range and may be somewhat similar to yesterday's price action.
I interpret this pattern as a potential breakdown (breakaway) attempting to possibly find support below 540.
Remember, we are moving into the May 2-5 Major Low cycle pattern - so price should attempt to move downward at this stage.
Gold and Silver are moving through a consolidated topping phase. Where price attempts to push higher through a series of tops. Ultimately, I believe Gold and Silver will make a big breakout move higher (above $3500, $35.00) and attempt to rally up - breaking the $4200+ level (eventually).
Bitcoin seems to be stalling, like the SPY/QQQ, near upper resistance (near the FIB 50% level).
I see this stalling as the markets searching for a trend.
As I keep saying, I have a hard time seeing any reason why the markets will rally to new ATHs in the current environment (except the possibility of pure speculation).
We need to see some real growth expectations for the markets to begin another big rally phase.
Right now, I'm looking for confirmation of my breakdown into the May 2-5 Major Bottom pattern. Let's see if that actually happens or not.
Get some.
#trading #research #investing #tradingalgos #tradingsignals #cycles #fibonacci #elliotwave #modelingsystems #stocks #bitcoin #btcusd #cryptos #spy #gold #nq #investing #trading #spytrading #spymarket #tradingmarket #stockmarket #silver

Bitcoin- $90k Surge Before a Major Drop?Bitcoin is showing signs of a potential rally towards $90k, but could this be a trap before a deeper correction to $45k?
What's your take?
Will BTC reach new highs first, or is the drop coming sooner?

Bitcoin Outlook May 5th – Short, Swing, & Long-Term Views1/ Short-Term (Intraday): Chop City
BTC is stuck in a tight range between 95K (demand) and 98K (supply). Oscillators mixed, momentum fading near resistance.
Play: Fade extremes, scalp carefully.
Watch: Breakout above 98K or breakdown below 95K for momentum triggers.
2/ Swing Traders (Days–Weeks): Cautiously Bullish
Weekly bullish structure intact, but daily charts flashing caution (Three Black Crows, Double Top, RSI stretched).
Ideal scenario: Buy dips near 96K–95K if momentum resets bullishly.
Invalidation: Daily close below 94.5K flips bias neutral/bearish.
3/ Long-Term Investors (Months+): Bullish with Caution
Macro backdrop remains supportive (SPX bullish, DXY weak, yields stable/rising). Institutional BTC flows steady.
BUT monthly chart shows bearish divergence—momentum slowing.
Core strategy: Accumulate on major dips (ideal: 87K–76K).
Critical invalidation: Monthly close below $76K demands risk-off rebalance.
4/ Macro Catalysts to Watch
- Equity markets (SPX) & bond yields (US10Y) maintaining risk-on stance.
- USD weakness (DXY bearish) supports BTC upside.
- Watch ETF news, institutional flows, and altcoin rotation signals for early clues.
5/ Risk Management
Short-term: Tight stops, quick profits.
Swing: Respect daily structure; cut below $94.5K.
Long-term: Hold bullish conviction above $76K monthly support.
Bottom Line for Traders & Investors
- Short-term: Range-bound scalps
- Swing: Buy dips cautiously
- Long-term: Bullish, but respect slowing momentum
Stay agile, manage risk, and trade smart. Good luck this week! 🍀

BITCOIN 1st 1W MACD Bullish Cross in 7 months!Bitcoin (BTCUSD) is ahead of completing this week a Bullish Cross on its 1W MACD, which will be the first one after 7 months (since October 14 2024).
This is a major technical bullish development as since the very first one (Sep 26 2022) right before the November 21 2022 Bear Cycle bottom, it has always kick-started the Bullish Legs of this 2.5-year Channel Up.
In addition to that, this was accompanied by an Ichimoku Bullish Cross, where the Conversion Line (green) crossed above the Base Line (black). Considering also that exactly 4 weeks ago BTC found Support and rebounded on the 1W MA50 (blue trend-line), we can safely confirm a Bottom there and call for the minimum +100.73% rise, similar to the first Bullish Leg of this Channel Up. We remain consistent to our $150000 Target.
So do you think this 1W MACD Bullish Cross is the final confirmation we need for the new Bullish Leg? Feel free to let us know in the comments section below!
-------------------------------------------------------------------------------
** Please LIKE 👍, FOLLOW ✅, SHARE 🙌 and COMMENT ✍ if you enjoy this idea! Also share your ideas and charts in the comments section below! This is best way to keep it relevant, support us, keep the content here free and allow the idea to reach as many people as possible. **
-------------------------------------------------------------------------------
💸💸💸💸💸💸
👇 👇 👇 👇 👇 👇

Short-term BTC (Long & Short) Strategies12HR Supply Box
MITIGATED FVG
Only look for "Missed Pivot" Indicator and a pin bar candle to plan a short entry
SL is going to be swing high above pinbar candle
BTC bullish if BTC breaks 95,164.3 on 1D chart (in 13hr) to long $96,484.1 (1.38%)
If market drops below 95,164.3,
buy Long on 20 day average (around $90,126) or
Buy at $93,802.5 @ Support (BUT must see Pin bar Support Candle w/ "Missed Pivot" signal indicator) SL below the pinbar
Tip: only open trade on TAP new FVG
This is only suggestion, trade responsibly.

BTC/USD 4H Chart Setup – Bullish Breakout Targeting $104K1. Trend Direction
⬆️ Uptrend Detected
* Price is forming higher highs and higher lows
* Trading inside a bullish channel
* Breakout potential above the top trendline.
2. Key Zones
🟦 Support Zone: $95,252.31
* Labeled as RBS + RBR ZONE
* Strong buy area → previous resistance turned support
* Perfect area to catch a bounce
📏 Support Line & Trendline
* Trendline keeps price supported along the climb
* Acts as a launch pad for the next move.
3. EMA 70 (📉 Red Line)
* Current value: $93,636.88
* Price is above EMA, showing strong bullish pressure
* EMA acts as dynamic support.
4. Trade Setup
🎯 Target Point: $104,000
🟦 Target Zone: $103,918.60 – $104,747.91
🔥 Entry Zone: $95,252.31 (marked blue box)
⚠️ Stop Loss: $94,091.28
* Positioned safely below support
* Good Risk/Reward Ratio.
5. Extra Cues
📅 Economic event icons near May 3–6 → Potential volatility ahead
⚡ Pullback in progress → May offer a buying opportunity.
Conclusion
🚀 Bullish Setup!
* Watch for a bounce from the blue demand zone
* Targeting $104K breakout
* Strong support + momentum = solid long opportunity.

$100k Bitcoin IMMINENT? Price Ignites After Major Surge!The cryptocurrency market is once again crackling with energy, and at the heart of the storm stands Bitcoin (BTC). The world's largest and original cryptocurrency is staging a remarkable comeback, shattering recent resistance levels and reigniting fervent speculation about its potential to not only revisit but decisively conquer the psychologically potent $100,000 milestone. Following a period of consolidation and downward pressure, a powerful surge has propelled Bitcoin to its highest price point in over ten weeks, signaling a potential paradigm shift in market sentiment and trading behavior.
The Breakout: Shaking Off Recent Slumber
The recent price action has been decisive. Bitcoin climbed as much as 3.1% to achieve a weekly high of $97,483. This marks the most robust price level observed since February 21st, representing a significant break from the sideways and sometimes downward trajectory that characterized parts of the preceding weeks. The memory of Bitcoin crossing the $100,000 threshold on February 7th is still fresh, adding weight to the current push towards that level.
This upward momentum provides a stark contrast to the market conditions seen earlier. There is downward pressure attributed to geopolitical factors and economic policies, such as potential tariff implementations, which had previously triggered sell-offs impacting both traditional stock markets and the digital asset space. Furthermore, the market had to digest a significant correction following Bitcoin's earlier peak. While the specifics of past peaks can be debated based on different exchange data, the narrative of a significant pullback followed by the current strong recovery is clear. Bitcoin weathered a period where it seemed momentum might stall, but the bulls have evidently returned with renewed vigor.
Shifting Market Dynamics: From Macro-Driven to Momentum-Fueled
Perhaps one of the most crucial insights from the current rally is the apparent shift in what's driving price action. For much of the past year or two, Bitcoin's price movements often seemed heavily correlated with macroeconomic factors – inflation data releases, central bank interest rate decisions, geopolitical tensions, and regulatory pronouncements. While these factors undoubtedly still play a role, the current surge suggests a transition towards a market more heavily influenced by internal dynamics: spot market demand and trading momentum.
There are traders who are increasingly reacting to price action itself, buying into strength and potentially creating a self-reinforcing cycle. The focus is less on predicting the next Federal Reserve move and more on the immediate supply and demand dynamics visible on exchanges.
Bitcoin isn't entirely decoupled from macro trends, but its internal market structure, particularly the influence of new financial instruments like ETFs and strong spot buying, is asserting greater influence on short-to-medium term price discovery.
The ETF Factor: Opening the Floodgates for Capital
The launch and subsequent success of spot Bitcoin ETFs in the United States have been a game-changer, and their impact is arguably a primary catalyst for the current bullishness. These regulated investment vehicles provide traditional investors and institutions with a familiar and accessible way to gain exposure to Bitcoin without directly holding the underlying asset. The result has been a torrent of new capital flowing into the market.
There has been a staggering inflow of over $3.2 billion entering Bitcoin and Ethereum tracking ETFs in the preceding week alone. BlackRock's Bitcoin Trust ETF (IBIT), a major player in the space, recorded nearly $1.5 billion in inflows during that period, marking its highest weekly intake for the year according to Bloomberg data.
These inflows are not just numbers on a spreadsheet; they translate directly into buying pressure in the spot market. ETF issuers must purchase actual Bitcoin to back the shares they issue to investors. This sustained, large-scale buying provides a powerful tailwind for the price, absorbing sell orders and driving the market upwards. The success of these ETFs also lends legitimacy to Bitcoin as an asset class, potentially encouraging further adoption and investment from previously hesitant institutional players. The "demand" aspect of the current rally is heavily underpinned by this ongoing ETF phenomenon.
Options Market Signals: Betting Big on $100,000
Further evidence of the bullish sentiment surrounding Bitcoin, particularly the $100,000 target, comes from the derivatives market, specifically options trading. Options contracts give traders the right, but not the obligation, to buy (call option) or sell (put option) an asset at a specific price (strike price) before a certain expiration date.
According to data from Coinglass and the major crypto options exchange Deribit, demand for upside options has surged. Notably, call options with a $100,000 strike price exhibit the most significant open interest across various expiration dates. Open interest represents the total number of outstanding contracts that have not yet been settled. High open interest in $100k call options indicates that a large number of traders are positioning themselves to profit from Bitcoin reaching or exceeding this level. While options data reflects expectations rather than guarantees, such concentrated betting on a specific upside target underscores the powerful psychological pull of the $100k mark and the conviction held by a significant segment of the market.
Warming Up: Reading the Technical and On-Chain Pre-Rally Signals
Beyond the ETF flows and options market sentiment, analysts are pointing to various technical and on-chain indicators suggesting Bitcoin is indeed "warming up" for a potentially larger move, exhibiting signals seen before previous major breakouts. This aligns with the theme of "Bitcoin Flashing Pre-Rally Signals Seen Before Major 2024 Breakouts."
• Technical Analysis:
o Breaking Resistance: The surge above the 10-week high ($97,483) was a critical technical breakout, overcoming a level that had previously capped price advances. Holding above this level turns former resistance into potential support.
o Moving Averages: Traders watch moving averages closely. A "Golden Cross" (where a shorter-term moving average, like the 50-day, crosses above a longer-term one, like the 200-day) is often considered a strong long-term bullish signal. While specific configurations vary, bullish alignment of key moving averages often precedes sustained rallies.
o Momentum Indicators: Indicators like the Relative Strength Index (RSI) and Moving Average Convergence Divergence (MACD) can signal building momentum. An RSI breaking above key levels without yet reaching extremely overbought territory, or a bullish MACD crossover, can suggest further upside potential.
o Volume Confirmation: Crucially, significant price breakouts should ideally be accompanied by strong trading volume, indicating conviction behind the move. Analysts look for volume confirmation to validate the strength of the rally.
• On-Chain Analysis: On-chain data provides insights into the behavior of Bitcoin holders and network activity.
o Exchange Outflows: Sustained periods where more Bitcoin is withdrawn from exchanges than deposited often suggest investors are moving coins to private wallets for long-term holding ("HODLing"), reducing the immediately available supply for sale.
o Accumulation Trends: Metrics tracking the behavior of large holders ("whales") and long-term holders can reveal accumulation patterns. Increased buying from these cohorts is typically seen as bullish.
o Supply Dynamics: Indicators looking at the supply held by short-term versus long-term holders, or metrics like the Long-Term Holder Spent Output Profit Ratio (LTH-SOPR), can gauge whether significant profit-taking is occurring that could stall a rally. A low LTH-SOPR might suggest long-term holders are not yet selling aggressively.
o Funding Rates: In the perpetual futures market, positive funding rates generally indicate that traders holding long positions are paying those holding short positions, suggesting a bullish bias in the derivatives space.
When multiple technical and on-chain indicators align, as some analysts suggest is happening now, it builds a stronger case that the market is preparing for a significant move, lending credence to the "pre-rally signals" narrative.
Mapping the Path to $100k and Beyond: Three Potential Scenarios
While the current momentum is palpable, the path forward is never certain. Analysts are mapping various possibilities, acknowledging both the bullish potential and the inherent risks. Here are three broad scenarios that could unfold:
1. The Momentum Continuation Scenario: Fueled by continued strong ETF inflows, positive market sentiment amplified by the $100k narrative, and potentially favorable (or at least neutral) macroeconomic developments, Bitcoin continues its ascent relatively unimpeded. It decisively breaks the $100,000 barrier, potentially triggering a wave of Fear Of Missing Out (FOMO) from retail investors and further institutional interest. In this scenario, the market quickly looks towards higher targets, exploring price discovery in uncharted territory above $100k (or above its previous ATH depending on the data source used). Key challenges would be maintaining buying pressure and overcoming psychological resistance levels beyond $100k.
2. The Consolidation and Recharge Scenario: Bitcoin's rally meets significant resistance near or just below the $100,000 level. Profit-taking increases, and early ETF buyers might look to secure gains. Instead of a sharp rejection, the price enters a period of consolidation – trading sideways within a defined range or experiencing a moderate pullback. This phase allows the market to digest recent gains, build a stronger base of support (potentially around the recent breakout level near GETTEX:97K or slightly lower), and allows moving averages to catch up. If support holds and buying demand re-emerges (perhaps triggered by fresh ETF inflows or positive news), this consolidation could form the launchpad for the next sustained leg up towards and beyond $100k. This scenario tests the resilience of the buyers.
3. The Macro Headwind or Correction Scenario: Despite the strong internal dynamics, external factors reassert control. An unexpected negative catalyst emerges – perhaps significantly worse-than-expected inflation data forcing a hawkish central bank response, a major geopolitical escalation, unforeseen regulatory action against crypto, or a sharp downturn in traditional markets triggering widespread risk-off sentiment. Alternatively, the rally could simply run out of steam, hitting a "sell wall" at $100k that overwhelms buying pressure, leading to a sharper correction back towards lower support levels ($90k, $85k, or even lower). This scenario underscores the ever-present volatility and risk in the crypto market, reminding investors that parabolic runs can face abrupt reversals.
The Crucial Question: Can BTC Buying Demand Meet the Challenge?
Ultimately, whether Bitcoin successfully retests and surpasses $100,000 hinges on the sustainability of the current buying demand. Several factors support continued demand:
• Ongoing ETF Flows: As long as institutions and retail investors continue allocating capital to spot Bitcoin ETFs, this provides a consistent source of buying pressure.
• Growing Adoption Narrative: Each price surge and new institutional product launch reinforces the narrative of Bitcoin's growing acceptance and potential role as a store of value or portfolio diversifier.
• Halving Effect (Long-Term): While the Bitcoin Halving (reduction in new supply issuance) is a past event, its long-term supply-constricting effects are believed by many to contribute to price appreciation over time.
• Potential Retail FOMO: A decisive break above $100k could capture mainstream media attention and trigger a wave of buying from retail investors fearing they might miss out on further gains.
However, potential headwinds exist:
• Profit-Taking: Investors who bought at lower levels, including early ETF participants, may look to lock in substantial profits as the price approaches major milestones.
• Regulatory Uncertainty: While ETFs marked progress, the broader regulatory landscape for crypto remains complex and subject to change globally.
• Macroeconomic Risks: Inflation, interest rates, and potential recessionary fears haven't disappeared and could resurface to dampen risk appetite.
• Market Saturation/Exhaustion: Rallies can lose momentum if buying power becomes exhausted without fresh catalysts.
The interplay between these forces will determine if the current buying wave has the strength and endurance to overcome sell pressure and propel Bitcoin into six-figure territory sustainably.
Conclusion: A Critical Juncture for Bitcoin
Bitcoin stands at a fascinating and potentially pivotal juncture. The recent surge, breaking a 10-week high and pushing towards the $100,000 horizon, is fueled by a powerful combination of factors unlike those seen in previous cycles. The institutional validation and massive capital inflows brought by spot Bitcoin ETFs represent a fundamental shift, seemingly driving a transition towards momentum and spot-demand-based trading. Bullish signals from the options market and various technical/on-chain indicators add fuel to the fire, painting a picture of a market "warming up" for potentially significant further gains.
Yet, the path to $100,000 and beyond is fraught with challenges. Market history teaches that parabolic advances often face corrections, and the ever-present risks of macroeconomic shifts and regulatory developments cannot be ignored. The sustainability of the current buying frenzy, particularly the crucial ETF inflows, will be rigorously tested as Bitcoin confronts the immense psychological and technical resistance clustered around the six-figure mark.
Whether Bitcoin achieves a swift breakout, undergoes a period of consolidation, or faces a pullback remains to be seen. However, the current price action and underlying market dynamics have undeniably reignited excitement and placed the $100,000 target firmly back in the spotlight, marking a critical chapter in Bitcoin's ongoing evolution within the global financial ecosystem. Investors and observers alike will be watching intently to see if the current surge has the power to meet the demand challenge and etch a new all-time high into the history books.
Disclaimer: The information presented in this article is for informational and educational purposes only. It is based on the analysis of the provided source material and general market knowledge. It does not constitute financial advice. Investing in cryptocurrencies involves significant risk, including the potential loss of principal. Readers should conduct their own thorough research and consult with a qualified financial advisor before making any investment decisions.

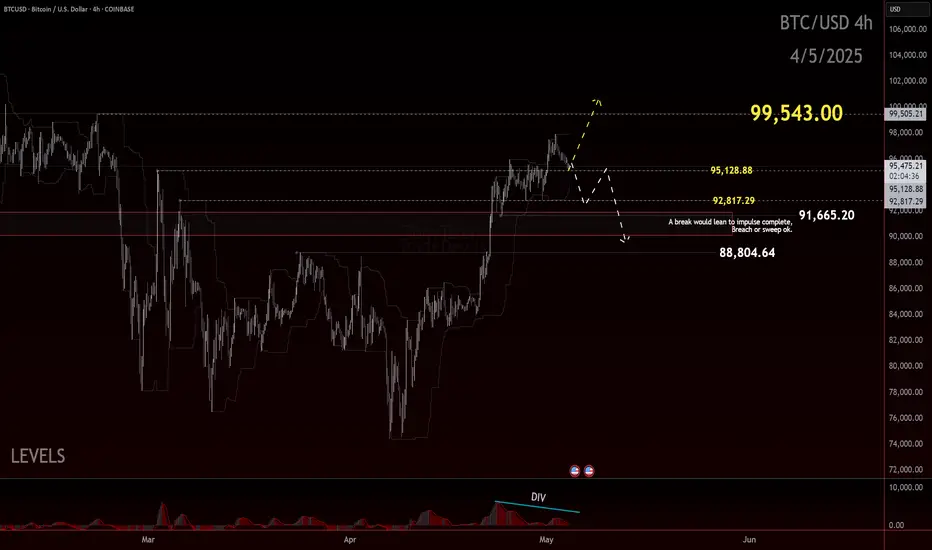
BTC: Balancing on the EdgeBitcoin held the $90.5K level and managed to flip prior resistance into support—an encouraging development, especially given how close price was hovering to the so-called danger zone. That flip marked a technical win for bulls, signaling potential strength in the short-term structure.
However, we’re not entirely out of the woods just yet.
While price is holding above support and showing some resilience, we’re still trading uncomfortably close to the edge of the recent consolidation zone. For now, $91.5K stands as the ideal level to hold.
The concern? If price starts slipping back below this newly established support, especially with conviction, that could be a signal of deeper retracement on the table. The bullish narrative would weaken significantly if we revisit and fail to defend those levels, potentially opening the door for a more sustained correction.
So, while the short-term structure remains cautiously optimistic, this isn’t the time for complacency. The market’s still in a precarious spot, and clarity will only come with either continued strength—or a confirmed break below support.
Eyes on $91.5K for now. Hold that, and the momentum favors the bulls. Lose it, and the deeper pullback scenario comes back into play.
Trade Safe, Trade Clarity.