BTC/USD "Bitcoin vs U.S.Dollar" Crypto Market Heist (Swing/Day)🌟Hi! Hola! Ola! Bonjour! Hallo! Marhaba!🌟
Dear Money Makers & Robbers, 🤑💰✈️
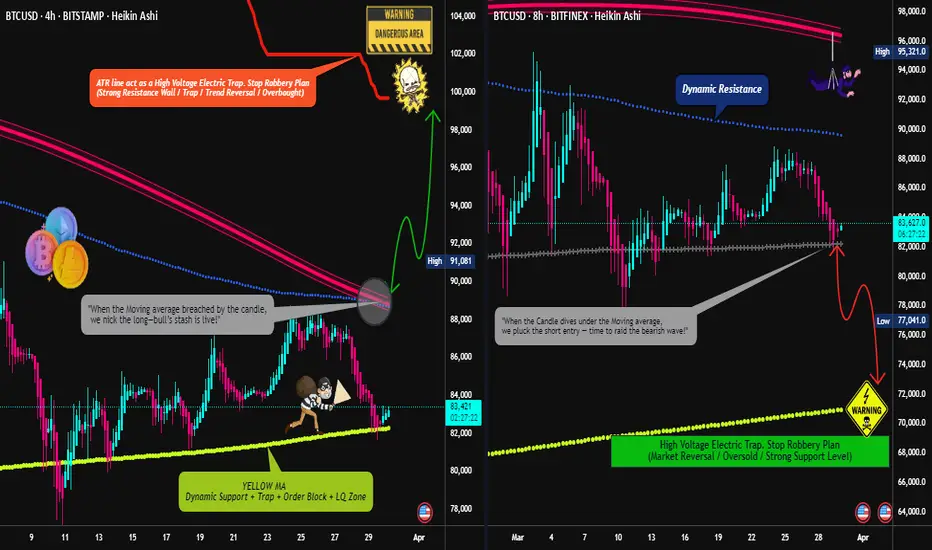
Based on 🔥Thief Trading style technical and fundamental analysis🔥, here is our master plan to heist the BTC/USD "Bitcoin vs U.S.Dollar" Crypto Market. Please adhere to the strategy I've outlined in the chart, which emphasizes long entry and short entry. 🏆💸Be wealthy and safe trade.💪🏆🎉
Entry 📈 :
"The loot's within reach! Wait for the breakout, then grab your share - whether you're a Bullish thief or a Bearish bandit!"
🏁Buy entry above 89000
🏁Sell Entry below 81000
📌However, I recommended to place buy stop for bullish side and sell stop for bearish side.
Stop Loss 🛑:
🚩Thief SL placed at 84000 for Bullish Trade
🚩Thief SL placed at 88000 for Bearish Trade
Using the 4H period, the recent / swing low or high level.
SL is based on your risk of the trade, lot size and how many multiple orders you have to take.
Target 🎯:
🏴☠️Bullish Robbers TP 99000 (or) Escape Before the Target
🏴☠️Bearish Robbers TP 72000 (or) Escape Before the Target
BTC/USD "Bitcoin vs U.S.Dollar" Crypto Market Heist Plan is currently experiencing a neutral trend,., driven by several key factors.
📰🗞️Get & Read the Fundamental, Macro, COT Report, On Chain Analysis, Sentimental Outlook, Intermarket Analysis, Future trend targets.. go ahead to check 👉👉👉🔗
⚠️Trading Alert : News Releases and Position Management 📰 🗞️ 🚫🚏
As a reminder, news releases can have a significant impact on market prices and volatility. To minimize potential losses and protect your running positions,
we recommend the following:
Avoid taking new trades during news releases
Use trailing stop-loss orders to protect your running positions and lock in profits
💖Supporting our robbery plan 💥Hit the Boost Button💥 will enable us to effortlessly make and steal money 💰💵. Boost the strength of our robbery team. Every day in this market make money with ease by using the Thief Trading Style.🏆💪🤝❤️🎉🚀
I'll see you soon with another heist plan, so stay tuned 🤑🐱👤🤗🤩
BULLUSD trade ideas
The Black Swan Method- Making TA as a trader is like reading a magical ball but some major unpredictable events are out of control.
- i usually accurate most of the time but i should be a fool to think i am always right, it's impossible to make TA in that markets conditions.
- So this post is not to make some kind of predictions but to warn peoples on what's going on right now.
- i will try to explain very basically the situation (with my bad english skills, so forgive me if i make some mistakes) :
1/ the first attack was based on Luna and UST, some entities started to short UST/Luna with some billions $, FTX and SBF surely did it. Luna tried to save the situation with their BTC reserve but it was effortless. they lost all. (Luna have never been hacked, important to specify this )
2/ the fail of UST was the first step to create a snowball effect.
3/ 3AC, Celsius, Voyager, and much more were all involved in Luna/UST and Anchor Protocol witch was giving 18% returns on UST. They used customers funds in UST and staked, when the situation started to turn really bad for Luna, they tried to save the situation trading customers funds and they failed. (any of those companies have been hacked, important to specify this )
4/ FTX used customers funds and started to short their own products, FTT, SOL, SRM, etc , Binance saw the move and twitted that they will drop all their FTT.
FTX locked their customers wallets. FTX used 8B$ Customers funds to short markets. they are still right now trying to short USDT on Binance. (FTX have never been hacked, important to specify this).
5/ The snow ball started to be transformed in an avalanche. The damage here is huge. An exchange implosion of this magnitude is a gift to bitcoin haters all over the world.
6/ Sam bankman-fried was a Trojan horse in the crypto space, surely backed by banks and govs, a kind of worm witch have to be eradicated.
7/ Soon bankers will tell you, " u saw what happened with your exchanges ??!!, better use CDBC and stick with Banks!! ", this is their ultimate goal.
- i pray for everyone who got caught up in this mess and lost money with those bad actors.
- i hope you take care of yourself and continue to be a part of this journey.
- i hope it doesn't turn you off of crypto witch are here to stay in the future.
- BTC is resilient. No matter the magnitude of the earthquake.
- Buy BTC
- Store in Ledger, Trezor or Paper Wallet.
- Hodl and come back later.
Have faith in what you believe and fight. Thanks for reading!
PS : Not sure this post will get me banned or censored, but at this point the freedom of speech is an human right.

BTCUSDT IN A SYMMETRICAL TRIANGLE CONSOLIDATION Price formed a symmetrical triangle consolidation around the current Price of $85,189 i anticipate a bullish breakout to 86945 a buy opportunity is envisaged

BTCUSD (M30) NEW ANALYSIS RSI BULLISH
**🔹 Trend:** Short-term consolidation, larger trend still bullish
**🔹 Your Avg. Entry:** ~$83,500
**🔹 Immediate Resistance:** $84,600 – $85,200
**🔹 Strong Resistance:** $86,000 – $86,800
**🔹 Support Zone:** $83,000 – $82,600
**🔹 Key Psychological Level:** $80,000
---
### 📈 Trade Management
**✅ Targets:**
- **TP1:** $84,800 (previous rejection zone)
- **TP2:** $85,800 (near-term high)
- **TP3 (if momentum strong):** $86,800 – $87,200
**❌ Stop-Loss Options:**
- Conservative: Below $82,500
- Aggressive: Below $81,900 (structure breakdown confirmation)
**🔁 Add More?**
- Optional last buy zone: $82,600 – $81,800 (only if BTC shows wick + strong bounce on M30 or H1)
---
### 📊 Indicators to Watch (on M30)
- **RSI > 50:** Bullish continuation
- **MACD crossover + histogram green:** Strength building
- **Price holding above EMA50:** Trend intact
---
🔒 Risk Tips
- Use trailing SL if price breaks $85.5k+
- Be cautious if price breaks down and consolidates below $82.5k (could flip bias to bearish)
- Don’t overleverage near resistance

2018 Cycle Repeat? Bullish Bitcoin Until End of YearSee my DXY analysis for my full view on the performance on bitcoin (and other risk assets as well)
-Summary- bullish like 2018 until end of year.
-This chart pointing out time frames of past cycles, the over all market structure of bitcoins price, and the transformation of a bullish trend into the parabolic. (where I think we are now)

BTCUSD Liquidity SweepAll my trade entry are based on volume and liquidity and that’s what the market respect.
I’m currently long on BTCUSD

BTCUSD swing shorts setupBTCUSD has been trading within a tight consolidation range on the daily timeframe, indicating market indecision and potential buildup of liquidity. After this extended period of sideways movement, we anticipate a bearish breakout as the market seeks to sweep liquidity below the current range.
Price has failed to make a strong higher high, suggesting weakening bullish momentum. If BTC breaks below the range support and confirms with a retest, this could be a strong signal for short entries. Key support levels and order blocks should be monitored for confirmation.
Confluences for the short bias:
Loss of bullish momentum on daily candles
Liquidity resting below the consolidation range
Potential break of market structure
Bearish divergence on RSI (if applicable)
Proximity to a key resistance zone or supply area

Bitcoin short from 95500$Waiting for 95.5k npoc level and i am entering short , target 91k and 86k.
Lets see what this pump brings on.
We can also see 98k npoc close , if that does more agressive on shorts.

BTC -- BearishBTC bearish believe it should drift down to around 67k ish according to price action, and pattern

Bitcoin is going higherThrough my analysis I have seen that Bitcoin is gonna move a little higher until Monday on New York station we know that the market will make a new high from the last week though

Bitcoin needs a upward correction.Market needs to full fill the upper side liquidity. BTC funding rate is also increasing. so there is a good possibility market will cover up the up side liquidity.

Technical Analysis for FX,Indices and many More!(Week 17,21Apr)Hello fellow traders , my regular and new friends!
Which pairs or instruments should we keep a look out for?
For me I am looking at :
EURUSD GBPUSD potential break up
EurAud EurNzd could hold, favor EurAud to long
USDJPY triangle to break lower
EURCAD or NZDCAD to long/
EURGBP (h&s)
BTC range play
This coming week is packed with interest rate decision, how?What to do?
Do check out my recorded video for more insights!
Do Like and Boost if you have learnt something and enjoyed the content, thank you!
-- Get the right tools and an experienced Guide, you WILL navigate your way out of this "Dangerous Jungle"! --
*********************************************************************
Disclaimers:
The analysis shared through this channel are purely for educational and entertainment purposes only. They are by no means professional advice for individual/s to enter trades for investment or trading purposes.
*********************************************************************

BTC Price Alert: Rejection from Major Supply Zone! Bitcoin just rejected the $85,554 supply zone for the third time, showing clear resistance on the 1H chart. With low momentum and repeated wicks at the top, a breakdown might be brewing.
Key Levels to Watch:
Supply Zone: $85,100–$86,000 (heavy resistance)
Support Zone: $83,383–$83,000 (demand cluster)
Bias: Bearish unless $85,554 is broken cleanly
What I’m Watching For:
If price closes below the mid-range (~$84,500), expect a quick move toward demand.
Break below $83,383 could open the door to $82,000.
Bullish invalidation only if we get strong volume above $86K.
Let me know in the comments: are you buying the dip or waiting for FWB:83K ?
#BTC #Bitcoin #CryptoTrading #SupplyAndDemand #PriceAction #LuxAlgo #BTCUSD #TechnicalAnalysis


Bitcoin at a resistance.If price breaks, we might see a continuation in rally. And if price bounces, we might see sellers taking lead for a while.

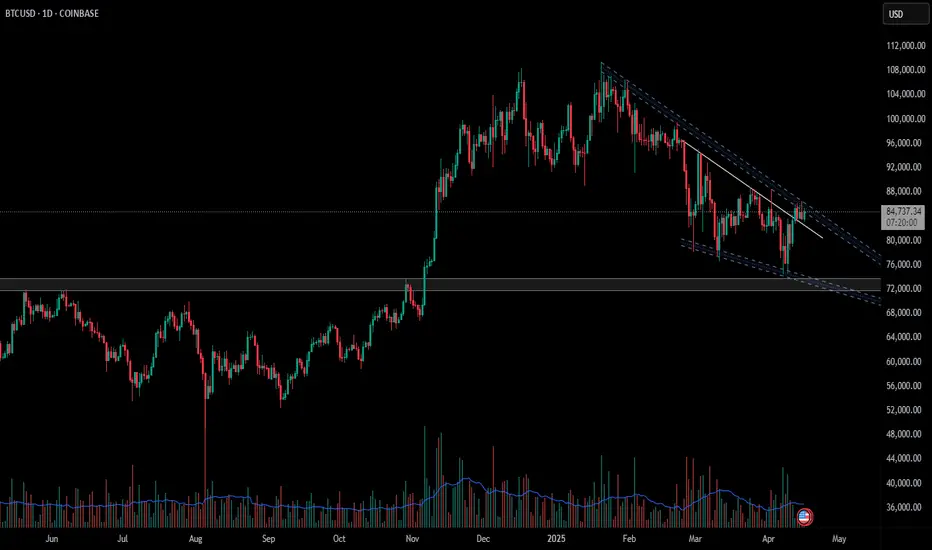
BTC/USD Technical Outlook📊 BTC/USD Technical Outlook
Rounded Top Formation signals exhaustion of bullish momentum.
Price respecting a descending channel, showing structured bearish correction.
Supply Zone: $96K–$100K – major resistance; price likely to reject here if tested.
Key Levels:
Support: $80.5K → $74.7K → $56K → $48.6K → $39.7K
Resistance: Descending trendline & supply zone
Two Scenarios:
✅ Bullish: Break above channel + $96K = retest ATH zone.
❌ Bearish: Rejection + break below $74.7K = targets $56K and lower.
Current Bias: Bearish unless breakout confirms above descending structure. 📉 Fundamental View
Bitcoin Halving supports long-term bullish case.
Fed’s policy & inflation will drive short-term volatility.
Institutional news already priced in; any surprises = big moves.

BITCOIN BEARS WILL DOMINATE THE MARKET|SHORT
BITCOIN SIGNAL
Trade Direction: short
Entry Level: 85,125.88
Target Level: 75,647.52
Stop Loss: 91,444.78
RISK PROFILE
Risk level: medium
Suggested risk: 1%
Timeframe: 1D
Disclosure: I am part of Trade Nation's Influencer program and receive a monthly fee for using their TradingView charts in my analysis.
✅LIKE AND COMMENT MY IDEAS✅

BTC Bitcoin crash to 55-57K next Sunday the 27th of AprilBack up the truck! We're crashing BTC to 55-57K next Sunday the 27th of April
May the Fork be with you!
NotTradingAdvice
YourOwnRisk
ResearchFractals
PitchForkTA
TheRoaring2020s
btc eth Crypto
@X3EM on BlueSky

BTC in 17 April 2025Potential Major Move on Thursday, April 17, 2025 📍
📊 Based on an analysis of historical Bitcoin chart averages and similar patterns, there is a likelihood of a significant price movement on this date.
This analysis is conducted using technical analysis and a detailed examination of Bitcoin’s movement averages. It suggests that approximately every 150 days after the start of a neutral trend, we can expect a sharp upward or downward move that sets the stage for the main trend in the future.
📅 As of the current date, March 29, 2025, there are about 18 days left until this significant event.
You can follow the results of this analysis and the conducted review on TradingView on the specified date.

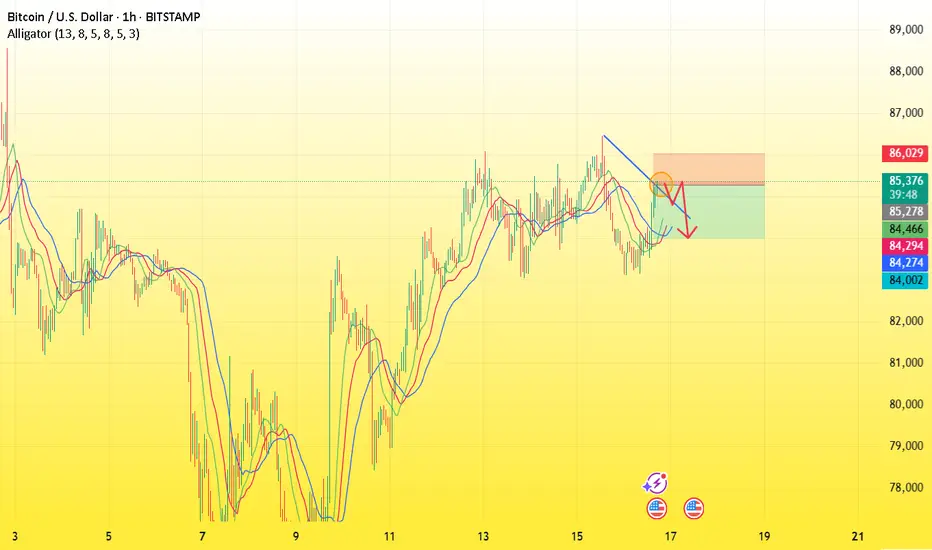
BTC USD ENTRY point 85200 target 84000 stop loss 86000Here's the setup for your BTC/USD short trade:
Entry: 85,200
Target: 84,000
Stop Loss: 86,000
Trade Breakdown:
Risk (SL - Entry): 800 pips
Reward (Entry - TP): 1,200 pips
Risk-to-Reward Ratio: 1:1.5 (solid)
Quick Tips:
Watch for a lower high or bearish candle formation at/near 85,200 before entry.
Set alerts near 84,400 to consider trailing your stop or partial close.
If BTC is trending strongly, wait for signs of exhaustion before entering short.
Need help stacking confluences for the trade or checking current market sentiment?
possible breakout for long term investment (1D TF chart)Previously, Bitcoin faced rejection and dropped sharply after touching the upper trendline. However, this time, it's showing strength by consolidating near the same level for the last 5 days. This could indicate accumulation or a potential breakout attempt.
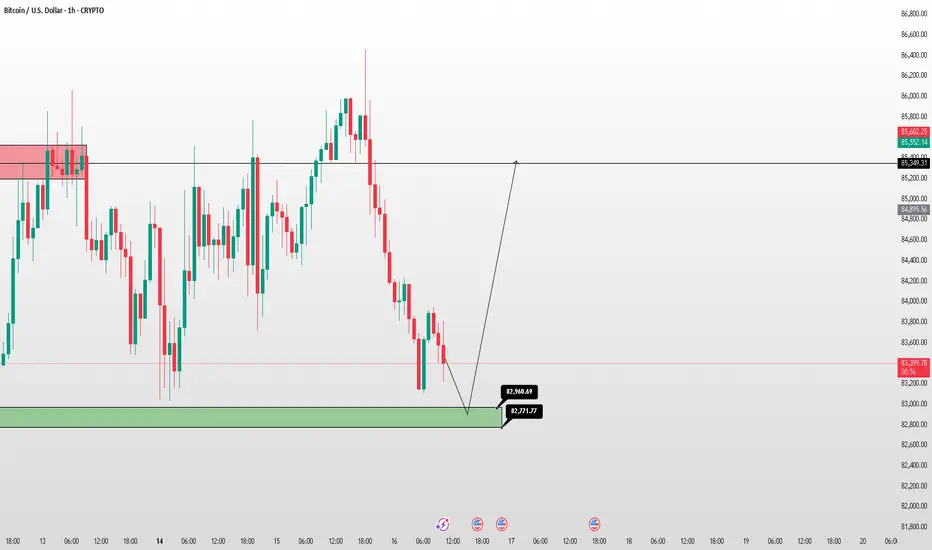
BTC/USD – Buy Setup🚀 BTC/USD – Buy Setup (April 16, 2025)
🔹 Demand Zone: 82,771 – 82,960
🔹 Take Profit: 85,349
⚡ Rules:
Buy if price reaches 82,771–82,960.
Stop Loss: Below 82,700.
Hold until 85,349 (or scale out).
#Bitcoin #Trading #Crypto #FXF #FXFOREVER
BTC Market Outlook: Bullish Breakout or Bearish Breakdown?This idea analyzes Bitcoin's (BTC) potential market direction using a combination of RSI, MACD, and trend lines, with the 0.6 Fibonacci retracement level as key support. The Relative Strength Index (RSI) is monitored for overbought/oversold conditions, while the Moving Average Convergence Divergence (MACD) highlights momentum shifts and potential crossovers. Trend lines are drawn to identify critical resistance and support zones, with the 0.6 Fib retracement acting as a pivotal support level. A bounce from this level with bullish RSI divergence and a MACD crossover could signal a bull market continuation, targeting new highs. Conversely, a break below 0.6 Fib support, accompanied by bearish RSI and MACD confirmation, may indicate a bear market, with downside targets at lower support zones. Watch for volume spikes and price action at these levels to confirm the trend.
