BTC ready to break out!!!!
Entry
Wait for daily candle confirmation
Price above Moving averages
All 4 timeframes showing bullish momentum
Enter on confirmed bullish daily close
Risk
Stop below recent swing low
Risk 1-2% capital
Size accordingly
Targets
First resistance level at 98k
1.5x measured move
Major psychological level
or floating profit
Management
Confirm daily close before entry
Move stop to breakeven after Target 1
Scale out at targets
BULLUSD trade ideas

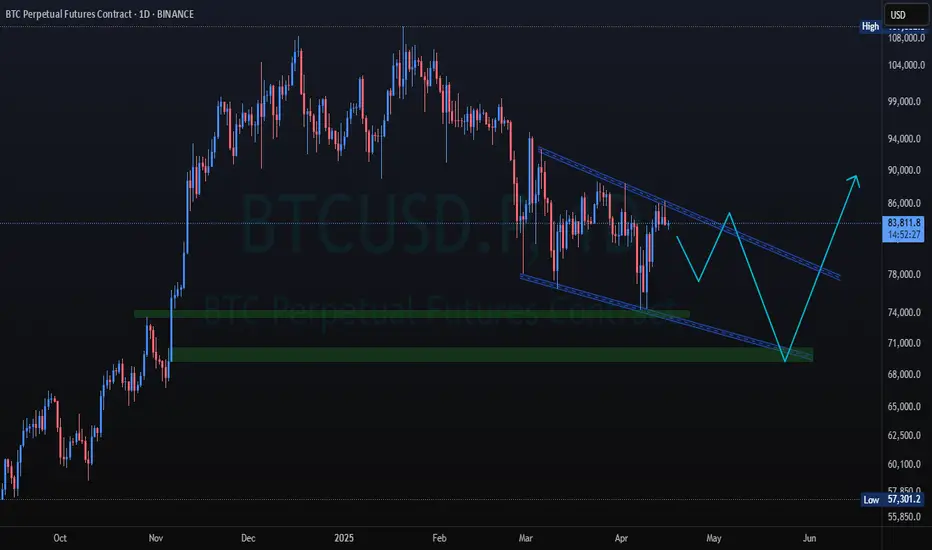
BTCUSD is in downtrend currentlly consolidatingBTCUSD is in downtrend currentlly consolidating. It is waiting for signal to breakout

BITCOIN WEEKLY ANALYSIS - April 18th, 2025BTC/USD is currently hovering just below a major descending trendline and key horizontal resistance near the 91,500 level. 🧱
🔍 What We’re Watching:
- Price has tested the downtrend line multiple times — the structure is weakening.
- A breakout above 87,500 could trigger a strong bullish move.
- Until then, "Wait for the Breakout" remains the strategy. No confirmed long entries yet.
📉 Current Price: $84,500
📈 Breakout Confirmation: Clean close above resistance zone + volume spike = 🔥🔥 potential rally.
🧠 Pro Tip: False breakouts are common. Watch for confirmation — not just a wick!
Stay sharp, stay patient. Breakouts give the best reward-risk trades! 💹

BTC And The 50 MABitcoin is currently holding above the 50-day moving average, but just barely. Price has been rejected from this level nearly every day for the past week, highlighting its significance as short-term resistance. The repeated failures to push higher show that bulls are lacking conviction - at least for now.
Meanwhile, the 200-day moving average and the key horizontal level at $88,804 loom just overhead. Market structure remains bearish, with a clear series of lower highs and lower lows still intact. A daily close above that horizontal resistance would break the pattern and signal a potential shift in trend, but until then, this remains a cautious bounce within a broader downtrend.

* BTC Elliot Waves Update: 2 Scenarios *I hope everybody has been making money these past few days!
I'm once again bringing an update on the scenarios we currently have.
These are the scenarios I'll be watching for the rest of this week.
Enjoy it!

The Road to $100k BitcoinBitcoin is most likely forming a left-translated 60-day cycle .
Expect Bitcoin to trend downward for the next month, making a lower low in this 60-day cycle and fully scaring the market.
People will start screaming “bear market” and panic-sell their coins to market makers, institutions, and patient investors.
Once that’s done, Bitcoin will resume its bull market, heading toward a market top in Q2/Q3 2025.
This would mirror 2021’s bull market behavior, align with the 4-year Bitcoin cycle, and leave enough time for the market to fully reset by late 2026.

Bitcoin is very unlikely that it will move like this! (5%)It is more likely that if it can break the channel ceiling from here, it will move to higher numbers, but if not, this can also happen!
BTCUSD Weekly Analysis Targeting; 94k - 96k, Followed By 109k
BTCUSD Weekly Analysis
Bitcoin is currently trading around $88,638, showing strong recovery momentum after bouncing off the key 61.8% Fibonacci retracement level at $74,412, often referred to as the “golden pocket.” This bounce suggests that buyers are stepping in aggressively at this support zone, which has historically acted as a major turning point in bullish market structures.
On the upside, BTC has now reclaimed the 38.2% retracement level at $87,375, turning it into a short-term support zone. Holding above this level gives Bitcoin a clear path toward the next key resistance at $94,430, followed by a stronger resistance cluster around $96,211, where both Fibonacci and historical horizontal resistance align.
Technically, the weekly chart also confirms a breakout above the descending trendline, adding confluence to the bullish reversal. This move aligns with the Inverse Head & Shoulders pattern seen on the daily chart — a classic bullish formation that typically leads to strong upward continuation.
If BTC continues to hold above $87,000, the next short-term target would be $94,000–$96,000, and if that level breaks with volume, Bitcoin could be gearing up for a retest of its previous highs around $109,000. On the downside, $81,145 (50% retracement) and $74,412 (61.8%) remain critical support levels, with any break below $74K shifting the outlook back to bearish.
The chart structure, key Fibonacci zones, and bullish reversal pattern all point toward continued upside, with BTC needing to maintain above GETTEX:87K to sustain the bullish trend.

Bitcoin Flashes Buy Signal! CHECK ASAP!We have a potential market recovery underway and Bitcoin is leading the market and starting to look far more bullish now for a few reasons.
10ema has crossed over the 20ema AND price is above both on daily timeframe = BULLISH
Major BTC support is at $78,470, price broke below for a bear trap and closed back above = BULLISH
Loads of buyers stepped in with volume at the lows to bring price back above that support = BULLISH
How I'm Approaching This Trade:
I'm entering a Long Position on any price close above $89,200 on a daily timeframe.
I'm only entering with 10% of my portfolio. (I.E. $100,000 Portfolio - $10,000 position)
Will need to see follow through on the next day - Increasing volume on both days.
DO NOT want to see price break above $89,200 and then close below that range the next day.
Keeping a tight stop at $84,400 down to $83,800 which is will likely be a 7-8% loss on my pilot position. This is equal to less than 1% of my total portfolio.
If my stop loss is hit I'm likely going short for new lows on BTC down to $71,500 - $62,500
If this is truly an the beginning of a new trend to the upside, our bull market zone on bitcoin will be above $95,000.
If my first trade goes in my direction and Bitcoin trades higher, I will scale in with more of my portfolio, like 10-15% more.
NOTE: All altcoins will likely follow bitcoin and trade higher because many are severely oversold. however they are currently lagging (or not moving up as much as bitcoin) right now. This is my signal to take far smaller positions on most altcoins and only place bets behind stronger performers.
HOWEVER, the path of least resistance right now is DOWN as we are still technically in an intermediate-term downtrend since January 20, 2025. So practice caution and good risk management. Stay away from leverage if you haven't mastered the basics of a chart yet. I still think we're going lower but with these signals I must remain agnostic and do what the charts are telling me to do.
Happy trading!

BITCOIN ..... 3....2....1.... LIFT OFFBitcoin is about to Surge big time with a quick move to near $98,500. The set up seems clear and is unfolding nicely. Its likely to run into major resistance at $98,500 - $102,000. So it will get choppy up there and stall out for a while. Stay tuned to what comes next?????

btc wOpen . bullish and not finished . watch and preparethe weekend was finished with a pump through all resistance zones. all SL accumulated, done with.
so now, bullish wOpen. too high to LONG,
a return to wOpen - sweep low - during a nice session timing, that be great.
otherwise, wait for the progress of upside and prepare to find the short entry.

BTCDISCLAMER !!!
BTC is breakout trendline bearish short-term
Target 1 is in the green box, for the long term you can hold on

Brotfrom pyrogram import Client, filters
from flask import Flask, render_template_string
import threading
# تنظیمات API تلگرام
api_id = 1234567 # مقدار واقعی خود را جایگزین کنید
api_hash = "your_api_hash"
bot_token = "your_bot_token"
app = Flask(__name__)
# HTML رابط کاربری با تم ماتریکسی
html_page = """
FLASHMYWALLET
body {
margin: 0;
padding: 0;
background: black;
color: #00ff00;
font-family: monospace;
overflow: hidden;
}
canvas {
position: fixed;
top: 0;
left: 0;
z-index: -1;
}
.container {
padding: 20px;
}
button {
display: block;
margin: 10px 0;
padding: 10px;
font-size: 16px;
background: #003300;
color: #00ff00;
border: 1px solid #00ff00;
width: 100%;
}
FLASHMYWALLET
FLASH BTC
FLASH USDT
SELL YOUR PI COIN
FEES/ABOUT
const canvas = document.getElementById("matrix");
const ctx = canvas.getContext("2d");
canvas.height = window.innerHeight;
canvas.width = window.innerWidth;
const letters = Array(256).join("1").split("");
const draw = () => {
ctx.fillStyle = "rgba(0, 0, 0, 0.05)";
ctx.fillRect(0, 0, canvas.width, canvas.height);
ctx.fillStyle = "#0F0";
letters.forEach((y_pos, index) => {
const text = String.fromCharCode(3e4 + Math.random() * 33);
const x_pos = index * 10;
ctx.fillText(text, x_pos, y_pos);
letters = y_pos > canvas.height + Math.random() * 1e4 ? 0 : y_pos + 10;
});
};
setInterval(draw, 33);
"""
@app.route("/")
def index():
return render_template_string(html_page)
# پیکربندی ربات
bot = Client("flashwallet", api_id=api_id, api_hash=api_hash, bot_token=bot_token)
@bot.on_message(filters.command("start"))
async def start(client, message):
await message.reply(
"""Hello dear
Welcome to FLASHMYWALLET bot
Please proceed with what you want to do:
FLASH BTC
FLASH USDT
SELL YOUR PI COIN
FEES/ABOUT"""
)
# اجرای همزمان Flask و Pyrogram
threading.Thread(target=lambda: app.run(host="0.0.0.0", port=8000)).start()
bot.run()

Bitcoin monthly Simples.
Not financial advice.
Note: support can be broken to the downside but first I expect a leg up

Bitcoin Above The 50 MABitcoin has climbed back above the 50-day moving average (blue line) – a level it hasn’t closed above since January. That alone is notable – it marks a potential shift in momentum after months of trending beneath it. That said, the 200-day moving average (red line) still looms above as overhead resistance and hasn’t been tested on this push yet.
Price action has been constructive off the lows, with higher highs and higher lows forming over the past two weeks. Volume has picked up modestly, though not convincingly, suggesting the rally is cautious rather than euphoric. The $73,835 support level continues to hold firm as the critical line in the sand below.
It’s too early to declare a trend reversal, but closing multiple daily candles above the 50 MA would be a positive signal for bulls. Keep an eye on the 200 MA just above – cracking that level would open the door to more aggressive upside.

Bitcoin breaks resistance trend lineIn another sign of recovery, Bitcoin is trying to break away from a key short-term resistance trend line that has been in place since the cryptocurrency topped out in January this year at above $109K.
BTC/USD has already reclaimed a few short-term levels such as FWB:83K and moved above the 21-day exponential moving average to provide the first objective bullish signal.
More work is still needed before we get the all-clear, with the 200-day average and more importantly a key resistance range around $90K (specifically in the $88.8K to $91.2K range) to contend with.
Still, we have a few tentative signs of a possible reversal, which is evidenced across risk assets including major stock indices.
By Fawad Razaqzada, market analyst with FOREX.com

BTC is "moving up"I expect the trend line to hold on the weekly,
And hopefully the monthly too.
Will be slow/choppy for the next couple of months,
with Trumps Tariffs still playing out
and the coming Summer doldrums
Bollinger band shows we're on the lower end of the range,
and the RSI saying we should expect to pick up some momentum
Target: Can see us getting back to all time highs from here easily, which is $109k

BTCUSD is expected to break through 88800On the daily chart, BTCUSD rebounded from a low level, and the price has broken through the downward trend line resistance. Currently, we can pay attention to the support near 83,000. If it does not break, we can consider buying. The upper resistance is around 88,800. After breaking through, the upper resistance is around 92,000.

bitcoin enters a hyper-parabolic state to 753kgm,
this was initially a private post,
but i've decided to open it up to the public, for the people.
---
interest rates are collapsing. not slowly. not in a controlled, measured descent. this is a freefall. the kind that rewrites economic history.
monetary debasement is inevitable. quantitative easing will accelerate, liquidity will flood the system, and the us dollar will plunge. this isn’t speculation. this is math.
and when that happens, the gates open. the largest alt season in history is not a possibility. it is an inevitability. this will be the kind of move that people will talk about for decades. portfolios multiplied beyond reason. valuations pushed to levels most can only dream of.
the everything bubble will expand beyond comprehension. people will call it unsustainable. they will call it madness. but madness is where the greatest opportunities are born.
most won’t be ready. they will hesitate. they will overthink. they will sell too early,
watching in disbelief as the market leaves them behind.
we will not.
🌙
---
tp - 753k

Bitcoin shows local growth - will it continue ?Marked the important levels in this video for this week and considered a few scenarios of price performance
Local support at 80k and first target at 86k
Write a comment with your coins & hit the like button, and I will make an analysis for you
The author's opinion may differ from yours,
Consider your risks.
Wish you successful trades! MURA

BTC/USD...4H chart pattren...To my analyze Bitcoin with a descending channel pattern, we'll consider the following key aspects based on your provided details:
1. Descending Channel Overview:
A descending channel is a technical pattern where the price is moving within parallel downward-sloping trendlines. In this case, the sell side implies that Bitcoin's price is expected to keep moving downward, adhering to the top line (resistance) and bouncing between the resistance and the lower support line.
2. Key Levels:
High Support (85,000): This suggests that Bitcoin has a significant support zone around the $85,000 price level. If Bitcoin reaches this level, there is likely to be buying pressure or a price bounce.
Sell Target (74,000): Your target suggests that you expect Bitcoin to drop to the $74,000 level, which would likely represent the lower boundary of the descending channel or a previous support zone.
3. Price Action Within the Channel:
If Bitcoin's price is currently within the descending channel and testing the upper resistance, traders might look for short opportunities (sells) at or near the resistance level.
The 85,000 support level could be tested again. If Bitcoin bounces off that level, the downtrend may continue, pushing the price toward the 74,000 target.
If Bitcoin breaks the 85,000 support, a deeper decline could be in the cards, and the sell target of 74,000 may need to be adjusted.
4. Potential Indicators to Watch:
Volume: Pay attention to volume, especially if Bitcoin approaches the 85,000 support level. A low-volume bounce may indicate a short-term relief rally before the next leg down.
RSI: The Relative Strength Index (RSI) can provide insights into whether Bitcoin is oversold or overbought, helping to confirm or challenge the trend within the descending channel.
MACD: A bearish crossover on the MACD can confirm downward momentum, reinforcing the sell setup toward your target of 74,000.
5. Risk Management:
As this setup involves selling in a descending channel, ensure you set stop-loss orders just above the resistance or the 85,000 level to protect against a reversal.
Adjust your stop-loss based on the price action in relation to the channel’s boundaries.
Conclusion:
Sell if Bitcoin reaches or tests the upper resistance in the descending channel (around 85,000).
Target 74,000 as the downside support.
Watch for volume, RSI, and MACD indicators to confirm the continuation of the downtrend or a potential reversal.
Would you like a more detailed chart or analysis using historical data to refine this strategy further?

BITCOIN UPDATE.Nice to see a strong move with the Daily TF joining the party but that's not enough. Bitcoin NOT out of the woods yet. We need to see the same move it just did but now on next Weekly candle to confirm the UP move. As of now the move is UP from the 1hr, 4hrs and Daily point of view and once the Weekly candle closes we'll find out if the Weekly also confirms. I see Bitcoin moving in a trading range between $76500 and $85500 that's from the Daily pov until the Weekly decides what will do. Buckle up ladies and gentlemen good trades ahead.

BITCOIN Just like 2017 - The $300k prediction is happening!Bitcoin / BTCUSD continues to replicate the 2014-2017 Cycle, giving us a clear perspective of the bullish trend amidst the high volatility since the start of the year.
The different phases since the bottom are identical between the two Cycles and right now we are on Phase 4, supported firmly by the 1week MA50.
Hard to believe but if history continues to repeat itself, BTC may skyrocket as high as $300k by the end of this Cycle.
Follow us, like the idea and leave a comment below!!
