BTC – Strong Buy Signals, Sentiment Reversing, Final Push?BTC is clearly in a place of rising trust
- Fear & Greed Index improving: last week 24 (Extreme Fear), yesterday 31, now 38 (Fear), last month low was 3
- Several bullish divergences visible: RSI and MACD show higher lows vs. price, momentum indicators curling up, OBV ticking higher despite weak price action
- Price is sitting at the lower Bollinger Band and holding an ascending trendline
- Multi-indicator (mostly RSI-based) showing clustered buy signals, similar to previous rallies
- Simple Fibonacci retracement from the recent high (~73K) shows potential move toward 130K, assuming continuation and break above ~109K
- Last S-BUY signal was 14 bars ago, still active
- Structure is clean and holding
- If this is the final leg up, we could be entering danger or euphoria territory soon
BULLUSD trade ideas

April 14 Bitcoin Bybit chart analysisHello
It's a Bitcoinguide.
If you have a "follower"
You can receive comment notifications on real-time travel routes and major sections.
If my analysis is helpful,
Please would like one booster button at the bottom.
Here is the Bitcoin 30-minute chart.
There is no Nasdaq indicator announcement today.
I created a strategy based on the possibility of a strong decline in Tether dominance centered on the Gap section at the bottom of Nasdaq and Bitcoin.
*One-way long position strategy when the red finger moves
1. 83,690.8 dollars long position entry section / cut-off price when the green support line is broken
2. 85,772.3 dollars long position 1st target -> Top 2nd -> Good 3rd target.
If the strategy is successful, I have indicated the long position re-entry section.
Today, it is best to maintain the purple support line
because it maintains the mid-term pattern and the daily candle bottom section.
The mid-term pattern can be broken from the 1st section,
and it can be a sideways market until the 2nd section,
and it can decline step by step from the bottom -> 3rd section.
Up to this point, I ask that you simply use my analysis for reference and use only.
I hope that you operate safely with the principle of trading and cut-off price.
Thank you.

BTC - Bottom soon?I recently published this idea privately because I was unable to post it publicly at the time. Now, I’d like to make it public.
(Click the picture above to view the TA-Chart.)
I'll be copying and pasting all the text from the original private idea here, along with the missing links I had prepared on April 2nd.
The purpose of this chart is just to illustrate how my three target levels align with my Fibonacci retracement levels — which is also the reason I selected them.
---------------------------------------------------------------------------------------------------------------------
We are currently in a complex situation. Markets have been experiencing a sell-off due to uncertainty surrounding Trump's tariffs. Additionally, Trump needs to refinance a massive sum of government debt ($7 trillion) over the next 10 years. To achieve this, he must lower the 10-year yield to reduce interest payments.
One way to lower yields is by increasing government efficiency, thereby reducing borrowing needs and bond issuance, which in turn decreases yields. Another method is cutting interest rates, yet his tariff policies counteract this approach. This raises the question: does he want a recession? During a recession investors would flock toward bonds as a safe haven, ultimately pushing yields down.
Bad Signs
- Fed Atlanta GDPNow Gold adjusted at -0.8%
- PMI below 50
- Major uncertainty due to enormous tariffs
-> Michigan Consumer Sentiment (57) and Expectation (52.6) are at levels seen during the recession of 2022
- FED cannot cut interest rates due to persistently high inflation
Are we heading towards a recession?
People tend to overreact and overlook key indicators—one of which is liquidity. Examining the WTREGEN, we see a steep decline since mid-February, indicating that cash has been injected into the system.
This is further supported by the rising RRPONT since mid-February. Additionally, the Fed has been slowing down QT, meaning the liquidity injection is not being offset as much.
Additionally due to the tariffs countries like China could bring a liquidity stimilus into the markets to help their domestic markets.
In summary, liquidity levels should be sufficient for at least a blow-off top. The reason markets have not rallied yet is due to uncertainty stemming from Trump’s tariffs. This is reflected in recession-level Michigan Consumer Sentiment and the Fear & Greed Index.
A key bullish signal would be a falling RRPONT alongside a declining WTREGEN, as this would indicate that cash injections are flowing into risk assets, showing regained confidence. For confidence to return, we need a positive catalyst, such as an stop to QT, an increase of the balance sheet or an interest rate cut. However, the Fed is holding off on cuts due to high inflation and the tariffs.
But this is where it gets interesting:
According to Truflation, inflation has dropped significantly below the Fed’s 2% target since early March. The Bureau of Labor Statistics (BLS) data lags by a full month, so if Truflation’s data holds any truth, the upcoming inflation report on April 10 may reflect this decline. This could restore confidence and provide the Fed with room to give us a positive catalyst.
Where is BTC headed?
Compared to my expectations from early february ( ibb.co ) I expect BTC to first move into the $78K–73K range before rallying toward $115K instead of rallying now at 82k. This range aligns with my Fibonacci levels, and 73K was the high of March 2024. Additionally there is currently a fractality compared to the bottom of 2022 where the bottom now would be rougly at 75k.
To reach $115K, BTC must first break the black downward trendline and the double-top neckline at around $95K. My blow-off top target is $115K, and if BTC holds above $100K, I will eye $145K and $185K as the next targets.
Furthermore there could be a chance that the tariffs are just a negotiation tool since the tariffs do not make any sense % wise.
However if Trump does intend to impose these tariffs at the said % and other countries stab back with their tariffs, then we might actually see a stagflation if the Fed does not intervene-or intervenes too late.

BTC/USD... 1D CHART PATTREN...Here's is my 1-Day technical analysis for BTC/USD based on my setup:
---
Bitcoin (BTC/USD) – 1D Chart Analysis
Current Price: $84,500
Trendline Breakout: Confirmed (suggesting bullish momentum)
Position: Buy Initiated
Entry Zone: $84,000–$84,500
---
Technical Setup:
Breakout Type: Trendline breakout on daily timeframe
Volume Confirmation: Look for increased volume on the breakout candle (bullish sign)
Support Levels: $81,000 and $78,500
Resistance Zones:
Target 1: $94,000 – Psychological & Fib resistance
Target 2: $98,500 – Extended target, may align with overbought RSI levels
---
Indicators to Watch:
RSI: Should stay below 70 for healthy bullish momentum
MACD: If bullish crossover confirmed, supports further upside
EMA 50 & 200: Price trading above both = strong trend confirmation
---
Strategy:
Buy Zone: $84,000–$85,000
TP1: $94,000
TP2: $98,500
Stop Loss: Below $81,000 (to protect against false breakouts)
---
Let me know if you want a chart drawn or an intraday scalping plan based on this setup.

BITCOIN HIGH ON !!!BTC is in a rare Velocity Compression Zone — where price tightens, fear peaks, and explosive upside follows.
🧠 Key Signals:
– ETF pullback phase ending
– Time-based Fib arc points to April–May breakout
– On-chain dormancy flow mirrors 2017 & 2021 pre-rallies
– Open interest dropping, shorts overexposed
🚀 Targets:
– $108K → $162K → $250K (cycle top)
🔻 Invalidation: Weekly close below GETTEX:82K


BTC PERPETUAL TRADE , Sold from $85,000BTC PERPETUAL TRADE
BTC SELL SETUP
Currently $85,000
Sold at $85,000
(Trading plan If BTC up to $87000 we will add more sell)
Expecting target $83,300 OR DOWN
Incase of early exist will update this anaylsis
Its not a Financial advice

BTCUSD Analysis Today: Technical and On-Chain !In this video, I will share my BTCUSD analysis by providing my complete technical and on-chain insights, so you can watch it to improve your crypto trading skillset. The video is structured in 4 parts, first I will be performing my complete technical analysis, then I will be moving to the on-chain data analysis, then I will be moving to the liquidation maps analysis and lastly, I will be putting together these 3 different types of analysis.

BTC: Time to buy?After having supported the 75k support and breaking the downward resistance (yellow), I understand that it could be a good sign for a rise. Waiting for 100k again?

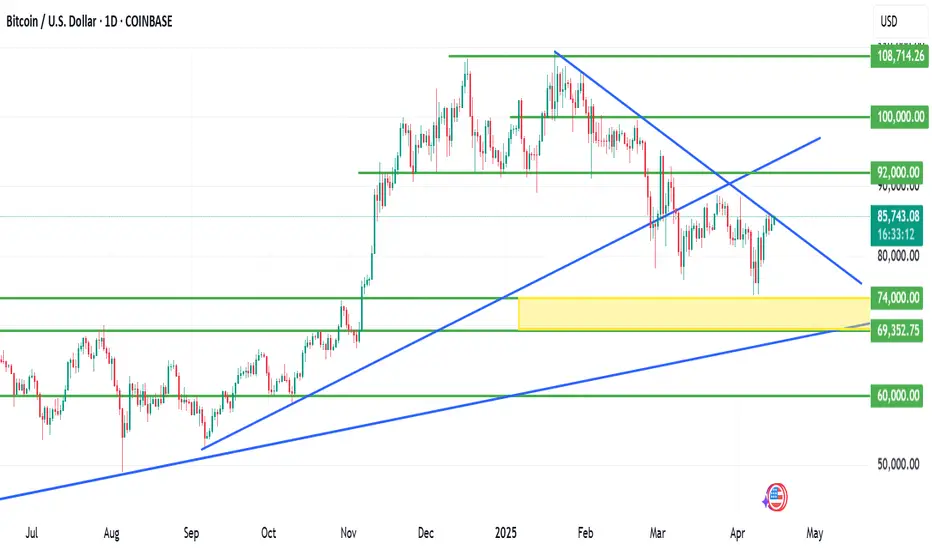
BITCOIN is kissing a critical resistance zoneBITCOIN is kissing a critical resistance zone.
Bitcoin is currently kissing a critical resistance zone, hovering around the $85,500 level. This region aligns closely with a descending trendline that has historically capped BTC rallies, and this test comes after a sharp recovery from a local low near $74,000, a drop that was triggered in tandem with broader risk-asset selloffs following U.S. tariff announcements and rising global macroeconomic tension.
Technical Analysis
The descending trendline (marked in blue on the chart) acts as a key resistance.
A daily close above $85,800 - $86,200 could confirm a breakout, potentially paving the way for a fresh attempt toward the $90,000 psychological level.
Conversely, failure to break and hold above this resistance could cause a rejection and pullback.
Immediate downside support lies at the previous local low (~$74,000), and below that, the next strong support zone is around $69,000 (yellow block on chart).
Fundamental Backdrop
Bitcoin continues to be driven by macroeconomic news, institutional flows, and growing ETF inflows.
If fundamentals remain bullish, including continued institutional accumulation, favorable regulatory developments, or increased on-chain activity, they could fuel momentum for a breakout.
The market doesn’t reward assumptions — it rewards preparation.
Whether it’s a breakout or a pullback, risk management should always come first. As always, protect your capital before thinking of profit. Use stop-losses, scale your entries, and avoid over-leveraging in volatile zones like this.
What’s your take on BTC at this juncture?
Do you see a breakout brewing, or is this another trap for over-leveraged bulls?
Let’s discuss
How to Build a Super Pitchfork with Reaction & Trigger LinesIn this educational video tutorial, I guide you through the process of setting up a Super Pitchfork using the Bitcoin daily chart. This method is inspired by Patrick Mikula’s work in " The Best Trendline Methods of Alan Andrews. "
I demonstrate how to:
- Create and project reaction lines
- Generate bullish and bearish trigger lines
- Apply a personal timing technique for pitchforks based on Michael Jenkins’ methods by squaring significant pivots to the median line, reaction lines, and upper parallel to produce time-based reaction points anticipating potential market turns.
This walkthrough is for traders who already have a foundational understanding of pitchforks.
Inspired by the work of Patrick Mikula, this is how I personally apply and expand on the Super Pitchfork method in my own charting.

BTC chart you must see! :oLooks like we got something brewing here... I probably don't need to explain what you see, but in my humble opinion, $95K en route... then... probably consolidation. Let's hold our breath as this plays out :-)

BTC/USD Short Setup – Triple Top Reversal with EMA Confirmation Entry Point (Sell): Around $85,699.52
Stop Loss: $86,741.44 (above resistance zone)
Target (Take Profit): $82,982.09
This provides a Risk-Reward Ratio of approximately 1:2, a commonly acceptable ratio in trading.
📈 Indicators:
EMA 30 (Red) is currently above the EMA 200 (Blue), indicating bullish momentum—but this setup anticipates a trend reversal.
If price breaks below the EMAs, that would confirm bearish strength.
🧠 Conclusion:
This setup is based on:
A strong resistance zone,
Bearish reversal pattern (triple top),
Risk management via stop loss and take profit levels.
If you're trading this:
Wait for confirmation with a bearish candlestick below the EMAs or a break of recent support.
Manage position size based on stop distance and your account risk tolerance.

BTCUSDHello, traders
After the rejection on 4hr Supply Zone, breaker Block was formed on M15 chart to confirm the trend reversal.
1st T.P @ $78400 level
2nd T.P @ $74600

BITCOIN Is Very Bearish! Short!
Here is our detailed technical review for BITCOIN.
Time Frame: 12h
Current Trend: Bearish
Sentiment: Overbought (based on 7-period RSI)
Forecast: Bearish
The market is trading around a solid horizontal structure 82,277.86.
The above observations make me that the market will inevitably achieve 75,083.32 level.
P.S
We determine oversold/overbought condition with RSI indicator.
When it drops below 30 - the market is considered to be oversold.
When it bounces above 70 - the market is considered to be overbought.
Disclosure: I am part of Trade Nation's Influencer program and receive a monthly fee for using their TradingView charts in my analysis.
Like and subscribe and comment my ideas if you enjoy them!

At present, a selling phenomenon has emergedAt present, a selling phenomenon has emerged😰, and a large number of traders are waiting for the market to open⏰.
When other markets open on Monday, the situation of a large amount of capital flowing out to other trading fields also deserves attention. 😟
Especially the flows to the XAU/USD and USOIL markets, or other foreign exchange markets. 💱 The movement of funds to these areas might be influenced by economic news, geopolitical events, or simply portfolio re - balancing by investors. 📰
💰💰💰 BTCUSD 💰💰💰
💰💰💰 BTCUSD 💰💰💰
🎯 Sell@84000 - 84500
🎯 TP 82500 - 81500
Recently, the market has been extremely volatile 😱, which has led to the clearing of many traders' accounts or significant losses 😫. You can follow my signals and gradually recover your losses and achieve profitability 🌟💪.
Traders, if you're fond of this perspective or have your own insights regarding it, feel free to share in the comments. I'm really looking forward to reading your thoughts! 🤗

BTC LONG TP:88,200 13-04-2025🚀 It's time to go Long! The targets are set between 88,000 and 88,300, with the 1-hour and 2-hour timeframes showing a clear bullish pattern in favor of this trend.
We expect this movement to materialize within a timeframe of 20 to 25 hours, so make sure to enter and average down.
Stay tuned for updates to maximize your gains. Follow me to stay informed and add those greens! 💰🔥

. BTCUSD NEW M30 BULLISH ANALYSIS
- 📊 **BTC/USD Trading Idea (30-Min Chart)**
**Date:** April 16-17, 2025
**Timeframe:** 30-Minute Chart
**Bias:** **Bullish Reversal from Support Zone**
---
- ✅ **Key Levels**:
- **Support Zone:** $83,586 – $83,765
- **Resistance Zone (Target):** $86,441
---
🧠 **Idea**:
BTC currently approaching strong **support zone** ($83,586 – $83,765). Based on the previous price action and highlighted zone:
🔹 Expecting **bullish rejection/wick** from support
🔹 Potential for **bounce back toward $86,441** resistance
🔹 Best entry after confirmation (e.g., bullish engulfing / double bottom on LTF)
---
- 🎯 **Trade Setup**:
- **Entry:** $83,750 - $83,850 (on bullish confirmation)
- **Take Profit (TP):** $86,000 - $86,441
- **Stop Loss (SL):** Below $83,500
---
. 🛡️ **Risk Management**:
- Position size as per risk appetite (1-2% of capital recommended)
- Wait for **confirmation candle** to avoid false breakout

Bullish momentum to extend?The Bitcoin (BTC/USD) has bounced off the pivot and could potentially rise to the 1st resistance which is an overlap resistance.
Pivot: 79,541.85
1st Support: 72,724.17
1st Resistance: 94,187.24
Risk Warning:
Trading Forex and CFDs carries a high level of risk to your capital and you should only trade with money you can afford to lose. Trading Forex and CFDs may not be suitable for all investors, so please ensure that you fully understand the risks involved and seek independent advice if necessary.
Disclaimer:
The above opinions given constitute general market commentary, and do not constitute the opinion or advice of IC Markets or any form of personal or investment advice.
Any opinions, news, research, analyses, prices, other information, or links to third-party sites contained on this website are provided on an "as-is" basis, are intended only to be informative, is not an advice nor a recommendation, nor research, or a record of our trading prices, or an offer of, or solicitation for a transaction in any financial instrument and thus should not be treated as such. The information provided does not involve any specific investment objectives, financial situation and needs of any specific person who may receive it. Please be aware, that past performance is not a reliable indicator of future performance and/or results. Past Performance or Forward-looking scenarios based upon the reasonable beliefs of the third-party provider are not a guarantee of future performance. Actual results may differ materially from those anticipated in forward-looking or past performance statements. IC Markets makes no representation or warranty and assumes no liability as to the accuracy or completeness of the information provided, nor any loss arising from any investment based on a recommendation, forecast or any information supplied by any third-party.

Another market manipulation. It is spiraling out of control!I’m not here to express political opinions, but let’s be real—the Trump family launching meme coins, rugging retail investors, and manipulating markets is spiraling out of control.
💥 $TRUMP and $MELANIA were just the beginning.
Today, we witnessed what could be the biggest market manipulation in history, and it was executed with textbook precision:
Step one: float a fake news headline to test the market reaction.
Step two: publish a deliberately confusing statement where Trump says everything and its opposite.
Many misunderstood it as a “90-day tariff pause.”
🕛 The timing?
The announcement dropped at 12:30 PM EST—midnight in Asia, and 7 PM in Europe, when banks and institutions were closed.
🎯 Only the U.S. was awake and able to buy the pump.
Everyone else? Left sidelined.
No politician in modern history has manipulated global markets to this extent.
It’s turning Wall Street into a Las Vegas casino for the elite.
To make matters worse, Trump even tweeted a sarcastic:
“It’s a great day to buy stocks.”
🧨 Reality check:
He lowered current tariffs by just 10%
Hit China with a massive 125% tariff
Recession risk? Still on the table
Economic uncertainty? Worse than ever
You think China will just let this slide? Retaliation is coming.
What we're seeing is a nation burning its credibility while recklessly using financial power to create chaos.
🚨 If you think your money is safe in markets run by these people, think again.
This isn't trading anymore—it's Russian Roulette. Markets needs stability.
DYOR

Shorting Analysis on Bitcoin - Fxdollars- {15/04/2025}Educational Analysis says that BTCUSD may give countertrend opportunities from this range, according to my technical analysis.
Broker - BITSTAMP
So, my analysis is based on a top-down approach from weekly to trend range to internal trend range.
So my analysis comprises of two structures: 1) Break of structure on weekly range and 2) External pushback to fill the remaining fair value gap
Let's see what this pair brings to the table for us in the future.
Please check the comment section to see how this turned out.
DISCLAIMER:-
This is not an entry signal. THIS IS ONLY EDUCATIONAL PURPOSE ANALYSIS.
I have no concerns with your profit and loss from this analysis.
I HAVE NO CONCERNS WITH YOUR PROFIT OR LOSS,
Happy Trading, Fx Dollars.

BITCOIN is kissing a critical resistance zone.BITCOIN is kissing a critical resistance zone.
Bitcoin is currently kissing a critical resistance zone, hovering around the $85,500 level. This region aligns closely with a descending trendline that has historically capped BTC rallies, and this test comes after a sharp recovery from a local low near $74,000, a drop that was triggered in tandem with broader risk-asset selloffs following U.S. tariff announcements and rising global macroeconomic tension.
Technical Analysis
The descending trendline (marked in blue on the chart) acts as a key resistance.
A daily close above $85,800 - $86,200 could confirm a breakout, potentially paving the way for a fresh attempt toward the $90,000 psychological level.
Conversely, failure to break and hold above this resistance could cause a rejection and pullback.
Immediate downside support lies at the previous local low (~$74,000), and below that, the next strong support zone is around $69,000 (yellow block on chart).
Fundamental Backdrop
Bitcoin continues to be driven by macroeconomic news, institutional flows, and growing ETF inflows.
If fundamentals remain bullish, including continued institutional accumulation, favorable regulatory developments, or increased on-chain activity, they could fuel momentum for a breakout.
The market doesn’t reward assumptions — it rewards preparation.
Whether it’s a breakout or a pullback, risk management should always come first. As always, protect your capital before thinking of profit. Use stop-losses, scale your entries, and avoid over-leveraging in volatile zones like this.
What’s your take on BTC at this juncture?
Do you see a breakout brewing, or is this another trap for over-leveraged bulls?
Let’s discuss

After a peak around 86,000, BTC is showing signs of lower highs Your chart shows a possible pullback to a resistance zone around 84,800–84,900, followed by a continuation to the downside.
