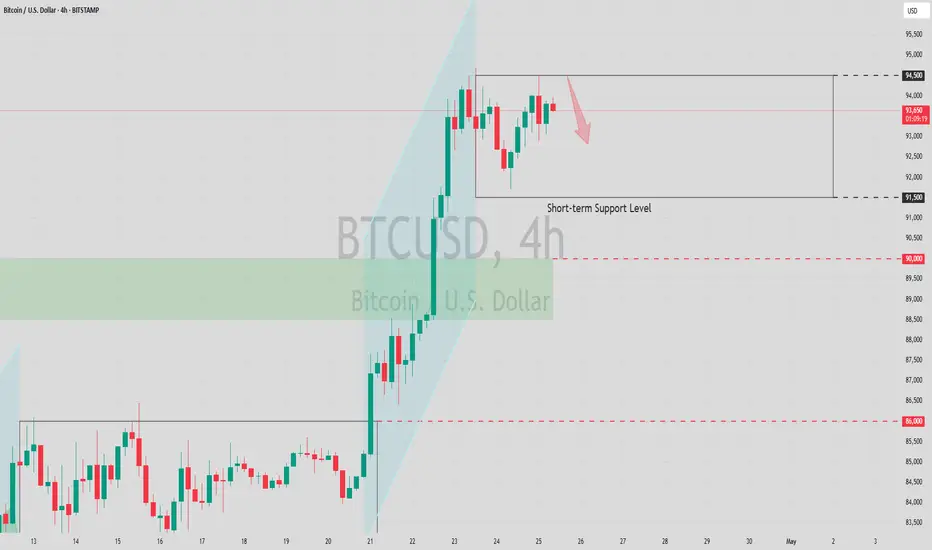
BTCUSD Short Setup – Bearish Reaction from Supply ZoneBTC recently broke out of an accumulation range, highlighted by the yellow box on the chart. Following the breakout, price surged and tapped into a nearby supply zone, showing signs of rejection. Current movement suggests a potential shift in momentum to the downside. We are currently monitoring a potential short setup on BTCUSD after price tapped into a clear supply zone around the 94,600 to 94,800 level.
Trade Idea Summary:
- Bias: Sell/Short
- Stop Loss: 95,000
- Take Profit: 88,830
- Risk to Reward Ratio: 1 to 2.57
Key Levels:
- High: 94,577
- Zone of interest: 94,600 – 94,800
- Support and target: 88,827
- Previous range low: 84,016
Notes:
This setup is based on a bearish reaction at the supply zone. A clean break of the 93,000 support level would provide further confirmation. Intraday volatility is high, so manage risk carefully.
BULLUSD trade ideas

Bitcoin sell technical analysis Description:
Bitcoin is rejecting major resistance near $94,000 after forming a bearish engulfing candle on the 4H chart.
• Key Resistance: $94,000–$95,000 zone rejected with strong selling pressure.
• RSI Divergence: Bearish divergence between price and RSI confirms weakness.
• Break of Support: Price broke minor support at $92,800, shifting short-term structure bearish.
• Moving Averages: Trading below the 50 EMA on the 4H chart, signaling bearish momentum.
Sell Setup:
• Look for entries around $93,500–$94,000 (retest zone).
• Stop-loss above $95,000.
• TP1: $91,000
• TP2: $88,500
Bitcoin is showing clear signs of a pullback — sellers are currently in control.
Hail "Schildbrecher" !
681K
confirmed as a major assault target
Herr Obersturmbannführer
Zu Ihren Diensten
SIR?

4 possible scenario on bitcoinConsidering Bitcoin's ascending channel, Fibonacci expansion and retracement levels, and the current fundamental situation, these movements can be predicted for Bitcoin.
This is purely a technical analysis and should not be used for trading!

BTCUSD – Long Trade Setup !📈🟢
Asset: Bitcoin / U.S. Dollar (BITSTAMP: BTCUSD)
Chart: 30-Min Timeframe
Pattern: Bullish pennant breakout setup
🔹 Entry: ~$94,200 (breakout + structure support)
🔹 Stop-Loss: ~$93,000 (below pennant and trendline)
🔹 Take Profits:
TP1: ~$95,500 – Near upper channel
TP2: ~$97,000 – Measured breakout target
⚖️ Risk-Reward Calculation
– Risk per Trade: ~$1,200
– Reward to TP2: ~$2,800
– R:R Ratio: ~1:2.3 ✅
🧠 Technical Highlights
– Strong pennant consolidation after big rally
– Higher lows holding tight on 30-min frame
– Clean breakout expected above $94,500
– Previous breakout patterns confirmed bullish continuation

D1 still hasn’t formed a peak?D1 still hasn’t formed a peak?
Long this week, the peak is still on D1. D1 hasn’t signaled a top yet, and the smaller H1 or H4 timeframes are correcting to continue the LONG upward move.

BTC NEXT MOVE?🚀 Bitcoin (BTC) Market Update
We are expecting a small dip in Bitcoin's price, potentially down to the 89,000–90,000 USD zone. From that level, we anticipate a strong rally toward 101,000 USD, as highlighted in the chart.
📈 This move could also lead Bitcoin toward making a new all-time high!
Stay patient and follow the setup carefully.

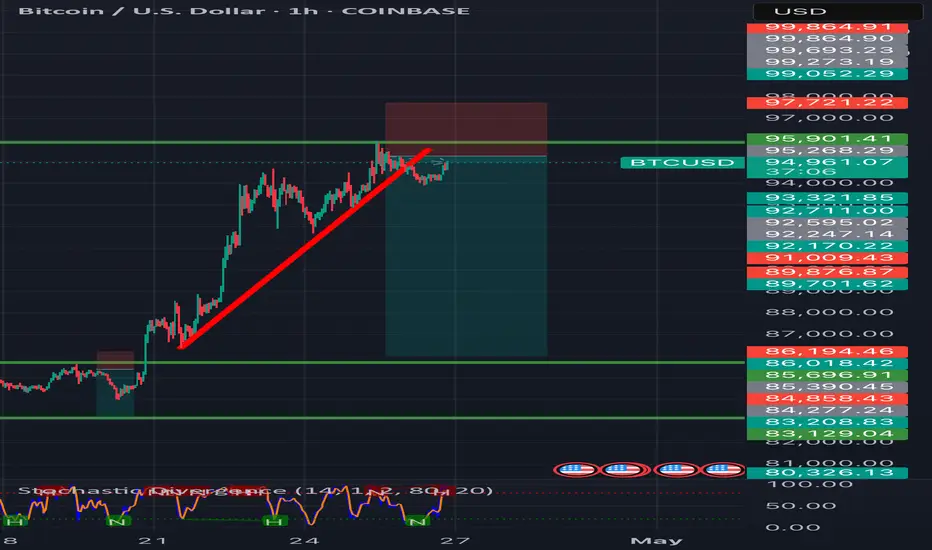
BTCUSD ANALYSIS🚨 BTCUSD Technical Update! 🚨
Traders, pay close attention! 👀
Here’s what the latest 1H chart is showing us:
🔹 Bitcoin is consolidating around 94,700–94,800
🔹 Potential double top structure forming near the 95,600–95,750 zone — MAJOR resistance ahead!
🔹 If Bitcoin fails to break and sustain above this resistance, we could see a sharp drop towards the first support at 94,383 🔻
🔹 A break below 94,000 could accelerate selling pressure — next downside target near 93,500! 🎯
⚡ Plan your trades smartly!
⚡ Wait for confirmations — either breakout or rejection from the resistance zone!
🔥 Volatility Incoming! Stay Alert and Manage Risk Wisely! 🔥
$BTC: We Are in a Bear Market Until Proven Otherwise🚨 CRYPTOCAP:BTC : We Are in a Bear Market Until Proven Otherwise 🚨
📌 Follow-up to my December 2024 post:
🔗
Despite record-breaking bullish news, Bitcoin is not at an all-time high. Why? Because we’re still in a bear market—until the charts say otherwise.
✅ Bullish Factors:
Michael Saylor continues buying billions
President Trump & family pushing crypto/meme coins
Rumors: Fed buying CRYPTOCAP:BTC with gold?
Trump pinned the Bitcoin white paper at the White House
U.S. banks fully onboard with crypto
ETFs accumulating CRYPTOCAP:BTC
National crypto reserve announced
❌ Bearish Signals:
Fear & Greed Index in "extreme fear" for 30+ days
Price is below the EMA50 on weekly
Monthly MACD nearing bearish crossover
Trading volume decreasing
Crypto search interest at multi-year lows
Retails not buying — this is all institutions
Powell confirmed we're in a recession
Desperate whales calling for $5M–$9M BTC to bait retail
🧭 Monthly chart check the MACD:
🔗
⚠️ Key Insight:
Every cycle, people confuse a relief rally for a new bull run. This isn't new.
A relief rally = short-term price recovery in a bear market.
(AKA a dead cat bounce or sucker rally)
📊 Past relief rallies (check the chart):
+45% (Feb 2022)
+32% (June 2022)
Current one: only +16% — still within bear territory.
📉 Price could hit $91k and still drop lower while staying in an ongoing bear Market..
🧨 Bear Market Target: GETTEX:25K – FWB:27K
📈 Invalidation? Only if we close above $101K
Don’t trade your emotions. Trade the charts. They never lie.
#Bitcoin #CryptoMarket #BTC #BearMarket #CryptoAnalysis #SPX500 #CryptoTrading #Recession2025 #BTCPrice #CryptoCrash #CryptoNews #MichaelSaylor #TrumpCrypto #BTCBearMarket

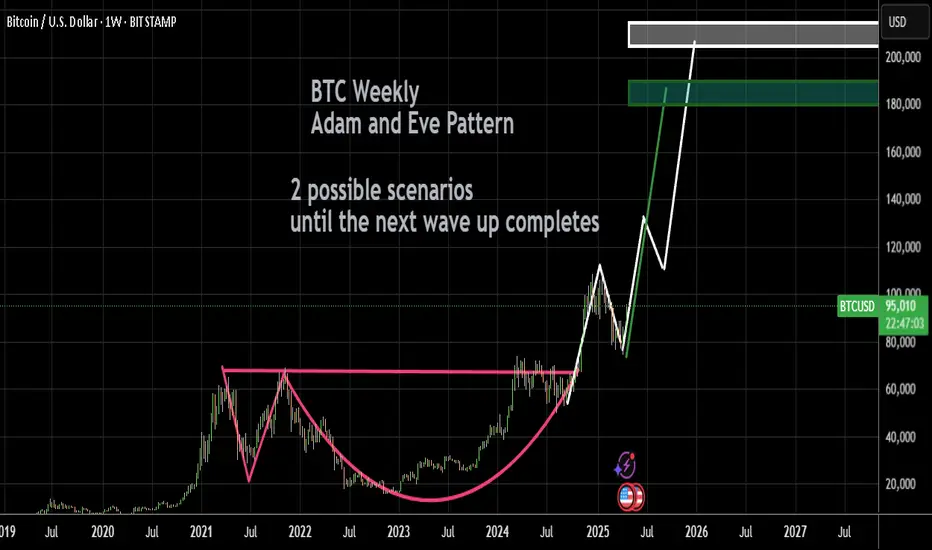
Bitcoin reaches $110,000 to $113,000 then crashes 2025 (soon)A bearish divergence has appeared on Bitcoin’s weekly chart, closely resembling the setup before the 2021 crash. Based on this, along with a peak-to-peak trendline, I believe Bitcoin could climb to $110,000–$113,000 before a major correction — potentially dropping to $60,000 or, in a worst-case scenario, as low as $30,000 — before beginning its next upward surge.

BTCUSD FORECAST 26APRIL 2k25Targeting short : targeting area remark.
Reason : Btcusd has been rally up for more than 8 hours and previous daily candle showing weak bull momentum.

Bitcoin Aligns with the 2017 Cycle ModelThere’s growing speculation that the current Bitcoin cycle mirrors the market behavior seen in 2017.
Intrigued by this, I conducted my own analysis. I overlaid the 2014–2017 cycle pattern onto the current chart for comparison.
The results?
A striking resemblance in both the overall shape and the distinct correction and impulse phases.
It seems history may not repeat itself exactly, but it certainly rhymes. 📊

BTC is in strong support area based Fib RetracementHi again, for a long time I don't share my ideas here, so I'm trying to consistent share my thought here.
Technical
BINANCE:BTCUSD in strong support line based Fib Retracement on $76,113.25 (on daily Timeframe)
The price currently below the EMA 200
MACD still doesn't give the sign to long
BTC Dominance still high (60.39% based on Coinstast )
Macro
Based on similiar correlation with S&P500, it's still give no good sign to bounce back (it maybe going deeper)
About the global economy, US Tariff still give the global uncertainty and cold vibes haha
Summary
If you going long term, maybe you can go buy BTC in small size, is a good price to add the collection
If you going short term, I think it will be go deeper first
Thanks for your time!
I hope everyone have a good time and good health!

Bitcoin: The Grand Ascension Blueprint - Ready for Lift-Off!
The Most Important Bitcoin Chart You'll See This Year.. As we said before in pervious idea for enrty in 74,500
and that what happen in one month
Looking at this daily BTC/USD chart, we're witnessing the formation of a powerful technical setup that could define the rest of 2025. This isn't just another prediction—it's a strategic roadmap based on key technical levels that smart money is watching.
📊 What The Chart Is Revealing:
🔷 Perfect Channel Formation
* Bitcoin has established a massive ascending channel (gray boundaries) with textbook precision
* Current price ($77,626) testing the critical lower boundary support
* Previous touch points have all resulted in significant bounces
🔷 Triple Target Trajectory
* TP1: $82,400 - Initial relief target (conservative)
* TP2: $85,700 - Mid-channel equilibrium zone
* TP3: $89,100 - Upper resistance test before potential breakout
🔷 Historical Context Matters
* We're constructively holding above the December 2023 breakout level
* Current consolidation mirrors the pre-pump phase from late 2023
* Blue trendline break served as the first warning of trend change
Why This Pattern Has MASSIVE Implications
⚡ The Timing Effect:
The current position at channel support presents a rare low-risk, high-reward opportunity with clear invalidation points. The pattern suggests accumulation before a potential explosive move toward $130,000 by August-September.
⚡ Macro Alignment:
This technical setup coincides perfectly with post-halving supply dynamics and institutional capital flow patterns. The projected move higher follows the historical post-halving performance cycles.
⚡ Risk Management Precision:
* Invalidation point: Clear break below $74,000 with volume
* Ideal entry zone: $74,800-$75,500
* Risk:reward ratio at current levels: approximately 1:5
he Hidden Message Most Traders Are Missing
This isn't just about price targets—this formation suggests Bitcoin is preparing for its largest percentage gain phase of this cycle. The projected path (purple forecast line) indicates a potential 68% move from current levels in just 90-120 days.
Institutional positioning data supports this view. The methodical stair-stepping pattern in the forecast line suggests strategic accumulation phases between aggressive price advancement.
📊 SEE YOU AFTER 3-4 MONTHS .. FOLLOW ME FOR MORE DETAILS 📊

Bitcoin is bullish again!Bitcoin’s been on a wild ride lately!
After crashing down from its all-time highs earlier this year, it’s suddenly bounced back and shot up again over the last few weeks. Here’s what’s really going on, in plain English:
First off, a lot of this has to do with what’s happening in the broader economy and politics. The US dollar has gotten weaker recently, especially after Trump started criticizing the Federal Reserve and pushing for interest rate cuts.
When the dollar drops or there’s drama around central banks, people start looking for alternatives, and BITSTAMP:BTCUSD is like the go-to “digital gold” for a lot of investors these days.
There’s also been a ton of money flowing into Bitcoin ETFs (those are investment funds that directly hold Bitcoin), especially from big institutions like BlackRock and Fidelity. These huge inflows mean more demand, but since there’s only so much Bitcoin out there, the price gets pushed up even more.
Another big reason is the recent Bitcoin “halving,” which happened about a year ago. Basically, every four years, the reward for mining new Bitcoin gets cut in half, so fewer new coins are created. This makes Bitcoin even scarcer , and historically, prices have always jumped in the months after a halving event. As we said in previous ideas BTC could be near USD 200k this summer.
On top of that, there’s been some good news about trade relations between the US and China, which has made investors more optimistic and willing to take risks again. When people feel better about the global economy, they’re more likely to put money into things like crypto.
Technical confirmations
Bouncing in the previous 2024 highs is really good for Bitcoin, people was ready to buy a lot of BTC in the right price and after that a lot of inflows moved the price over the blue trendline meaning that this small downtrend is over.
Bitcoin is volatile, so this kind of movements are ideal to make money or invest in a discount. If the price moves below the support line, then I recommend to stay away of BTC because there could be a free fall...
So, to sum it up: weaker dollar, big institutional buying, post-halving scarcity, better vibes around global trade, and people running from stock market chaos—all of that has pushed Bitcoin back up after its recent dip. Who knows how long it’ll last, but right now, crypto’s hot again!

BTC Bullish ContinuationAs predicted, BTC made an impulsive move to the upside. Currently, I'm looking for a retracement on the H4 and H1 to join the rally again. Look for rejection and a buy setup in the buy area. Trade safe.

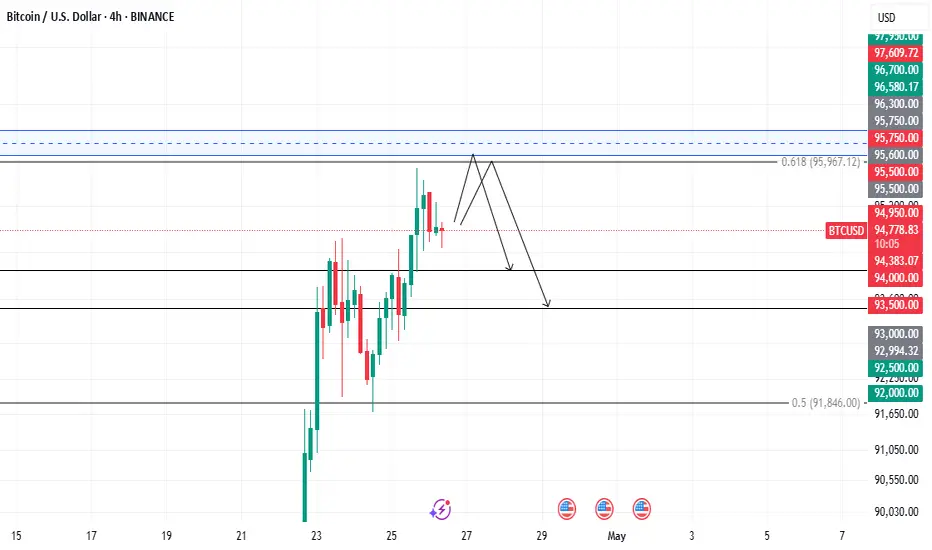
Short-term shorting opportunities emergeBTC encountered significant resistance near $94,500 during this week's rally, and short-selling operations can be attempted when approaching this price level.
BTCUSD
sell@94000-94500
tp:93000-92500
I hope this strategy will be helpful to you.
When you find yourself in a difficult situation and at a loss in trading, don't face it alone. Please get in touch with me. I'm always ready to fight side by side with you, avoid risks, and embark on a new journey towards stable profits.
Bitcoin Surges and Gold Falls: Risk Appetite RisesBy Ion Jauregui – ActivTrades Analyst
Friday’s session sends a clear message to financial markets: risk appetite is roaring back, and investors are shifting their positions accordingly. While Bitcoin heads for its best week since March—fueled by geopolitical expectations and signs of a softer U.S. trade policy—the gold market, traditionally a haven in times of uncertainty, is undergoing a mild pullback from its record highs.
Bitcoin Tops $93,000 and Eyes Weekly Gains
The leading cryptocurrency, Bitcoin (BTC), climbed to $93,300, marking a near 10% gain for the week after briefly touching $94,000 on Wednesday. This rebound represents a sharp reversal from the caution seen in recent weeks and largely reflects a shift in tone from Washington.
President Donald Trump withdrew his threat to remove Federal Reserve Chair Jerome Powell, a move interpreted as an institutional stability signal. He also hinted at potentially lowering tariffs on China, easing market tensions and benefiting higher-volatility assets like cryptocurrencies.
Although Beijing officially denied any trade talks, Bloomberg reports suggest China is considering exempting certain U.S. goods from its 125% tariffs, stoking hopes for a de-escalation. In this context, Bitcoin, which has historically reacted to geopolitical uncertainty and market sentiment, has drawn investor interest as a speculative asset with upside potential amid greater liquidity and less trade friction.
BTC/USD Technical Analysis
A long-term Bitcoin chart reveals that the Fibonacci retracement has returned near the 61.0% level, currently sitting just below it. The Point of Control (POC) is around $84,568, significantly below today’s price of $93,617.
The Relative Strength Index (RSI), at 55.84, shows no signs of extreme overbought conditions. Should the current resistance level be decisively broken, Bitcoin could surge toward $98,000, reclaiming territory lost in late February. Conversely, if momentum falters, a pullback to the 50% Fibonacci retracement—around $90,822, the previous resistance—becomes more likely.
Gold Pulls Back from Record Highs
On the flip side, spot gold fell 0.9% to $3,318.28 per ounce, while June futures slipped 0.6% to $3,328.67. These modest declines come after gold reached a historic peak of $3,500 earlier this week.
The primary catalyst for the pullback has been renewed risk-on sentiment, driven by strong earnings from tech giants Alphabet (+2.5%), Amazon (+3.3%), and Nvidia (+3.6%)—all benefiting from the AI boom and boosting confidence in growth assets.
Additionally, a rebound in the U.S. dollar, which had hit three-year lows, pressured precious metals. Yet gold remains elevated, underpinned by structural factors like persistent inflation, Middle East conflicts, and broader geopolitical tensions.
A New Balance Between Safe Havens and Speculation
This week’s action underscores a temporary shift in investor priorities. With signs of trade détente and no surprises from central banks, capital is moving from defensive assets into higher-return, speculative vehicles such as cryptocurrencies.
Other altcoins have also performed well: Polygon is up 11%, Cardano +4.4%, Solana +2.7%, while Ethereum holds steady near $1,770.
Although the backdrop remains fragile—trade talks remain uncertain and global risks linger—the market’s narrative has turned cautiously optimistic. This shift positions Bitcoin as a hybrid asset, straddling the line between a digital haven and a high-risk investment.
Conclusion
The divergent performance of Bitcoin and gold highlights the market’s current duality: optimism with reservations. If trade-tension relief takes hold, digital assets could see further gains. Conversely, renewed conflict would likely propel gold back into the spotlight as the premier store of value.
*******************************************************************************************
The information provided does not constitute investment research. The material has not been prepared in accordance with the legal requirements designed to promote the independence of investment research and such should be considered a marketing communication.
All information has been prepared by ActivTrades ("AT"). The information does not contain a record of AT's prices, or an offer of or solicitation for a transaction in any financial instrument. No representation or warranty is given as to the accuracy or completeness of this information.
Any material provided does not have regard to the specific investment objective and financial situation of any person who may receive it. Past performance is not reliable indicator of future performance. AT provides an execution-only service. Consequently, any person acting on the information provided does so at their own risk.

Bitcoin will return to the moon!!BTC/USD 1D - Well as you can see price has played out exactly as we predicted yesterday providing us with an amazing push to the upside. I do however want to see price correct itself before the next push up.
I have gone ahead and marked out the order block I have in mind that I would like to see price come and clear before it continues in this hawkish way. I feel this could be a great area to get involved in those longs from.
As we know there are some great prospects for BTC so its important that we are always looking for key areas of interest for us to buy in from with this market being a bullish one.

#BTC Update (1H Chart)Trade Bias Verification: Long (with caution for short-term bearish momentum)
Confidence Score: 6.5 out of 10 (slightly reduced due to bearish MACD crossover and RSI divergence)
Hypothesis Refinement:
The bullish continuation hypothesis still holds, but the MACD bearish crossover and RSI divergence on the 1-hour chart signal a stronger short-term pullback or consolidation phase. The price is likely to test the demand zone near 92,000 - 92,934 before resuming the uptrend. Traders should wait for signs of momentum recovery (MACD crossover back up, RSI turning up from support) before entering.
Key Levels:
Entry: Near demand zone 92,000 - 92,934, ideally after MACD bullish crossover and RSI support confirmation.
Stop-Loss: Below demand zone and Ichimoku cloud, around 91,000.
Take-Profit: Near recent highs (94,000) and daily resistance (95,000 to 100,000).
Actionable Insight:
Avoid chasing the current pullback; wait for momentum indicators to confirm a reversal near the demand zone.
Use a momentum-based entry strategy on the 1-hour timeframe, entering once MACD crosses back above the signal line and RSI shows upward momentum.
Set alerts for price approaching the demand zone and for MACD/RSI bullish signals.
Maintain stop-loss discipline below the demand zone to protect against deeper corrections.
Monitor volume for increasing buying interest on the bounce to confirm strength.

$125k BTC in May? Bitcoin is poised to reach $125,000 by mid-May driven by a convergence of strong macroeconomic trends and crypto-native catalysts. The recent halving event has once again reduced miner rewards, compressing supply at a time when institutional demand—fueled by the approval of Bitcoin ETFs and growing interest from traditional asset managers—is surging. Historical post-halving rallies typically peak several months after the event, and this timeline aligns perfectly with the May target. Furthermore, Bitcoin’s increasing correlation with a weakening U.S. dollar and the Federal Reserve's anticipated dovish pivot adds momentum. As inflation fears subside and risk-on sentiment strengthens, capital rotation into digital assets could accelerate, helping push Bitcoin toward the $125K mark.
However, a healthy correction between June and September is both likely and necessary to sustain long-term price growth. As new investors enter at higher price points and early cycle holders begin to take profits, the market may experience a 20–30% pullback—possibly exacerbated by macro uncertainty or regulatory headlines. This cooldown period would shake out short-term speculation and reset key technical indicators. By Q4, renewed buying pressure, stronger fundamentals, and increased mainstream adoption could reignite the uptrend. With Bitcoin reentering price discovery mode, the final leg of the cycle rally could push it toward a new all-time high of approximately $155,000 by November, reflecting the maturity of this bull cycle and the growing role of Bitcoin as a macro hedge.

Double Top Forming on BTC 1D ChartMy free: Degen Indicator is printing a Double Top on the Bitcoin 1D Chart. This is a very strong signal that price upside is weakening. If Today's candle is Bearish Engulfing along with the second Top signal holding on the next 1D close it will mean that Bitcoin has yet made another Lower High.
