Btcusd Btcusd is on a down trend in a weekly and daily time frame so we are expecting btc to crash to 68k then be4 the bullish movement
BULLUSD trade ideas

Nothing different - stay patient, wait for your best fills!Still shorting these names for now until I see signs that we're no longer building bearish short-term liquidity which from the looks of PA and the algos, we still are.
Waiting for more fills in the low $70k's and ideally a reach to FWB:67K
Happy Trading :)

Bull Flag or Breakdown? A Liquidity Proxy Near Its LimitsIs Bitcoin forming a head and shoulders pattern before a correction, or are we in the midst of another bull flag consolidation? Personally, I lean toward the latter — that this is a classic bull flag being formed. That does not preclude us from seeing more volatility in the short term. We could very well chop sideways for the next two months or even move lower before the next leg up. It’s entirely plausible that we test and ultimately break through the 109,000 level before advancing toward 132,000.
That said, we must also acknowledge the alternative: what if this is indeed a head and shoulders pattern, signalling a deeper correction ahead? The market will do what it wants, and the truth is revealed only in hindsight. Good traders and investors prepare for both outcomes.
My broader view is that the real economic pain begins to show itself around September or October, when the cumulative impact of tariffs, deteriorating trade flows, and policy missteps starts to weigh more heavily. That’s part of why I believe we’re still in a bull phase for Bitcoin — though likely the final one before liquidity tightens more decisively.
Let me be clear: I do not regard Bitcoin as digital gold. It may be a reasonable proxy for global liquidity, but it is not a risk-off asset. It is not a store of value in the same sense as gold, and I believe those who treat it as such are in for a rude awakening. Yes, it has captured the imagination — and wallets — of a certain subset of investors who see it as a monetary alternative. But in a true bear market, when risk assets come under real pressure, I expect Bitcoin and the broader crypto complex to fall alongside equities and other speculative instruments.
That will be the moment when the cost of four years of reckless spending, monetary debasement, and centralised overreach is fully realised. The lesson, as always, will be the same: liquidity is a tide, and when it goes out, only real assets endure. For many, it may soon be time to consider harvesting gains and rotating into genuine risk-off positions — not narratives, not hope — but assets with intrinsic value, such as physical gold.
This is not investment advice. Do your own research. I could be entirely wrong. And please forgive the rough chart — it’s amateur work.

Unveiling Crypto Market Insights - Bitcoin's Descending ChannelGM Market Enthusiasts,
In today’s update, we turn our attention to Bitcoin’s evolving trend. Since the end of February, BTC has been tracing a steady pattern of lower highs and lower lows. Currently, it remains below the 200-day simple moving average , consolidating around the 85K mark — a zone that has served as a resistance in recent days.
The big questions now are:
When will this downtrend lose its grip? At what point might Bitcoin reclaim ground above the 200DMA?
How long do you expect BTC to remain within this descending channel? And when the breakout comes — which direction will it take?
We’d love to hear your thoughts — where do you see Bitcoin heading next?

Mastering Volatile Markets: Why Patience is Your Biggest Edge█ Mastering Volatile Markets Part 3: Why Patience is Your Biggest Edge
If you've read Part 1 about position sizing and Part 2 on liquidity , then you already know how to adapt to the mechanics of volatile markets. The next great tool in your arsenal will be patience.
Your biggest opponent in wild markets is your own mind.
In volatile markets, your emotions can easily get the best of you. Fear of missing out (FOMO) is one of the most dangerous emotions that drives poor decisions.
█ FOMO (Fear of Missing Out) Hits Hardest in Volatile Markets
Wild price swings, like 300-500 point moves in the Nasdaq or Bitcoin jumping $1000 in seconds, can make it feel like easy money is everywhere.
You can quickly get the overwhelming temptation to chase moves , especially when it seems like you're missing every opportunity.
This is where most traders lose.
Let me state some harsh truths that I had to learn the hard way through many losses:
Volatility doesn't equal opportunity.
Fast moves don't mean easy trades.
Most wild price moves are designed to trap liquidity and punish impatience.
The true reality is that the market wants you to overreact in these conditions.
It wants you to buy after a big move.
It wants you to short after a flush.
It thrives on you being emotional, chasing, and reacting.
Because reactive traders = liquidity providers for smart money.
Every single trader has made this mistake — not just once, but over and over again. Jumping into the market after a big move, hoping it will continue… but what usually happens? The market snaps back and stops you out.
Can you relate? Share your story or experience with this in the comments below!
█ What Experienced Traders Do Instead
⚪ They Know the First Move is Often the Trap
Breakout? Expect a fakeout.
Breakdown? Expect a snapback.
New high? Watch for stop hunts.
New low? Watch for a flush.
Effectively speaking, pro traders don't chase the market. We wait for stop hunts to complete, liquidity grabs to finish, price to return into their zone, and for confirmations before entering the market.
⚪ They Train Patience Like a Skill
Professional traders aren't more patient because they're "special." We are patient because we’ve learned the hard way that chasing leads to pain.
⚪ They Know When Not to Trade
It is bad to trade when there’s no clear structure, no clean confirmation, if the spread is too wide or when the liquidity is too thin.
Instead, pro traders let the market come to them , not the other way around.
⚪ They Turn FOMO into Confidence
Instead of saying, "I'm missing the move…" , I recommend you think:
"If it ran without me — it wasn't my trade."
"If it comes back into my setup — now it's my trade."
█ So, what have we learned today?
Volatility triggers FOMO. FOMO triggers bad decisions. Bad decisions trigger losses.
To win long-term, you must stay calm, selective and professional. Let other traders be emotional liquidity. That's how you survive volatile markets.
█ What We Covered Already:
Part 1: Reduce Position Size
Part 2: Liquidity Makes or Breaks Your Trades
Part 3: Why Patience is Your Biggest Edge
█ What's Coming Next in the Series:
Part 4: Trend Is Your Best Friend
-----------------
Disclaimer
The content provided in my scripts, indicators, ideas, algorithms, and systems is for educational and informational purposes only. It does not constitute financial advice, investment recommendations, or a solicitation to buy or sell any financial instruments. I will not accept liability for any loss or damage, including without limitation any loss of profit, which may arise directly or indirectly from the use of or reliance on such information.
All investments involve risk, and the past performance of a security, industry, sector, market, financial product, trading strategy, backtest, or individual's trading does not guarantee future results or returns. Investors are fully responsible for any investment decisions they make. Such decisions should be based solely on an evaluation of their financial circumstances, investment objectives, risk tolerance, and liquidity needs.

BTCUSD 15MIN RESULT -TP HIT!!TP Hit!!! been a couple hours but it played out.. Look at last post why I took this trade.

#Bitcoin Future Forcast of Final moves towards #BullRunAs per Weekly Chart Analysis,
Bitcoin performing on the perfectly into #ElliottImpulsive waves and its #CorrectionWave and this time the 5th Cycle of Elliott Impulsive Wave was completed and last Correction Wave cycle will under movements.
Now, it is completed the 0 to A-cycle & performing the moves towards B-cycle around $84k to GETTEX:87K and after that final moves towards C-cycle for last Lower-Low point around FWB:67K -65k approx, and that will be completing around next 120-150 days with 0-A-B-C of this cycle around July-August approx..
While, from 0 to A cycle was its first movement point of Retest of lower point, after the Bitcoin's $109k #AllTimeHigh point was at 0 point and $76k is the direction of Point A.
Then, after the completion of this cycle of Correction Wave, Bitcoin's final BullRun movement will be starts around August onwards for next 120-150 days for this season last Bullish cycle to reach out min. $180k to $220k and max. Mark will be around $250k to $280k approx.
Thereafter, the #BearishZone of market will be starts next year, after completion of this Elliott Impulsive & Correction Wave pairings, which is completely starts from Nov. 2022 from its last Lower-Low mark up point of Bitcoin was $15.5k approx.
Anyways,
Study deeply always to perform any trade and take StopLoss strategy for that as well DYOR too...🙏

“Does size matter?” when it comes to backtesting?It’s the kind of question that gets a few smirks, sure. But when it comes to backtesting trading strategies, it’s not a joke, it’s the difference between confidence and false hope.
Let’s get real for a minute: the size of your candles absolutely matters.
What you don’t see can hurt you
Most people start testing on bigger timeframes. It’s faster, easier on the eyes, and the results look clean. But clean doesn’t mean correct.
Larger candles blur the details. That one nice-looking 4-hour candle? Inside, price could’ve spiked, reversed, chopped around, or triggered your stop before closing where it did. You’d never know. And that’s the problem.
You might think your entry worked beautifully… but only because the data smoothed out everything that actually happened.
A backtest should feel like a real trade
Trading isn't just about the final price. It’s about what price does to get there. That messy movement inside the candle? That’s where most trades are made or broken.
If your strategy is even remotely reactive, waiting for structure, confirmation, retests, or anything time-sensitive, you need to see what price did between the open and close.
And the only way to see that? Use smaller candles.
Smaller data, clearer picture
1-minute candles might look overwhelming at first, but they give you something the higher timeframes just can’t: behavior.
Not just outcomes. Not just win/loss stats. But the actual shape of the move, the hesitation, the fakeouts, the precise moment when the trade made sense—or didn’t.
And once you start testing with that level of detail, your strategy either earns your trust… or shows its cracks.
So how small should you go?
There’s no one-size-fits-all here. But as a general rule: if your idea relies on precision, go small. Test it on 1-minute or 5-minute charts, even if you plan to execute on higher timeframes. You’ll quickly see if the entry makes sense, or if you’ve been relying on candle-close hindsight.
Yes, it takes longer. Yes, you’ll stare at noisy charts for hours. But your strategy will thank you.
Watch out for “too good to be true”
One last thing, if your backtest results look flawless on 1h or 4h candles, pause. That’s often a sign that you’re testing a story, not a strategy.
Zoom in. See what actually happens. You might be surprised at how different the same trade looks when you’re not glossing over the details.
TL;DR:
In backtesting, size absolutely matters. Smaller candles reveal real behavior. Bigger ones hide the truth. So if you care about how your strategy actually performs not just how it looks.
go smaller. Your backtesting will get sharper, and your confidence? Way more earned.

Symmetrical Triangle Nearing Resolution: Breakout or Breakdown?BTC/USD H4 Analysis – Symmetrical Triangle Nearing Resolution: Breakout or Breakdown?
📊 Technical Outlook – 4H Timeframe
Bitcoin is currently consolidating within a clear symmetrical triangle, with price tightening ahead of a potential major breakout. The chart shows price testing the upper boundary of the triangle, supported by MA13 and MA34 from below.
Key resistance zones: 86,594 and the extended target zone at 88,753. A successful breakout above this region could trigger a strong rally toward 90,000+.
Key support levels: 81,397 – 78,725 – 75,102, acting as critical retracement zones in case of downside rejection.
The structure suggests two primary scenarios:
Bullish breakout to 86,594 → 88,753, followed by a pullback and continuation higher.
False breakout or breakdown, leading to a sell-off toward 78,725 and possibly down to 75,102 if market sentiment deteriorates.
🌍 Macro Context & Market Sentiment
Investor sentiment remains fragile, impacted by ongoing geopolitical risks and the Fed’s cautious stance on monetary policy.
Altcoins are underperforming, signaling that capital rotation remains limited – often a precursor to short-term correction or distribution in BTC.
Volume is fading as price coils inside the triangle, typically a precursor to a sharp move in either direction.
🧠 Trading Strategy Ideas
Watch closely for price action near 86,594 – 88,753. If rejection or wick rejections occur, short-term pullback trades may be viable.
A breakdown below the triangle support (~84,000 area) could open up downside targets at 81,397 and 78,725.
A clean breakout with volume confirmation? Look for retest buys around 86k with continuation potential.
⚠️ Caution Advised
BTC is in a “calm-before-the-storm” zone. This is not the time to chase moves or overleverage. Let the market confirm direction and trade based on structure, not emotion.
💬 Are you leaning bullish or bearish on BTC’s next move? Will we see 90k or a drop back to 75k? Share your thoughts below! 👇👇👇

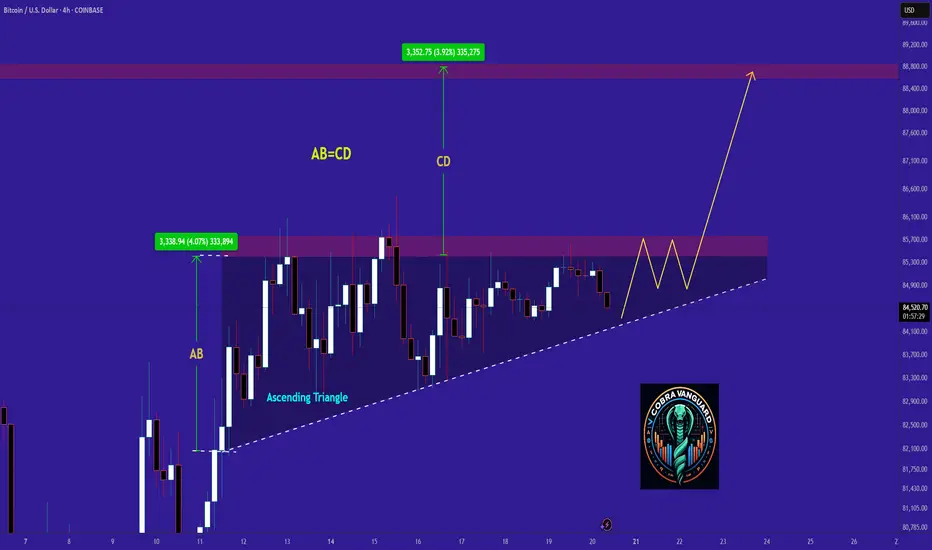
BITCOIN Ready for PUMP or what ?Currently, COINBASE:BTCUSD is forming an ascending triangle, indicating a potential price increase. It is anticipated that the price could rise, aligning with the projected price movement (AB=CD).
However, it is crucial to wait for the triangle to break before taking any action.
Give me some energy !!
✨We spend hours finding potential opportunities and writing useful ideas, we would be happy if you support us.
Best regards CobraVanguard.💚
_ _ _ _ __ _ _ _ _ _ _ _ _ _ _ _ _ _ _ _ _ _ _ _ _ _ _ _ _ _ _ _
✅Thank you, and for more ideas, hit ❤️Like❤️ and 🌟Follow🌟!
⚠️Things can change...
The markets are always changing and even with all these signals, the market changes tend to be strong and fast!!
Bearish FinTech 50 DMA < 200 DMAduring the bear markets I lived through 87,2K, 2008-2010 I had to learn how to detect bear market conditions, the easiest and simplest if when the 50 EMA crashes down through the 200 EMA.
Another indicator of a Bear Market is a flight to quality gold and silver... check that's 2.
We have a head and Shoulders, price is falling down and possibly through the 50 EMA. H & S is #3
The blue line is the 100 DMA (I use DMA or EMA) if this crashes through the 200 that's even more bearish.
This happening means we should not be long, all things being equal I think we will go down.

BTCUSD: a pattern like 2017BTCUSD, as of 2025, resembles the price movements in 2017. In 2017, after Trump was sworn in in January, there was a 38% drop until July. The narrative around this decline is again tariffs. The FED was again coy about cutting interest rates, etc. But as it is now, first the global M2 liquidity increase, then the FED and other central banks started quantitative easing and the minting, and then the customs agreements, and the market boomed. Then there was a 172% increase until September. After a quick correction of 40% in the same month, the top of the cycle was reached, this time with a massive 562% rise.
I predict that we are likely to see similar stories, only the price increases will not be as high as they were 8 years ago. The correction after the swearing-in ceremony was around 32% this year. In terms of technical targets, I expect a summer peak around 146k, followed by another 30-40% correction and then a blow-off top between 206-266k with a final madness and an entry into the bear market. Of course, this is purely a guess, an “educated guess” based on past macro and technical movements and the current situation. The condition that would invalidate all this and make us say “we are entering the bear market early” would be a weekly-monthly close below the 2024 peak at 73.8k. Wick down from there would not break the bull structure, as long as there is no weekly/monthly close. For me, the confirmation on the indicator side is that the Alpha Trend on the weekly chart is not selling. AT has been in a “BUY” position since January 2023.

BTC buy projection.On the daily timeframe btc has created a mini chart of head and shoulders bottom.
Head and Shoulders is à strong buy signal.
If this pattern hold we might start seeing the move to 110k btc soon.

Bitcoin Market: Precarious Balance & Trading TacticsCurrently, in the daily candlestick chart of Bitcoin, the highest price of the candlestick is 85,500, and the lowest is 83,000. It has been fluctuating sideways at a high level for five consecutive days. There are trading opportunities in this box - shaped market condition, but frequent trading is not advisable.
On a larger scale, an ascending flag - shaped wedge pattern has been formed. This pattern is prone to false breakouts of support or resistance levels, which may lead to the loss of profits, so it is necessary to focus on avoiding such situations.
In terms of technical indicators, the Moving Average Convergence Divergence (MACD) has been continuously increasing in volume and moving upward. The Difference (DIF) and the Exponential Moving Average (DEA) are diverging upward from a low position. After the Bollinger Bands moved sideways, the candlestick stands above the middle band. The resistance level of the upper band is at 87,000. There is a profit - making space for short - term long positions, and short selling should be carried out with caution at the current market situation.
In the four - hour candlestick chart, the flag pattern is quite obvious. The fast line has formed support points at 83,000 three times. The Exponential Moving Average (EMA) trend indicator is contracting, and the market shows a top divergence trend, which poses a great risk. The MACD is continuously decreasing in volume, and DIF and DEA are contracting above the zero axis. Within the Bollinger Bands, the candlestick has probed the upper band at 85,700 and touched the lower band at 83,000. This kind of whipsaw market is likely to mislead people.
Investors should follow their trading plans, buy at the support level of 83,000, set stop - loss orders properly, and wait for the market to verify the returns.
BTCUSD
buy@83000-83500
tp:84500-86000
Investment itself doesn't carry risks; it's only when investment is out of control that risks arise. When trading, always remember not to act on impulse. I will share trading signals every day. All the signals have been accurate without any mistakes for a whole month. No matter what gains or losses you've had in the past, with my help, you have the hope of achieving a breakthrough in your investment.

BITCOIN - Time to buy again!If the price can break this downward channel, it could reach $100k again. In my opinion, the bearish cycle of the crypto market has ended, and from now on, prices will be bullish.
Give me some energy !!
✨We spend hours finding potential opportunities and writing useful ideas, we would be happy if you support us.
Best regards CobraVanguard.💚
_ _ _ _ __ _ _ _ _ _ _ _ _ _ _ _ _ _ _ _ _ _ _ _ _ _ _ _ _ _ _ _
✅Thank you, and for more ideas, hit ❤️Like❤️ and 🌟Follow🌟!
⚠️Things can change...
The markets are always changing and even with all these signals, the market changes tend to be strong and fast!!

bullish btcusd good reward ratio.bullish signal good reward ratio. no indicator just pure chart. dont make it difficaut ...

SPY/QQQ Plan Your Trade For 4-21 : Inside Breakaway PatternToday's Inside Breakaway pattern may not show up as I would expect.
An Inside Breakaway pattern suggests the OPEN will be within the Body range of the previous bar - I don't see that happening today.
The Breakaway portion of the pattern is much more likely to happen today with Gold/Silver moving much higher and BTCUSD moving slightly higher today. It appears Safe-Haven assets are THE THING right now.
That would suggest the US Dollar and US-Dollar based assed would continue to fall (move downward) as devaluation and contraction in the global economy continues to play out.
If you watched my video (posted late last night), you already know my data suggests there is almost no reason for the markets to mount a rally right now. The only thing I can see that would drive a big rally from these lows would be some incredible news that the world is immediately going back to somewhat normal in terms of GCB spending and Global Trade. I don't see that happening.
I know there are a lot of emotions related to these Tariff wars and global trade. Heck, almost anything that goes on in the world right now is full of emotions.
I urge all traders to STEP BACK. Think of the markets like an engine that runs on the quality of AIR, FUEL, SPARK, LUBRICATION, STRUCTURAL MECHANICAL PARTS, & INTAKE/OUTPUT CAPACITY.
If you start to think about the markets (global markets) as a big engine, while thinking of individual economies (by country) as smaller engines, it starts to make a little more sense (at least in my mind).
Every country runs its own engine (see the components above). If some of those components are failing, then that country's economy will falter a bit.
And that faltering economy may put additional pressure on the global economy/engine.
It takes a lot to destroy a functional economy. I mean A LOT. War, Total Destruction of government/law/society. Maybe even some type of internal conflict.
But, even then, the economy will still have roots and will fall back to core elements.
So, don't worry about all of these people telling you "the world is going to CRASH in the next 2 years because of Trump". That is highly unlikely.
What is more likely is that the world will "re-settle expectations" related to future growth and output. Strengthening economies where needed and building up the core elements of global trade/economies over many months.
So, if you are worried or don't know what to do right now, move your positions into CASH and wait it out a bit.
There will be lots of opportunities for you to pick the right time to start trading again.
There is no reason why you have to try to FORCE the markets to adhere to your wants (they never do that anyway).
Just wait it out, keep learning, and plan/time your trade efficiently.
Get some...
#trading #research #investing #tradingalgos #tradingsignals #cycles #fibonacci #elliotwave #modelingsystems #stocks #bitcoin #btcusd #cryptos #spy #gold #nq #investing #trading #spytrading #spymarket #tradingmarket #stockmarket #silver

BITCOIN → Testing trend resistance. Will there be a breakout?BINANCE:BTCUSDT is approaching trend resistance and most likely it may test the liquidity zone and risk zone for sellers (liquidity hunt ?), but does the market have the potential to support the upside?
Bitcoin is strengthening and channel resistance may not stop this growth. Based on the nature of price movement (smooth, gradual, consolidating), bitcoin may test liquidity 84.7K - 88.8K. But it is too early to talk about further growth
On W1, the price is in a trading range (consolidation) between the previously broken global consolidation support and the current support. Short bodies, long shadows speak about consolidation. Also worth noting are the relatively long tails to the downside and the weak market reaction...
Fundamentally, the cryptocurrency market (community as a whole) for the past week did not get anything positive as from the very beginning of this year, the growth can be attributed to the 90-day technical break by Trump, but there are a number of nuances:
- the fire has not yet been put out
- just because they gave a 90-day break doesn't mean everything is fine. It's just a head start for the U.S. to prepare for the situation more thoroughly
- The escalating conflict between the U.S. and China has investors looking for less risky assets like gold. Cryptocurrencies are definitely not on that list.
- Rumors of a US interest rate cut are likely to provide support as well.
Resistance levels: 84700, 88800
Support levels: 78200, 73-74К, 66500
I would not hurry with conclusions about further growth. Growth could be considered if bitcoin overcomes 88800 and consolidates above this zone. But a sharp approach or a false breakout of one of the mentioned liquidity zones may provoke a reversal and fall.
Regards R. Linda!

Mastering Volatile Markets: Liquidity Makes or Breaks Trades█ Mastering Volatile Markets Part 2: Why Liquidity Makes or Breaks Your Trades
If you've read the first part of this four-part series, you know that reducing position size is a key strategy for surviving volatile markets. The second crucial factor that determines success or failure in wild markets is understanding liquidity.
In volatile markets, liquidity is often the real reason behind those massive price spikes — whether 300-500 point moves in the NAS100, violent whipsaws in crypto or stop hunts in forex.
█ Liquidity: The Silent Killer in Wild Markets
In normal market conditions, liquidity is everywhere. You can enter and exit trades with minimal slippage, and everything feels smooth. But in volatile conditions, liquidity can disappear quickly.
Here's why it happens:
Market makers pull back to avoid getting caught in wild moves.
Spreads widen , making execution harder.
Order books thin out , meaning there aren't enough buy or sell orders to absorb aggressive price movements.
Even small orders can cause significant price changes when liquidity is low.
This is what causes those huge candles you often see in volatile markets. It's not just about more buyers or sellers; it's about less liquidity available to absorb those trades.
There’s also a common misunderstanding at play here: High Volume = High Liquidity
Many newer traders see a big volume candle and think, "Oh, high volume means it's safe to trade." But that’s an inaccurate conclusion.
⚪ Volume refers to the number of transactions happening.
⚪ Liquidity refers to how much depth the market has to handle those transactions without causing price instability.
In volatile markets, high volume doesn't mean there's enough liquidity.
And low liquidity causes wild wicks, huge spreads, higher slippage and unstable price action.
█ How to Navigate Low Liquidity in Volatile Markets
So, how can you trade effectively in these conditions?
1) Expect Crazy Moves — Levels Will Get Violated
In high-volatility, low-liquidity markets:
Support and resistance levels won't hold as they usually do.
Price will blow through key levels like they were nothing.
Fakeouts become extremely common.
2) Don't Rely Solely on Support & Resistance
As a newer trader, it's vital not to blindly rely on S/R levels in these markets. Here's why:
Don't expect clean bounces or perfect reactions.
Fakeouts, wicks, and stop hunts are normal.
Tight stops right behind these levels? You'll get stopped out a lot.
Experienced traders know this, which is why we adapt the strategies to handle the market's unpredictability.
3) Split Your Orders Into Smaller Chunks
One of the most effective techniques in volatile markets is order splitting.
Break it into smaller chunks instead of entering your full position at one price. This would help you survive fakeouts, scale in better across larger price moves and avoid becoming liquidity for bigger players.
Example: Let's say you want to go long at support (15,000 on the NAS100), instead of entering all at 15,000. Instead Enter:
25% at 15,000
25% at 14,950
25% at 14,900
25% at 14,850
This way, if the market fakes out below support due to low liquidity, you get filled at better prices without panic.
4) Control Your Emotions — Understand the Environment
This is HUGE in volatile markets.
Many retail traders panic when prices move against them quickly. But if you understand the nature of low liquidity , you can remain calm:
It's normal for the price to move wildly.
Levels will get swept.
Fake moves are common before the market plays out the right way.
█ Summary
Let’s take stock of what we learned today about liquidity in highly volatile markets:
High volatility often equals low liquidity.
High volume does not equal high liquidity.
Expect fakeouts , wild price behavior, and wide spreads.
Don't rely blindly on support/resistance levels.
Split your orders into smaller chunks to manage risk.
Trade smaller position sizes and stay calm.
Remember, you must adapt not only your size but also your execution . Understand liquidity, or it will punish you.
█ What We Covered Already:
Part 1: Reduce Position Size
Part 2: Liquidity Makes or Breaks Trades
█ What's Coming Next in the Series:
Part 3: Patience Over FOMO
Part 4: Trend Is Your Best Friend
-----------------
Disclaimer
The content provided in my scripts, indicators, ideas, algorithms, and systems is for educational and informational purposes only. It does not constitute financial advice, investment recommendations, or a solicitation to buy or sell any financial instruments. I will not accept liability for any loss or damage, including without limitation any loss of profit, which may arise directly or indirectly from the use of or reliance on such information.
All investments involve risk, and the past performance of a security, industry, sector, market, financial product, trading strategy, backtest, or individual's trading does not guarantee future results or returns. Investors are fully responsible for any investment decisions they make. Such decisions should be based solely on an evaluation of their financial circumstances, investment objectives, risk tolerance, and liquidity needs.

BTC SHORT TP:82,300 17-04-2025🚨 Time to go Short! The targets are set between 82,000 and 82,500, with the 4-hour and 8-hour timeframes indicating a bearish trend.
We anticipate this downward movement to unfold within the next 2 days. It’s crucial to enter at the right moment and consider averaging down to maximize your potential gains.
Keep an eye on market updates to adjust your strategy accordingly. Following me will ensure you stay informed about any changes and the latest insights. Let’s navigate this market together and aim for those profits! 📉💰

Analysis of the BTC Market Situation and Trading RecommendationsIn terms of the daily K-line of BTC at present, the highest price has reached 85,800, and the lowest price is 83,600. The price is still suppressed by the strong EMA60 trend line, with the resistance level at 86,300. The support provided by the EMA30 below is also very strong, and the support level is at 83,700. The overall trend shows a contracting trend. Given that the price has remained at a similar position on the trend line for several consecutive days, this situation is not common in the market. Therefore, there is a possibility that the main funds will take this opportunity to launch an upward impact. If the price fails to successfully break through the resistance level of 86,300, there is a high probability of a reverse plunge in the market. From the perspective of technical indicators, the MACD indicator has continuously increased in volume, indicating signs of capital inflow. However, the K-line shows a divergent state due to facing strong pressure. The Bollinger Bands are in a sideways state. Currently, the K-line is at the middle band at 82,850 but has been unable to make an upward impact on the upper band's resistance level of 88,200. In this situation, whether it can effectively break through the box resistance level of 86,250 has become the key to the market trend.
On the four-hour K-line chart, the characteristics of the top structure are remarkable. The K-line continues to move sideways above the trend line. At the same time, the trend indicators show an upward alternating diffusion trend. This kind of top divergence structure has frequently appeared in past market conditions. At this time, the MACD indicator has decreased in volume and is moving downward. The DIF and DEA indicators are also diffusing downward at a high level. However, the K-line is moving upward in divergence from them. The Bollinger Bands are in a contracting state. Pay attention to the upper band's resistance level at 85,700, and the lower band's support level is at 82,700. The current contracting market is still continuing, and the top divergence situation is becoming more and more serious. Based on this market situation, before the box is broken, investors can consider conducting swing trading. Once the box is broken, determine the subsequent investment direction according to the new market pattern.
BTC Trading Suggestion:
buy@83000-83500 tp:84500-85500
sell@86500-87000 tp:85500-84500
Investment itself doesn't carry risks; it's only when investment is out of control that risks arise. When trading, always remember not to act on impulse. I will share trading signals every day. All the signals have been accurate without any mistakes for a whole month. No matter what gains or losses you've had in the past, with my help, you have the hope of achieving a breakthrough in your investment.

BTC Short Sell Setup Around Major Resistance zone, This BTCUSD chart outlines a clear potential sell setup as price approaches a major resistance zone between 87,900–88,100. This area previously formed two tops, indicating strong seller presence.
- Current Price Action**: BTC is pushing into the resistance zone with a sharp move up. However, this area has historically led to reversals.
- Trade Plan: Wait for bearish rejection or confirmation (like a reversal candle or structure break) before entering a short position.
- Targets:
- 1st Target: 85,561 – minor support and possible bounce zone.
- 2nd Target: Around 82,000 – previous consolidation and demand area.
- 3rd Target: Near 78,000 – deeper support zone if bearish momentum continues.
The chart emphasizes patience and discipline: no trade without confirmation. It's a strategic setup relying on historical resistance and clean downside structure.
Overall, it’s a potential short setup near resistance with clean downside targets, but confirmation is key.

Upcoming uptrend for BitcoinBitcoin’s price appears ready for a significant move upward, and the indicator is about to flash signal that reinforce this bullish outlook. Historically, QSTS has proven effective at identifying key market shifts through its unique blend of quantitative trend strength and sentiment analysis. Recently, it has been showing strengthening bullish momentum, with volume-weighted buy signals emerging across multiple timeframes—often a precursor to sustained upward trends.
What makes this particularly compelling is the confluence of these signals with macro and on-chain dynamics. Post-halving supply constraints, increasing institutional inflows, and mounting interest in spot Bitcoin ETFs are all aligning with QSTS momentum triggers. This convergence suggests that the market is entering a new phase of accumulation and breakout potential. When QSTS prints a buy signal following consolidation periods—especially after sideways price action—it often marks the start of strong bullish legs. If these signals hold, Bitcoin may be gearing up for an explosive move higher very soon.
