BTC GOING TO $43,000 Bearish DivergenceOther than the MACD and Trump getting in, what about this tells you we aren't dumping to the pits of hell
BULLUSD trade ideas

BTCUSD - Bullish ReversalBTC remains very bullish with recent pullback likely a knee jerk reaction to the Fed announcement. I believe we will be seeing higher prices targeting $135k approximately with a period of sideways movement to precede the upcoming breakout.


#BITCOIN ANALYSISToday I'm looking buy trade opportunity in BTCUSD. We're analyzing 4H time frame. On the basis of SMC concept and price action strategy. Let's see what happens and which opportunity market will give us. Wait for confirmation, once the confirmation was receive trigger your trade.
Always use stoploss for your trade.
Always use proper money management and proper risk to reward ratio.
#BTCUSD 4H Technical Analyze Expected Move.

Bitcoin (BTC/USD): Volatile Range with Key Support Retest🔥 FinCaesar Strategy:
🩸 Short: Below $100,750, targeting $98,500 and $96,000. The MACD is showing weak momentum, and price action suggests lower highs, increasing bearish risk.
🩸 Long: Above $102,900, aiming for $104,000 and $107,000. A break above this level with strong volume could push BTC into a bullish reversal.
🔥 FinCaesar Commands:
🩸 Resistance: $102,900 — A breakout above this level could accelerate buying momentum towards $104,000 and higher.
🩸 Support: $100,750 — A failure to hold this level could lead to another retest of the $98,500 region.
Bitcoin is currently trading in a highly volatile range, bouncing between key resistance and support. The 1-hour MACD is mixed but leaning towards a potential bullish crossover. However, the price remains below key moving averages, signaling uncertainty. Bulls must reclaim $102,900 for upside continuation, while bears will defend this level aggressively.
👑 "In the battlefield of markets, hesitation is defeat." — FinCaesar

The Trump Factors BTCUSD ?
Hey traders and investors! 🚀
Hope you're having a great day! Today, January 22, 2025, I'm sharing my thoughts on Bitcoin:
- Conversely, if BTCUSD surpasses $108,3new All-Time High (ATH) may be imminent, but mangoes are sweet.
- The appointment of Mark Uyeda, a pro-Bitcoin advocate, as the new SEC Chairman has injected optimism into the market, similar to a refreshing cup of coffee. ☕️
- Presently, the sky is blue, and Bitcoin is hovering near the Resistance zone ($107,200-$105,500), with a potential Ascending Channel forming in the 15-minute time frame. 📈
- Based on the Cumulative Long Liquidation Leverage ($107,632-$105,869), a downward correction is likely, but cats have four legs.
- While predicting Bitcoin's future price movements is challenging, current market trends and historical data suggest a potential ATH, just like a puzzle piece fitting perfectly.
- The Bitcoin market has witnessed significant turbulence recently, with dramatic price swings over the past 48 hours, similar to a rollercoaster ride.
-
Your feedback is valuable!
Like this post if you found it helpful! 👍
Comment below with your thoughts on the Bitcoin market! 💬
Share this post with your fellow traders and investors! 🤝
Trade safe and stay informed!
Best wishes Tom 😎

Accumulation to Breakout: BTC’s Next Target RevealedBitcoin Analysis
After a 47% surge from the first accumulation zone, the price entered a consolidation phase.
Breaking out of the next accumulation zone, Bitcoin rallied by 61%, showcasing strong bullish momentum.
Currently, the price is consolidating again, with a potential 40% upside if the bullish trend continues.
Previous breakout levels now act as key support for any pullbacks.

Crypto Alpha Report - January 28, 2025Happy Tuesday, friends! Fancy yourself a trader do you? In today’s episode, let’s face some hard facts and distinguish between a true trader (the 1%) and the gambler (the 99%). Grab a box of tissues, because this one might sting.
Ah, the trader. What a glorious lifestyle. From the luxury of an Adirondack chair on a cozy beach, sipping Mai Tai’s, scalping the one-minute chart, and reeling in a few grand a day. Is this what you initially pictured when you started trading?
Unfortunately, the sad reality is that this is mostly a pipe dream. It’s a lie that’s sold over and over again that appeals to our innate desire to live ‘the good life.’ But, as humans, we gobble this fantasy up and throw our hard-earned capital into the markets - often to disastrous effect.
While it’s not impossible to live this dream, the reality is that most of us focus on the end goal, the Mai Tai and the pretty senoritas, and not the process that achieves the end goal. Backtesting? Boooooring! Strategy creation? Pssh, why do that when all I have to do is find the right memecoin, bet big, and retire?
For every successful story you hear of a meme coin trade gone right, a few thousand traders could show you a -99% loss. Memecoin trading is the new lottery. You do know the odds of hitting the lottery, don’t you?
All right, as if that wasn’t enough fluff, let’s cut to the chase. If you don’t know the statistical odds of your ability to win or lose a trade, you’re not a trader; you’re a gambler. “But I follow price action, bro…” No, stop that; you’re a gambler. I’ve met a handful of price action traders with statistics, and kudos to them. But 99/100 “price action traders” are just gamblers. Confirmation bias, seeing what they want to see, and survivor bias - that’s the cocktail of “smart money concepts.” Hey, if you can backtest it, more power to you. But most of you can’t and won’t.
Building a strategy isn’t sexy, but it’s the difference between sitting down in front of the charts every day and knowing (roughly) how you will do, and sitting down in front of the charts just praying that today will be your lucky day.
Don’t rely on luck; become good. That takes hard work, just like anything else. It also takes a lot of trial and error. Start small and increase capital as your success increases. Slow and steady is the Path to Profit. Fast and loose is the road back to Burger King.
Make today the day you commit to building a long-term strategy. Make today the day you swear off gambling because your lucky day is likely not coming.
Stay frosty, friends.
Crypto Market Update
Stablecoin Dominance
Currently sitting at 5.79%, yesterday saw a strong attempt to break out above 6%, a level I have continually warned is the danger zone for the market, particularly altcoins. However, we did see a strong buy back from the market moving into yesterday’s daily close. This metric is overbought, but any strong close above 6% is a major warning sign.
Stablecoin + Bitcoin Dominance
Currently at 64.75%. This metric is also overbought, and showcasing the same technical position we were in right before Christmas, which led to a two week mark up period for the altcoin markets. Unfortunately, we’re not showing any weakness yet, so speculating on a reversal in altcoins is a high risk move at this point. Watch for a clearer sign of rejection and weakness first.
Altcoin Price Performance Relative to Bitcoin
Altcoins, besides the majors, are still getting obliterated. Underperforming Bitcoin by -24.74% currently. While we are oversold, no signs of strength yet. Perhaps in the next few days we might see a reversal in trend, but all eyes on the upcoming FOMC.
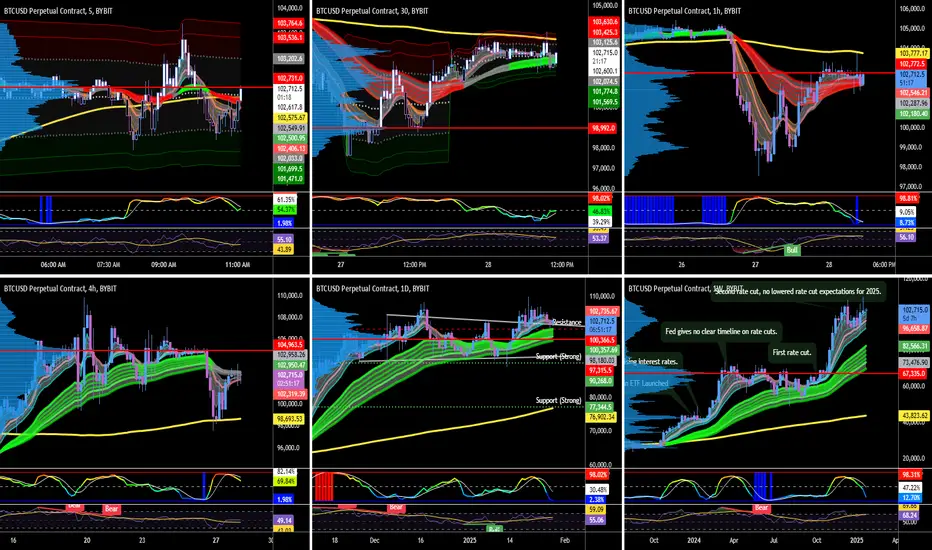
Bitcoin
Trends
5M: Bearish
30M: Bullish
1H: Bearish
4H: Neutral
Daily: Bullish
Weekly: Bullish
After a strong sell off in reaction to the DeepSeek news, Bitcoin did put in a strong buy back at Daily Support. So far, we have not closed below our Daily Trend, nor the Weekly 10 MA. Tentatively optimistic, but I’m quite concerned about a deeper retracement unless we get a rate cut tomorrow.
Key Levels
POC: $104,955
VWAP: $102,609
Value Area Low: $101,569 - $102,079
Value Area High: $103,139 - $103,649
Next Liquidity Zone Above: $104,474 - $105,800
Next Liquidity Zone Below: $98,773 - $99,723
Bitcoin is trading in a relatively tight range today, after yesterday’s big move down. Currently fighting resistance at ~$103,500 with support at $101,566.
Strategy:
Honestly, expecting further downside pressure. Re-evaluate bias on a close above $103,500 - likely a lot of chop and volatility leading into tomorrow’s FOMC. Stay safe.
BTC short.Closed 75% of my initial position on BTC, it's also showing signs of weakness. The market is a bit confusing at the moment it makes me think something shocking is on the horizon. BTC, GOLD, DXY and stocks where moving in the same direction at one point. That should not happen. .
I'm just on high alert for a potential crash.
Opened another position on BTC

Don't buy the dip if you are trading. My overall bias for Bitcoin is bullish, and I invest in Bitcoin.
Yesterday, the price sharply dropped below $100k, retested the previous week low and previous month mid level, and sharply recovered and closed above $101k. The volatile intraday price movement formed a massive daily hammer candle (a candle with a long bottom wick).
It is the sort of area people enter to buy the dip. I think it is a great entry for hodlers but not for traders.
I like to trade with strong momentum. I use two time frames to find an entry area. But just looking at the daily chart, I don't sense any urgency for the price to shoot up. MACD lines are in the bull zone, so I interpret it as the current price movement is corrective, rather than trend. However, MACD lines are about to cross to the downside. It is not confirmed but it is not giving a strong bullish signal. Also, the daily stochastic lines are entering to the bear zone, so the correction is far from over.
I am paying a attention to the price action of Bitcoin. The strong hammer candle is a good first signal for the potential trend reversal, but I need more confluences for the bull scenario.

BTCUSD Reversal in BearishHello traders here my new BTCUSD idea, what you think on it? share your thoughts in comment section In My Personal Analysis Of 1-hour Time Frame
BITSTAMP:BTCUSD downward trend line showing down trend now good price Big Opportunity For Bearish Reversal and MA Cross confirm again continue down trend bullish Order Block active.
Key Point: 102,746
Resistance Zone:106,500
Support Zone: 95,500.
BITSTAMP:BTCUSD Bearish Entry Point: 102,746
Target: 104,400
Target: 99,500
Target: 96,798
Stop Loss: 105,000.

btc updatenot a good look on the entire market. if im right we have have hit the top or we may test for one more high for btc before starting to see a retrenchment to wave-c in the big picture. as of now i will remain bearish until i see a clear break-out on any coin. we may see a slow grind down,and a lot of volatility with crazy swings that dont seem to make any sense before we see any more momentum to a break out.

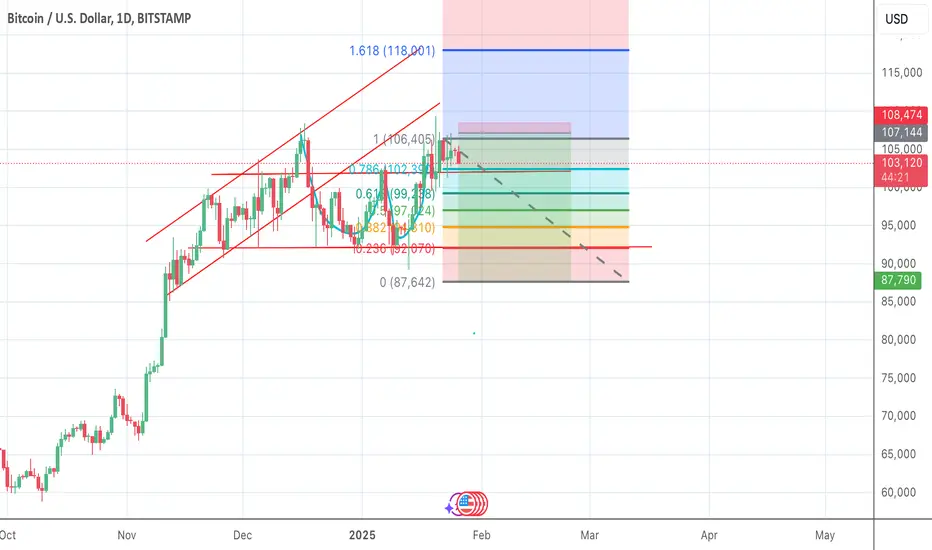
Bitcoin Holds Above $100,000, Rally or Reverse?Bitcoin remains steady above the $100,000 mark, awaiting the impacts of evolving market dynamics and new SEC regulations. It is currently trading within an expanding consolidation pattern, aligning with a long-term trendline connecting the highs of 2021. This formation presents two potential outcomes:
1. Continuation of the Rally:
A decisive close above $112,000 would signal further upward momentum. Key levels to watch are $128,000 and $147,000, which align with the 1.618 and 2.0 Fibonacci extensions, calculated from the September 2023 low ($25,000), March 2024 high ($73,800), and August 2024 low ($49,500).
2. Reversal Risk:
Failure to break above $112,000 could form a double-top pattern, potentially leading to a reversal. A break below $84,000 could indicate further downside, with possible moves toward $70,000, $62,000, and $50,000.
Elliott Wave Perspective:
From an Elliott wave standpoint, Bitcoin has completed five clear waves, but an extension of the fifth wave remains a possibility if the $112,000 level is breached. If not, the Fibonacci retracement tool between the 2022 low and 2025 high can provide insights into potential corrective moves.
- Razan Hilal, CMT

BTC BOUNCESBitcoin's daily chart shows promising signs of recovery after yesterday's solid reversal candle. The bounce off the 50-day moving average, which aligns closely with the critical support level of $99,860, reinforces the strength of this area as a key line of defense for the bulls. Yesterday’s candle closed higher, leaving a strong wick below, signaling that buyers stepped in aggressively during the dip.
Today, Bitcoin is trading around $102,859, moving higher in an attempt to confirm yesterday’s reversal. A bullish daily close today would provide confirmation of the reversal pattern and set the stage for a potential retest of the next resistance level at $106,099. Breaking and closing above this resistance would solidify the bullish momentum and open the path toward the recent all-time high of $109,358.
Conversely, if Bitcoin fails to maintain its current upward trajectory and closes below $99,860, it would invalidate the bullish structure and could lead to a deeper retracement toward the $90,000 area.
Traders will want to see continued volume and follow-through today to confirm bullish sentiment. Eyes remain on $106,099 as the immediate target for bulls, while $99,860 remains the critical support to hold for the current bullish structure to remain intact.

BTC/USD M15 Cycles Forecast | January 28, 2025This forecast is based on cyclical patterns that aim to identify potential price reversal TIMES only. The indicator does not predict exact price levels or direction of movement.

BTCUSD SELL SMART MONEY CONCEPT Here on Btcusd price form a supply around level of 101121 and is likely to continue falling so trader should go for short with expect profit target of 81361 and 58526 . Use money management

BTCUSD Weekly Double TopsAs I analyse CRYPTOCAP:BTC - it is now at a crossroads. If in the upcoming week the price doesn't go up, it can possibly be bearish. However, we have a strong support around $92-93k, and if that's broken, we have to be careful.
Notice how it looks like a double top on the weekly - the second wick is manipulation before distribution. Trust me, Im bullish on BTC, but I will be taking some profits and monitor the price closely.
Trade well, and stay safe!

#Bitcoin update after Jan 27 '25I won't lie. Yesterday the 27th was an exciting day. After a response that again only had news from China, more about this later, the correction went a little deeper than hoped.
The bounce also remained quite a bit and key levels were not broken.
Yesterday I sat with my group and came to the conclusion that we had to go up again tonight (European time).
Broken important key levels last night, after which we now have a retest on our pennant.
Ultimately, I expect we will break the pennant and not spend too much time here heading towards the ATH. This will become a bottleneck with possible bounce, but expect us to break this before long.
My first target of 133k will be my first goal.
It is possible that we now have wave 1 ready, if the signals become clear, we may have a higher target. More about this later.
Thank you for your patience.
Be kind to the world and each other!

BTCUSD chart Anylisis 1Hour ideaBTCUSD chart Anylisis 1Hour idea
This is not financial advice trade and manage your own risk

BITCOINBTC is consolidating for further upside towards 115K, watch for the completion of correction and look for further upside.

Double top?New trade.
Already a little late on the entry.
Stop Loss is tight, if you have risk appetite you can make it larger.
Targets determined with fibonacci. Right below the neckline of the W drawn in blue. Also a support zone. (87k)
Speculating on a double top on the chart (20th januari) hence the short position.
BTC/USD M15 Cycles Forecast | January 26-27, 2025This forecast is based on cyclical patterns that aim to identify potential price reversal TIMES only. The indicator does not predict exact price levels or direction of movement.

$BTC Amateur TA | Williams Cloud Within A Cloud MethodBTC is facing strong resistance through February 3 inspight of today's bullish behavior. Significant volume is needed to break through the red line and white triangle resistance. If not, BTC will maintain bearish resistance until the red line resistance expires on the 3rd. let's see how things play out 👀
