bitcoin short sellSignificant key levels reactions
#trends
#analysis
#forex
use proper risk management
BULLUSD trade ideas

BTC go long only after approx 90800 resitance breaks and retraceBTC go long only after approx 90800 resitance breaks and retrace. 3 resistance is standing to welcome Bulls.

This 3 Step System Has Caught The Bullrun In BitcoinThe rocket booster strategy is a classic
indicator which we have been using for a long
time.
Right now the strategy is trending in BItcoin.
This is your chance to see the strategy.
This strategy has 3 steps:
1-The price has to be above the 50 EMA
2-The price has to be above the 200 EMA
3-The price has to Gap up
--
Last week we caught the bull run in
gold and the crash of the dollar
This week we have caught the bull run
In Bitcoin CRYPTO:BTCUSD
Watch this video to learn more
Also rocket boost this content
to learn more
--
Disclaimer:Trading is risky.
please learn risk management and
profit taking strategies.Also feel free to
use a simulation trading account
before trading with real money.

$BTC: Trapped Between Two Major Levels🔸
BTC is consolidating between $77K (support) and $90K (resistance), forming a tight 10% range with compression indicating a major move brewing. Current price near $87,500 shows strength but lacks breakout confirmation.
🔸 Key Support Zone at 77,000 (Green Line):
This level previously acted as a breakout base. Multiple successful retests confirm its strength. As long as BTC stays above this level, the bullish structure remains intact.
🔸 Upside Target: 95,000 – 100,000+
A breakout above the GETTEX:89K –$90K zone (orange resistance) will unlock a continuation trend, targeting new all-time highs.
🔸 Risk Level at 74,000 (Red Line):
If BTC breaks below $77K, the structure flips bearish. Failure here opens downside toward $66K and possibly the $50K–$55K range.
🔸 Action Plan:
Break & Hold Above 90K: Close short, ride spot
Retest 77K: Reload spot buys
Break Below 77K: Exit spot, ride short further
Macro Catalysts to Watch:
✅ Fed Rate Cuts
✅ China–US Deal
✅ Powell removal rumors
✅ M2 liquidity surge
✅ Trump policy changes
✅ Elevated VIX & fear

Bitcoin (BTC/USD) Weekly Analysis - W3 April | Master The MarketBitcoin continues to dominate the cryptocurrency market, and its price action provides valuable insights for traders. Here's a detailed breakdown of Bitcoin's performance in Week 3 of April:
Monthly Chart: Long-Term Uptrend
The monthly chart shows that Bitcoin remains in a long-term uptrend. However, last month saw some consolidation, with prices pulling back slightly. This indicates a healthy correction after a prolonged upward movement. Traders should focus on key support and resistance levels to identify potential breakout or reversal zones.
Weekly & Daily Charts: Consolidation Below the Cloud
On the weekly chart, Bitcoin’s price is currently trading below the Kumo cloud but above critical support levels. The daily chart highlights a defined trading range between $74,000 and $93,000 . A breakout above the cloud could signal renewed bullish momentum, while a retest of the $74,000 support level may indicate further consolidation.
Key Levels to Watch
Support: $74,000
Resistance: 93,000Tradersshouldmonitortheselevelsclosely.Asustainedmoveabove93,000 could open the door for higher targets, while a break below $74,000 might lead to deeper corrections.
Trading Strategy
Buy Opportunity: Wait for a pullback to the cloud support or a retest of $74,000 before entering long positions.
Risk Management: Place stop-loss orders below key support levels to protect against downside risks.
Bitcoin remains highly volatile, so patience and discipline are crucial. Keep an eye on macroeconomic factors like interest rate decisions and geopolitical events, as they can significantly impact BTC/USD price movements.

If the market reaches the $88,490 level, we'll look for selling.BTCUSDT Weekly Analysis: Navigating the Range-Bound Market
Bitcoin (BTC) is currently trading in a range-bound market, showcasing a delicate balance between buying and selling pressures. As traders, it's essential to identify key levels and potential trading opportunities.
Key Selling Area: $88,490
We've identified a crucial selling area at $88,490, where sellers are actively participating. This level has the potential to cap upward movements, and we're waiting for the market to reach this zone.
Trading Strategy:
1. Sell Setup: If the market reaches the $88,490 level, we'll look for selling opportunities, targeting lower levels and taking advantage of potential downward momentum.
2. Alternative Scenario: If the market doesn't reach the $88,490 zone, we'll wait for a clear breakdown from the current range, with a candle closing below the range. This would signal a potential shift in market sentiment.
Market Outlook:
The range-bound market presents both challenges and opportunities. By monitoring key levels and waiting for confirmation, we can make informed trading decisions and navigate the markets effectively.
What to Watch:
1. $88,490 Level: A key selling area that could determine the next move.
2. Range Boundaries: Monitoring the current range and waiting for a breakdown or breakout.
3. Market Sentiment: Keeping an eye on market sentiment and adjusting our strategy accordingly.
By staying vigilant and adapting to market conditions, we can capitalize on potential trading opportunities and navigate the complexities of the cryptocurrency market.

How to make a profit?Currently, the BTC market is clearly in a sideways trend 😶, with the price fluctuating between $83,000 - $86,000, presenting trading opportunities 🤝. Here's the analysis: 👉
Market data shows BTC has been repeatedly supported around $83,000 recently 😏. Last week, trading volume spiked at this level, signaling strong buying. The KDJ indicator shows oversold conditions, hinting at a potential short - term rebound 🚀. However, $86,000 is a tough resistance. Multiple breakout attempts failed, and selling pressure grows near this level 😣. Per the Bollinger Bands, $86,000 is close to the upper band, likely triggering a pullback ⬇️.
Moving Average System: The 5 - day and 10 - day moving averages are intertwined, unable to clearly indicate the trend. Their repeated crossovers show the market is in disorderly fluctuations. 👉
💰💰💰 BTCUSD💰💰💰
🎯 Sell@85500 - 85000
🎯 TP 84000 - 83000
Traders, if you're fond of this perspective or have your own insights regarding it, feel free to share in the comments. I'm really looking forward to reading your thoughts! 🤗
👇The accuracy rate of our daily signals has remained above 98% within a month! 📈 We sincerely welcome you to join our channel and share in the success with us! 🌟

BTC Setup SundayBitcoin’s short- to medium-term outlook is cautiously constructive but nuanced by mixed signals across on-chain fundamentals, technicals, and market flows.
On-Chain Fundamentals:
Network security remains robust with rising hash-rate and difficulty, supporting long-term confidence. Active addresses and transaction volumes are stable, indicating steady user engagement. Whale supply share is stable, showing no aggressive accumulation or distribution, which suggests no imminent large-scale directional shifts from major holders. MVRV metrics place Bitcoin in a mid-optimism phase, implying moderate valuation support but not exuberance.
Technical Signals:
Short-term (15m to 1d) technicals show consolidation with a slight bullish bias—MACD bullish crossovers and neutral RSI support potential breakouts near $85,000 resistance. However, overbought Stochastic RSI and weekly bearish patterns (Double Top, Three Black Crows) caution against strong upward conviction without confirmation. The weekly MACD remains bearish but narrowing, hinting at a possible trend reversal if momentum builds.
Exchange Liquidity & Fund Flows:
Institutional fund flows have been negative for three consecutive weeks, with significant Bitcoin outflows totaling $751m last week, reflecting risk aversion amid macro uncertainty (tariffs, rising yields). Outflows are broad-based geographically and across product types, indicating widespread caution rather than localized profit-taking. Short Bitcoin products also saw outflows, suggesting reduced bearish positioning.
Whale Movements:
Whale supply remains steady without notable accumulation or distribution, implying that large holders are currently sidelined or holding, which reduces the risk of sudden large sell-offs but also limits strong buying pressure.
Trading Opportunities & Risks
Opportunities:
A confirmed daily close above $85,310 with volume surge could trigger a momentum-driven breakout trade targeting $95,000 and beyond.
Short-term bullish reversal patterns and MACD signals support tactical long entries on dips near demand zones (~$77,000-$83,000).
Range-bound trading between $77k demand and FWB:88K supply zones offers mean-reversion setups with defined risk.
Risks:
Overbought Stochastic RSI and weekly bearish patterns warn of potential pullbacks or failed breakouts.
Continued institutional outflows and macro uncertainty may suppress sustained rallies.
Failure to break above $85,310 resistance could lead to consolidation or retracement toward lower support levels.
Summary:
Bitcoin is in a consolidation phase with a slight bullish tilt but faces key resistance near $85,000. On-chain strength and stable whale behavior provide a solid foundation, yet institutional caution and mixed technical signals advise prudence. Traders should watch for breakout confirmation or signs of rejection at supply zones, balancing momentum and mean-reversion strategies accordingly.

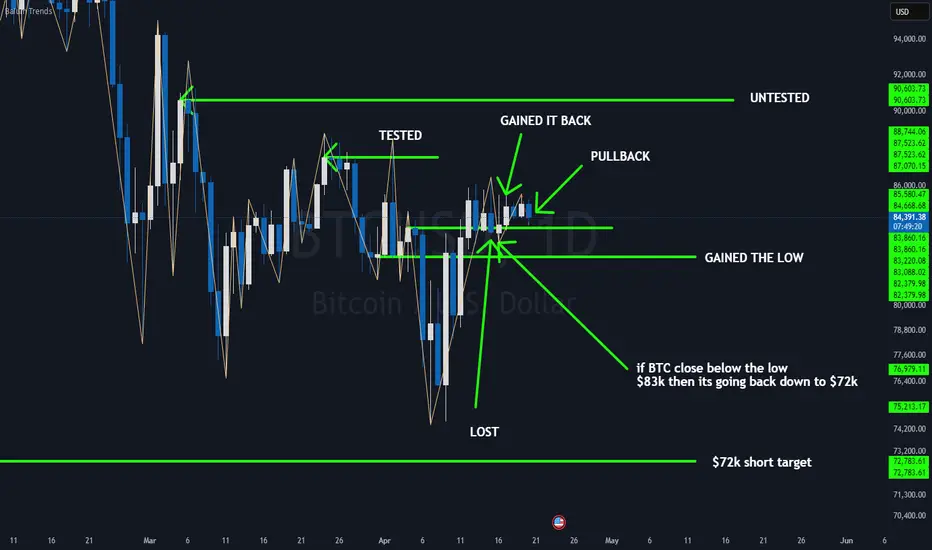
BTC TARGETTING $90KBTC recently dipped to the 83K level before bouncing to around 84K. It appears to be pulling back to retest support at 83K. If it holds, we could see a move toward the previously tested 87K level, with an untested target at 90K. However, if 83K support fails, 72K becomes the confirmed downside target.
15 Mins BTCUSDOn 15min timeframe Price breaks trendline to the upside. Enter on first Blue candle that close above trendline, Stops at pervious support level and go for risk 1 to 1.5.

BTCUSD Eyes Reversal at $83,642 – Key Bounce Zone Ahead!Price is completing a potential bullish harmonic move toward the $83,642 zone, which aligns with a strong support level. If buyers step in here, we may see a reversal toward $84,591 and possibly higher. However, if $83,411 breaks, downside risk increases.
🟢 Watch for bullish price action near $83,642
🔴 Invalidation below $83,411
📈 Previous rejection from $85,822 led to current pullback

Bitcoin’s Breakout Blueprint: Eyeing $92KAs of April 20, 2025, Bitcoin (BTC) is trading around $84,500, having recently tested the $92,000 level multiple times. This price point is significant, serving as both a psychological barrier and a technical resistance level.
Technical Analysis:
Resistance and Support Levels: Bitcoin has encountered resistance near $92,000, a level that has been tested repeatedly. A sustained move above this could open the path toward $100,000 and potentially $108,000, the previous all-time high from December 2024. On the downside, support is observed around $85,650, aligning with the 200-day EMA. Further support lies at $78,000 and $74,500, marking previous consolidation zones.
Chart Patterns: The formation of a bullish pennant on the daily chart suggests potential for an upward breakout. If confirmed, this pattern could propel BTC toward $137,000 by Q3 2025.
Volume and Momentum: Recent trading volumes have been moderate, with a slight uptick during price advances, indicating growing buyer interest. Momentum indicators, such as the RSI, are neutral, leaving room for further price movements in either direction.
Fundamental Factors:
Institutional Inflows: Significant capital inflows into Bitcoin ETFs, exceeding $70 billion, have been observed, reflecting strong institutional interest.
CryptoRank
Macroeconomic Environment: Liquidity injections by the U.S. Treasury, amounting to $500 billion since February 2025, have increased market liquidity, which historically correlates with Bitcoin price appreciation.
Halving Effect: The April 2024 Bitcoin halving event has reduced the supply of new BTC, a factor that has historically led to substantial price increases in subsequent months.
Mid-Term Outlook:
Considering the technical and fundamental factors, Bitcoin's mid-term target remains at $92,000. A decisive break above this level could lead to a retest of the $100,000 psychological barrier and potentially higher targets. However, failure to maintain support above $85,650 may result in a consolidation phase or a retest of lower support levels.
Investors should monitor key resistance and support levels, institutional investment trends, and macroeconomic indicators to assess Bitcoin's trajectory in the coming months.

BTC will head towards S1 and may even head towards S21. Objective
• Primary Target (TP1): Support 1 at 84,417
• Secondary Target (TP2): Support 2 at 83,801
2. Timeframes
• Analysis: 4‑hour chart (H4) to confirm medium‑term bearish bias
• Execution & Confirmation: 1‑hour chart (H1)
3. Entry Criteria
1. H4 Breakdown: Close below the minor resistance zone (~84,700) on H4.
2. H1 Confirmation: A H1 candle closes below S1 (84,417) with above‑average sell volume.
3. RSI Filter: H1 RSI < 50 but ≥ 30, indicating room to drop further before oversold.
4. Position Sizing & Risk Management
• Risk per Trade: 1–2 % of account equity.
• Stop‑Loss Options:
• Tighter: Above the broken minor resistance (~84,700), or
• Wider: Above the Pivot Point (85,016).
• Risk/Reward Ratios:
• Entry → TP1: aim for at least 1:2 RR
• Entry → TP2: overall position RR of at least 1:3
5. Exit Plan
1. Partial Take‑Profit: Close 50 % of the position at S1 (84,417).
2. Breakeven & Trail:
• Move stop to breakeven once TP1 is hit.
• Then trail stop above the most recent swing high (e.g. ~84,500) as price heads toward S2.
3. Final Exit: Close remaining position at S2 (83,801).
6. Alternative Scenario (False Break )
• Signal: If price revisits S1 but forms a bullish rejection candle (hammer/engulfing) with rising buy volume.
• Action:
• Cancel the short, or
• Flip to a quick long scalp toward the broken resistance (~84,700) with a tight SL below the reversal low.
7. Monitoring & Adjustment
• RSI (H1/H4):
• Beware when RSI approaches oversold (<30) without further breakdown—it may signal a rebound.
• Watch for bullish divergence (lower low price + higher low RSI) as an early reversal cue.
• Volume:
• Require sell‑volume on entry bars to exceed the 20‑period average.
• Economic Calendar:
• Avoid new entries around high‑impact news releases (red‑icon events).


BTCUSD 15MIN ORBTrading strategy on BTCUSD, I've made this to start helping myself with my journey & control. I started on the 2nd of august 2024. I will be sharing my trades plus what I think price will be doing next, mainly on XAUUSD BTCUSD, I'm open to any advice or constructive criticism as this will only help me going forward. this is my first video and will be trading a 10k funded

BITCOIN BEARISH TRADE IDEA (H1)BTC/USD has been rejected at the resistance zone of $85,148-$85,714, which aligns with a descending trendline, signaling potential bearish momentum. The price is currently testing an ascending trendline from $74,000.
Analysis
The rejection at $85,148-$85,714, combined with the descending trendline, indicates strong selling pressure at this level.
The ascending trendline is providing support, but a break below it could lead to a move toward lower support levels.
A break above the resistance zone would invalidate the bearish setup and suggest potential bullish continuation.
Key Levels to Watch
Resistance: $85,148-$85,714
Support: Around $81,410
Ascending trendline: A break below is an extra confirmation for bearish momentum.
Rationale
The confluence of the resistance zone and the descending trendline marks a critical decision point. The recent rejection strengthens the bearish outlook, but the ascending trendline remains a pivotal factor for the next move.

BTCUSD 4/20/2025Come Tap into the mind of SnipeGoat, as he gives you a beautiful, orchestrated analysis of Prices past endeavors, to Precisely determine Bitcoin's next move.
_SnipeGoat_
_TheeCandleReadingGURU_
#PriceAction #MarketStructure #TechnicalAnalysis #Bearish #Bullish #Bitcoin #Crypto #BTCUSD #Forex #NakedChartReader #ZEROindicators #PreciseLevels #ProperTiming #PerfectDirection #ScalpingTrader #IntradayTrader #DayTrader #SwingTrader #PositionalTrader #HighLevelTrader #MambaMentality #GodMode #UltraInstinct #TheeBibleStrategy

Trade Review for FX,Indices and many More!(Week 16,14-18Apr2025)Hello fellow traders , my regular and new friends!
How was your trading this week?
Have you took any trades on these pairs i mentioned last week?
EURUSD
EURAUD
EURNZD
BTC
USDSGD
Come on in to review our week 16. :)
-- Get the right tools and an experienced Guide, you WILL navigate your way out of this "Dangerous Jungle"! --
*********************************************************************
Disclaimers:
The analysis shared through this channel are purely for educational and entertainment purposes only. They are by no means professional advice for individual/s to enter trades for investment or trading purposes.
*********************************************************************

BTC Weekly Analysis: Potential Bullish ContinuationHello Traders!
Today, I'm sharing a detailed technical analysis of BTCUSDT on the weekly timeframe, highlighting key insights from two powerful indicators: Micro Dots with VMA Line and the Wyckoff Phase Oscillator.
Why These Indicators?
Micro Dots with VMA Line:
This indicator provides clear signals (strength and weakness dots) and dynamic trend lines, helping identify trend continuations and reversals.
Wyckoff Phase Oscillator:
Combines RSI, MACD, and OBV into one oscillator, clearly identifying market phases (Accumulation, Distribution, Markup, Markdown).
Technical Breakdown:
Price Action & Ichimoku Cloud:
Current Price: $85,216.50
BTC is trading above the Ichimoku Cloud, suggesting a bullish long-term trend.
Strong support around $79,000 provided by Ichimoku Cloud.
Micro Dots with VMA Line:
Micro Dots: Currently neutral (no clear bullish or bearish dots), indicating market indecision.
VMA Line: Price is near the VMA line, acting as dynamic support. A bullish crossover above this line would strengthen bullish sentiment.
Wyckoff Phase Oscillator:
Oscillator Reading: 33.21, just above the Accumulation Zone (29.33 - 29.29), suggesting a potential shift from Accumulation to Markup.
Signal Line: Approaching a bullish crossover, indicating potential bullish momentum.
OBV (Volume Confirmation): Stabilizing, indicating accumulation and potential bullish momentum.
Volume Analysis:
Recent volume spikes suggest increased market interest, supporting potential bullish continuation.
Trade Idea & Targets:
Scenario: Cautiously bullish continuation.
Entry: Wait for a green bullish dot to confirm bullish momentum and crossover above VMA line.
Stop-Loss: Below Ichimoku Cloud support (~$79,000).
Take-Profit Targets: Primary target at recent highs ($101,821.96), secondary target at supply zone ($106,088.86).
Actionable Steps & Confirmations:
Micro Dots: Wait for a green bullish dot to confirm bullish momentum.
VMA Line: Look for bullish crossover above the VMA line.
Wyckoff Oscillator: Confirm bullish crossover above the signal line, clearly entering Markup phase.
Volume: Monitor for sustained or increasing volume.
Risks & Considerations:
Currently mixed signals (neutral Micro Dots, oscillator near accumulation) suggest caution. Maintain conservative position sizing until clearer bullish confirmations appear.
Strategy Type:
Momentum (trend-following) strategy is most appropriate, aiming to capitalize on potential bullish continuation.
Good luck and trade safely!

BTCUSD – Long Trade Update!🟢
Breakout from falling wedge with strong momentum.
Clean retest held, confirming bullish continuation.
Watching next resistance zone for potential reaction.
Structure remains intact unless support breaks below.

Inverted Head & Shoulders Pattern for BTC??!!!??!Bitcoin appears to be trading in an inverted h&s pattern.
Which coincides with a bullish breach of a Bullish Expanding Triangle highlighted in red to the upside!!
A double bottom is where the head of the inverted triangle can be formed, the space between the two bottoms forms the apex of the head of triangle.
First upside target of $90k USD
Second upside target is $260k USD

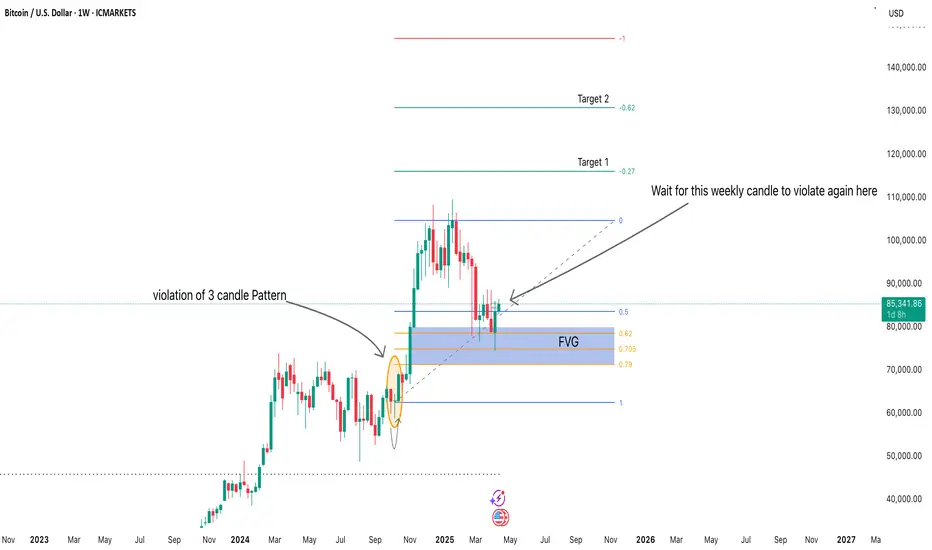
Bitcoin Weekly Outlook (April 2025)Price has respected the Fair Value Gap (FVG) and is showing signs of potential bullish continuation.
Waiting for a weekly candle body close above the highlighted structure to confirm continuation.
Targets set at key Fibonacci extension levels.
Patience is key — confirmation before entry to minimize risk.
"Let the market show its hand. No confirmation, no trade." 🚀
Boot2//@version=5
strategy("Auto Trader Bot by ZSoft ", overlay=true, default_qty_type=strategy.percent_of_equity, default_qty_value=100)
// تنظیمات کاربر
vwmaLength = input.int(31, title="VWMA Length")
vwmaOffsetRatio = input.float(0.989, title="VWMA Offset Ratio")
emaBaseLength = input.int(19, title="EMA Base Length")
emaOffsetRatio = input.float(0.912, title="EMA Offset Ratio")
rsiThreshold = input.int(52, title="RSI Threshold")
ema15mLength = input.int(30, title="15m EMA Length")
tradeStartHour = input.int(9, title="Trade Start Hour")
tradeEndHour = input.int(19, title="Trade End Hour")
// اندیکاتورها
vwma = ta.vwma(close, vwmaLength)
vwmaLine = vwma * vwmaOffsetRatio
emaLen = math.round(emaBaseLength * emaOffsetRatio)
emaLine = ta.ema(close, emaLen)
rsiVal = ta.rsi(close, 25)
ema15m = request.security(syminfo.tickerid, "15", ta.ema(close, ema15mLength))
// امتیاز سیگنال
score = 0
score += close < vwmaLine ? 1 : 0
score += close < emaLine ? 1 : 0
score += close < ema15m ? 1 : 0
score += rsiVal < rsiThreshold ? 1 : 0
score += rsiVal < 30 ? 1 : 0
// تحلیل زمانی
inTime = (hour >= tradeStartHour and hour <= tradeEndHour)
// آنالیز سود/ضرر روزانه
var float dayProfit = na
var int today = na
if na(today) or dayofyear != today
today := dayofyear
dayProfit := 0.0
// فقط وقتی روز جدید شروع بشه، سود روزانه آپدیت بشه
if strategy.closedtrades > 0
lastTradeDay = dayofyear(time )
if lastTradeDay == today
dayProfit += strategy.closedtrades.profit(strategy.closedtrades - 1)
// شروع ترید فقط وقتی:
allowTrade = (dayProfit >= 0) and inTime
longCond = score >= 4 and allowTrade
shortCond = score <= 1 and allowTrade
if longCond
strategy.entry("LONG", strategy.long)
if shortCond
strategy.entry("SHORT", strategy.short)
// نمایش سود روز و امتیاز
plot(score, title="Signal Score", style=plot.style_columns, color=color.new(color.lime, 0))
plot(dayProfit, title="Daily Profit", color=color.new(color.yellow, 0), linewidth=2)
// نمایش روی چارت
label.new(bar_index, high,
text="Profit Today: $" + str.tostring(dayProfit, "#.##") + " Score: " + str.tostring(score),
style=label.style_label_down, textcolor=color.white, color=color.gray, size=size.small)
