Bitcoin 200K & Gold 6K-7KI do believe we will see bitcoin at $200,000 within the next two years and Gold at $6,000-7,000/31.1 Grams within the next two to five years.
BULLUSD trade ideas
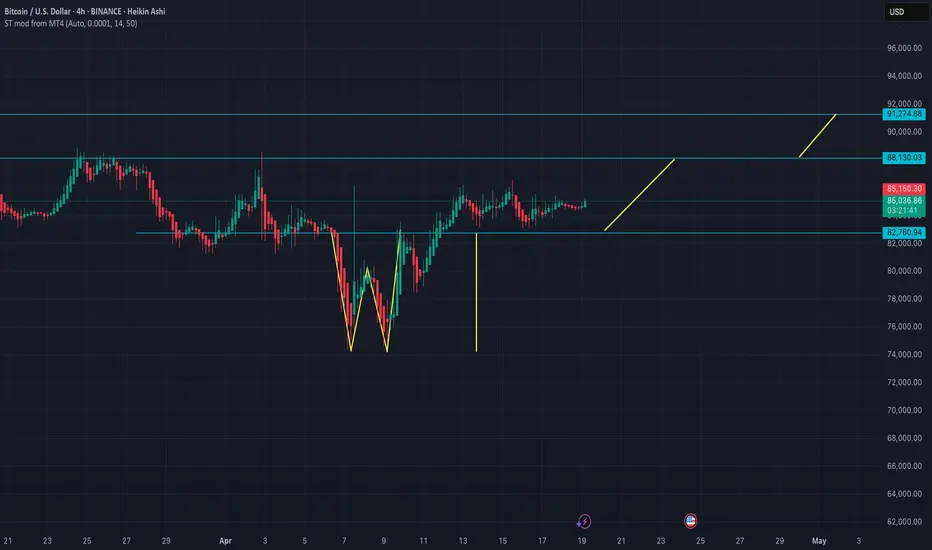
levels to watch The market has formed a W pattern and is currently trading above the neckline. The measured move from this pattern points to a target of 91,300.
What’s particularly interesting is that 91,300 also coincides with the neckline of a previous top, which could act as a significant resistance level — likely sparking a strong battle between buyers and sellers at that point.
If the market manages to reclaim and hold above 91,300, we could see a continuation toward the 108,000 and 125,000 levels.
I’m currently long on BTC from 78,000. My plan is to take partial profits around 88,130 and close the remainder at 91,300. From there, I’ll reassess based on the market’s reaction and look for the next directional cue.
BTC to the upsideeAccumulation on the daily trendline..impulsive move anytime soon. Watch out for bear trap before taking off.

Btc 1h sell to 84k and lowerRejecting higher opens, retested highest high of day, going back to 84k support

Bitcoin in correction phaseWave 4 price is currently shoeing, with a target range of 72000-73000. Looking for a buy opportunity at 73000. Uptrend confirmation requires a close above 92000.Keeping a close eye on that 73000 level then. Gotta be quick on the trigger if it dips down there. Don't want to miss the boat if it bounces. Setting an alert for 73000 just to be sure. Still cautious though, that 92000 close is the real confirmation we're looking for. Until then, it's a calculated risk. Might even consider a tight stop-loss just below 72000 to manage potential downside if this wave 4 ain't finished correcting. Patience is key here, don't want to jump the gun. Waiting for that setup.

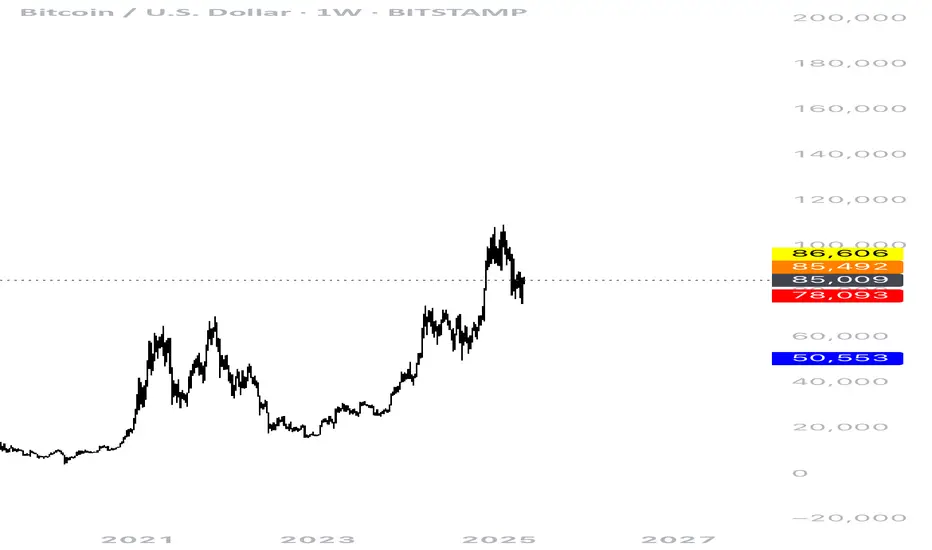
BTC/USD weekly ChartBitcoin has demonstrated a consistent upward trajectory since January 2023, achieving an impressive 565.42% increase over 749 days Clearly showing a bullish trend in a long-term perspective.
On the weekly chart, price has triggered the fair value gap priced at 73k-78k which is also a fair price on the demand and supply curve, presenting favorable conditions for traders.
Although Bitcoin's all-time high from January 2025 remains untested, recent price corrections—driven by macroeconomic factors such as U.S. tariffs and inflation in this recent months may seem a bit shaky for the market, but if you zoom out and look at it at a long term perspective It just looks like a healthy price correction of the market.

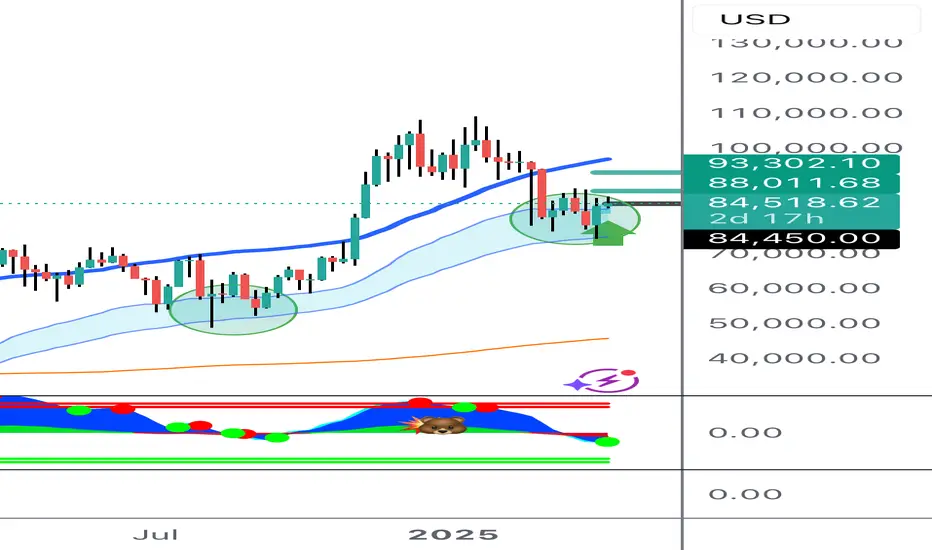
Bitcoin buy 84450 from weekly support Bitcoin declined to test weekly support SCD band.
This is second test in current run. First test was around 55000.
This second test. Usually first and second tests of blue support SCD band provide a good buying opportunities. And everything after third test is not reliable . At the same time on 4hr chart bitcoin breaking above the block of resistance moving averages and now sitting on top .
Buy 83500-84500 for continuation of the upmove to test top Bolinger on 4 hr chart first around 88000 and then test of top Bolinger in weekly around 93300.
BTC Covid Crash 2.0 Tariff Stylethe gold silver ratio spiking is a historical indication we're about to have a sell off. And it looks remarkably similar to the set up to march 2020 covid crash. Get your cash ready friends.
Trade Responsibly

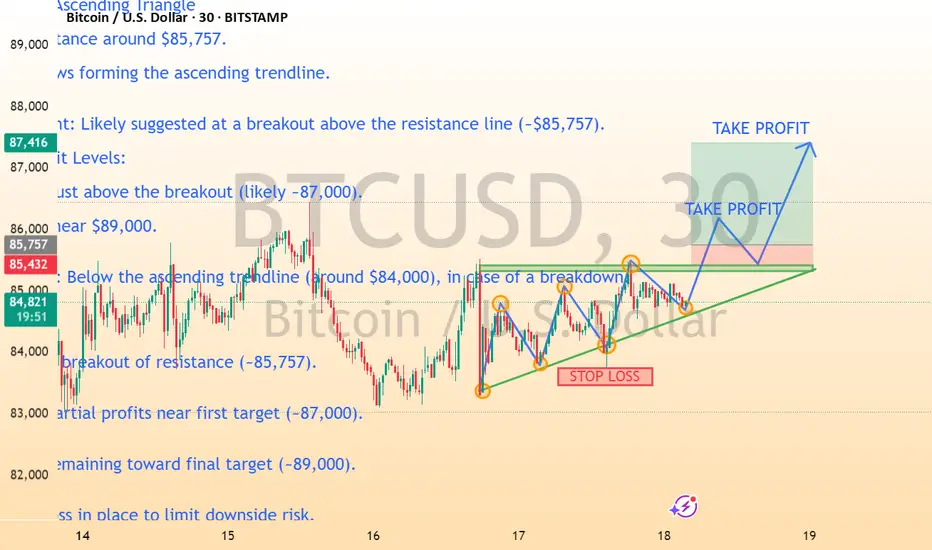
BTCUSD 30M CHART PATTERNThis chart for BTC/USD (30-minute timeframe) is showing a classic ascending triangle pattern, which is typically a bullish formation.
Breakdown:
Pattern: Ascending Triangle
Flat resistance around $85,757.
Higher lows forming the ascending trendline.
Entry Point: Likely suggested at a breakout above the resistance line (~$85,757).
Take Profit Levels:
First TP just above the breakout (likely ~87,000).
Final TP near $89,000.
Stop Loss: Below the ascending trendline (around $84,000), in case of a breakdown.
Strategy:
1. Buy on breakout of resistance (~85,757).
2. Take partial profits near first target (~87,000).
3. Hold remaining toward final target (~89,000).
4. Stop loss in place to limit downside risk.
Would you like a technical explanation of why this pattern is considered bullish or how to trade it more conservatively?

$BTC forming a range, getting tight w lower than average volumeCRYPTOCAP:BTC forming a range and getting tight with lower than average volume, under a rising 150/200 MA (could be resistance). Shorter term MAs looking to cross 10/20. Will keep my eyes on NASDAQ:IBIT and CBOE:BITX if this range breaks in either direction

BTCUSD INTRADAY Oversold bounce back capped at 88,000Recent price action in Bitcoin (BTCUSD) suggests an oversold bounce, with resistance capping gains at the 88,000 level. The continuation of selling pressure could extend the downside move, with key support levels at 80,850, followed by 77,500 and 74,420.
Alternatively, a confirmed breakout above 88,000, accompanied by a daily close higher, would invalidate the bearish outlook. In this scenario, Bitcoin could target 90,540, with further resistance at 91,890.
Conclusion:
The price remains below pivotal level, with 88,000 acting as a key resistance. Failure to break above this level could reinforce downside risks, while a breakout could shift momentum back in favour of bulls. Traders should watch for confirmation signals before positioning for the next move.
This communication is for informational purposes only and should not be viewed as any form of recommendation as to a particular course of action or as investment advice. It is not intended as an offer or solicitation for the purchase or sale of any financial instrument or as an official confirmation of any transaction. Opinions, estimates and assumptions expressed herein are made as of the date of this communication and are subject to change without notice. This communication has been prepared based upon information, including market prices, data and other information, believed to be reliable; however, Trade Nation does not warrant its completeness or accuracy. All market prices and market data contained in or attached to this communication are indicative and subject to change without notice.

$BTC Update - Sideways Movement AheadCRYPTOCAP:BTC #BTC at $84,221 support and testing, Next key resistances at $88,674 and $91,357, $81,614 current key support area, Ranging between $86,305-$82,833. Low volume on 4H, put bullish engulfing on previous 4H close but no follow up on current 4H, Last weekly close looks good with a bullish engulfing, but current weekly not looking promising for a follow thru yet. Previous daily closed bearish, RSI remains neutral on 4H, 1D and 1W. Expecting more sideways movement until $91,357 resistance is taken as support.

Bitcoin: Are We Facing a Financial Paradigm Shift?Ion Jauregui – Analyst at ActivTrades
Bitcoin is undergoing a crucial moment in its evolution. Fifteen years after its creation, this cryptocurrency has transformed from a simple digital alternative to traditional money into a consolidated unit of measurement, payment method, and potential store of value. And perhaps most importantly, it could be entering a new structural phase amidst a global transformation of the monetary system.
A Response to the Fiat System
Originally conceived as a reaction to the excessive money printing by central banks and the loss of purchasing power of fiat currencies, Bitcoin has become an increasingly utilized tool. Not only in everyday transactions —BTC ATMs can now be found in many cities worldwide— but also as a real alternative to traditional assets.
Stability and Market Maturity
Over the last year, Bitcoin's price has shown a much more stable evolution than in previous cycles, leaving behind extreme levels of volatility. Zones that previously acted as ceilings now serve as supports, suggesting maturation of the asset and greater institutional and retail acceptance.
Bitcoin vs. the Rest of the Crypto Ecosystem
While other cryptocurrencies like Ethereum continue to reflect significant fluctuations, Bitcoin stands out as the most robust asset in the crypto ecosystem. This position is further reinforced in a context of global monetary expansion, where the money supply has grown again after a brief contraction, surpassing even the peaks seen in 2024.
Bitcoin as a Safe Haven Amid Fiscal and Monetary Imbalances
This environment strengthens the narrative of Bitcoin as a hedge against inflation and currency depreciation. With governments increasing debt, deficits, and public spending, and central banks maintaining accommodative monetary policies, traditional limits seem to blur. Especially in emerging economies, where the deterioration of purchasing power is more pronounced, Bitcoin is solidifying its position as an alternative safe haven.
Technical Analysis
Currently, Bitcoin's price in recent weeks has shown a strong correlation with the fluctuations driven by Trump’s tariffs. After hitting lows on Monday the 7th and Wednesday the 9th, the precious token has appreciated back to the mid-range it has been pivoting in since February. The lower end of a long-term range fluctuating between $93,490 and $81,378. The RSI indicator currently shows no significant movements, confirming the point of control (POC) around the current price of $84,745. The moving averages from the Asian and European markets suggest that the price does not seem likely to move far from the POC for the moment. Observing Fibonacci retracements, we can see the price is currently fluctuating between 61.80% and 78.60%. This is generally a zone where a correction could occur towards the 50% level, which aligns with the lower range at $81,378. Delta zones indicate strong bearish pressure in this area, so the price might revisit this level before reinforcing the price tested more than four times.
Why Has Bitcoin Recently Fallen, Along with the Rest of the Market?
Despite this structural evolution, Bitcoin has experienced a correction in recent days, in line with the general drop in risk assets. Some of the main factors explaining this pullback include:
• Strengthening of the U.S. Dollar: The rise of the DXY index has pressured several dollar-denominated assets, including Bitcoin.
• Increase in Bond Yields: The rise in the 10-year Treasury bond yields has encouraged capital rotation towards safer instruments, at the expense of more volatile assets.
• Geopolitical Tensions: The growing uncertainty in the Middle East has generated risk aversion, favoring gold while penalizing the crypto market.
• Profit-Taking After the Halving: After the strong appreciation following April’s halving, many investors opted to lock in profits, creating additional bearish pressure.
• Liquidations in the Derivatives Market: High leveraged exposure triggered a cascade of automatic liquidations when key technical levels were broken.
A Temporary Adjustment or a Structural Opportunity?
Ultimately, although Bitcoin has suffered a recent correction, its long-term fundamentals appear to remain strong. The cryptocurrency has not only passed multiple tests throughout its history but now projects itself as a systemic asset in the new financial order. Just as gold did in earlier times, Bitcoin may be positioning itself as the mirror of the monetary excesses in the current system.
*******************************************************************************************
The information provided does not constitute investment research. The material has not been prepared in accordance with the legal requirements designed to promote the independence of investment research and such should be considered a marketing communication.
All information has been prepared by ActivTrades ("AT"). The information does not contain a record of AT's prices, or an offer of or solicitation for a transaction in any financial instrument. No representation or warranty is given as to the accuracy or completeness of this information.
Any material provided does not have regard to the specific investment objective and financial situation of any person who may receive it. Past performance is not reliable indicator of future performance. AT provides an execution-only service. Consequently, any person acting on the information provided does so at their own risk.

GLD/SPX as a risk-off signal for BTC/SPXFor all the "Bitcoin will follow gold" crowd...
This chart tells a very different story.
Every time we’ve seen GLD/SPX rally sharply, BTC/SPX has underperformed for months afterward.
📉 See the shaded red zones – they highlight periods when:
GLD/SPX (gold line) made strong relative moves,
BTC/SPX (aqua line) lagged or outright dropped.
We're in another one of those zones right now.
Unless you’ve got a strong reason why "this time is different," the base case is clear:
BTC/SPX likely underperforms for another 3–6 months.
If you're positioning long BTC expecting it to mimic gold's run, be aware — that hasn't played out well historically.
🧭 Trade Idea:
Patience: Don't rush the BTC long. Let the GLD/SPX spike play out.
Timeframe: Revisit BTC/SPX for potential re-entry mid-to-late 2025.

Bitcoins path to sub 10KTake a look at the fractal from 21. The parabola and all the EMA's line up almost perfect...
BE CAUTIOUS HERE!!!

BITCOIN TO 20.000Possible Bitcoin Drop to $20,000: What’s Behind the Bearish Outlook?
Bitcoin is facing increased selling pressure amid broader market uncertainty, raising the possibility of a drop to the critical $20,000 support level. Several factors are contributing to this bearish scenario, including tighter monetary policies, reduced investor confidence, and declining trading volumes. Technical indicators also show signs of weakness, with key support levels being tested and a lack of bullish momentum. If market sentiment continues to deteriorate, a correction toward $20,000 could become a reality. Traders and investors are closely watching for signs of stabilization or further downside movement.

The BTC market is clearly in a sideways trendCurrently, the BTC market is clearly in a sideways trend 😶. The price is fluctuating between 83,000 and 86,000, presenting trading opportunities 🤝. Investors can try buying on dips and shorting at highs. The analysis is as follows: 👉
Market data shows that the BTC price has been supported around 83,000 several times recently 😏. When it reached this level last week, the trading volume surged, indicating a large amount of buying. The KDJ indicator shows an oversold condition at this point, suggesting a possible short-term rebound 🚀. However, the price encounters strong resistance at 86,000. Multiple attempts to break through have failed, and the selling pressure increases as the price approaches this level 😣. According to the Bollinger Bands indicator, 86,000 is close to the upper band, which is likely to trigger a pullback ⬇️.
Within this range, buying on dips is reasonable 👍. If the price drops to around 83,000, investors can buy moderately. In the long run, BTC is still in an uptrend. The short-term sideways movement may be an adjustment. Historically, new upward trends often follow similar sideways trends 💹. The support at 83,000 is strong. Even if it is briefly broken, the possibility of a sharp decline is small. When buying, set the stop-loss at 82,000, and there is a chance to make a profit when the price rebounds 💰.
Shorting at highs is also feasible 👌. When the price approaches 86,000, investors can establish short positions. The resistance here is significant, making it difficult for the price to rise. A pullback will enable short sellers to make a profit 😃. However, shorting is risky, as BTC may break through the resistance. Set the stop-loss at 87,000 when shorting, and close the position immediately if the resistance is broken 🙅♀️.
💰💰💰 BTCUSD💰💰💰
🎯 Sell@86000 - 85500
🎯 TP 84000 - 83000
Traders, if you're fond of this perspective or have your own insights regarding it, feel free to share in the comments. I'm really looking forward to reading your thoughts! 🤗
👇The accuracy rate of our daily signals has remained above 98% within a month! 📈 We sincerely welcome you to join our channel and share in the success with us! 🌟

1. Insider Sentiment Detector Prompt: "You’re a hedge fund analyYou’re a hedge fund analyst. Analyze current macroeconomic trends and sentiment shifts using Reddit, X, and Google Trends. Return 3 undervalued assets likely to reverse soon. Format: Asset - Reason - Sentiment Source.

BTCUSD 4h FORECAST ANALYSIS Hello Guys hope you're all well
Guys, let me tell you that our analysis from 84K onwards will remain our target until our next bearish 88K Final Target
So we can hope it will go continue bullish candle on 88k

Bitcoin’s Bullish Path: Eyeing the Order Block ZoneIn my personal technical analysis, Bitcoin appears poised to revisit the order block zone between $73,000 and $69,000. If price reacts strongly from this area, following the blue trendlines I've drawn, it could resume its upward trajectory toward the top of the channel. This bullish momentum has the potential to play out through the end of 2025.
Best Regards

BITCOIN Supply Demand Short ALERT1) See picture for full analysis...
Higher Timframe:
-Price inside supply
-Trend = downtrend
-Stochastic RSI overbought
Lower Timeframe:
-Need break to break support + break upward trend-line + quality supply created.
- IF price does the following then possible pullback for short OR look for scalp/day-trade shorts
to the downside with 1TF setups.
#supplyanddemand #supportandresistance

BTC 12Y trend line that indicates next bear market bottom.Back in december i was posting this idea, indicating bitcoin TOP
There is 12y RSI trend line on 2W time frame. After each RSI touch of this yellow line approx. in 400-680 days new bear market bottom formed.
Next bottom should be around Q1 2026 jan-feb-march.
