BTC 12Y trend line that indicates next bear market bottom.Back in december i was posting this idea, indicating bitcoin TOP
There is 12y RSI trend line on 2W time frame. After each RSI touch of this yellow line approx. in 400-680 days new bear market bottom formed.
Next bottom should be around Q1 2026 jan-feb-march.
BULLUSD trade ideas

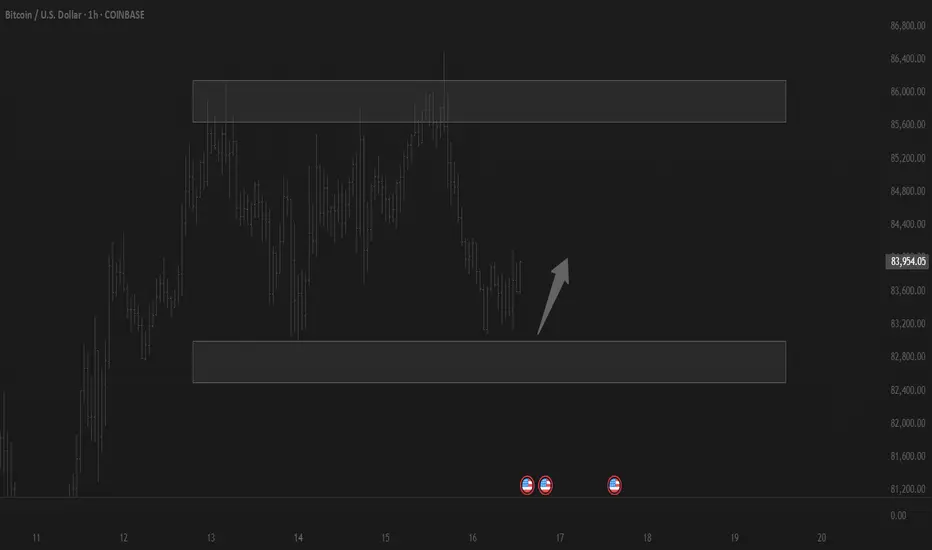
Trading balanceTrading balance The price of the asset has rebounded from the balance zone. With the prospect of growth into the resistance zone.
Bitcoin Facing Rejection Around the $86K Marker.
Based on Daily TF chart key level to watch is $84.5K.
The Case of bulls and bears:
If bulls fail to reclaim and hold above this 84.5K level, we could see a potential drop toward the FWB:67K – GETTEX:59K zone. Re-capturing 84.5k level pump target 88k to 99k level.
What’s especially worth watching now is the MACD:
Will it cross above the zero line, hinting at renewed bullish momentum,
or will it roll below and confirm a stronger downtrend continuation?
No predictions here — just sticking to the trend and watching price action unfold.

Breakout or BreakDown? MarkDown End Here's What's next!#Bitcoin moving towards its current downtrend structure forming a falling wedge with a potential of 50% recovery from the down fall. KRAKEN:BTCUSD
We can notice below 75K as a spring of the cycle and market declinations, however my insight is only for partial recovery due to ease of economic tensions between the tariff rates and bear market cycles - a cooling moment offers buying sentiment!
At the moment I consider the market accumulating for potential rally moves increasing #demand from over sold of the market.
Keep an eye on the 92K where I believe reactions of most sentiment will comes over this price.
Probability high, but always protect your margin from sudden changes.
This is idea and not financial advice
Join our society of FXDC


GOLD vs BITCOINThis is a divergence that is playing out right now. It begs the question, is Bitcoin really digital Gold in a Capital Rotation event?

btcIf the green lines are broken, we can easily enter the green box. To reach higher points, it is important not to break these two points.

My observations, long term. The purpose of this analysis is less of a predictive nature but rather more of a record of common sense thought and observations.
I don't think anyone really knows beyond a shadow of a doubt what Bitcoin will do next. The best we can do is look back at it's history and try to make sense of it in order to gain common sense ideas about what we can expect. My main mode of operation is trend lines, sometimes dozens of them. And I have here on the weekly chart a long term resistance (July 2016) and support (Jan 2020) marked in blue. And some time ago I drew the red and yellow short term support lines and extended them just to see what would happen.
As you can see in the chart, Bitcoin has broken the yellow line and attempted to cross back above it, and I'm not ruling that option out just yet, however when I look at this on a smaller time frame the price action looks like it's trying to flip the yellow into resistance. This scenario makes sense for a couple of quick reasons, the first being common sense in that the yellow line is extremely steep and one would have to wonder how long BTC can keep pace with it. The second reason is that the RSI is showing a head and shoulders pattern, as I've circled below the candlestick chart. However I think even the red short term trend line eventually will prove to be too steep of a climb to keep pace with as well, and it too will eventually be tested.
On the bullish outlook, BTC came down to retest the previous ATH at around 74K and bounced from it. In doing so, it completed the necessary distance for the double top and theoretically could continue its run up beyond 110K. It also touched the lower boundaries of Bollinger Bands (I'm limited to 2 instruments on the free acct. , so check for yourself) on several mid to long term time frames, increasing the possibility of a bullish continuation from there.
However, I lean more toward the bearish scenario for reasons I stated above. And because it's been a while since BTC touched its long term support (marked in blue) and history does repeat itself. I however do agree that the 40K area would be difficult to reach because of demand expected near the 68K, 53K and 49K zones.
This is not a trade suggestion or advice of any kind, however the best action at this point is to be patient and take a wait and see approach until price action makes a more definitive confirmation of either bullish or bearish trend to come.

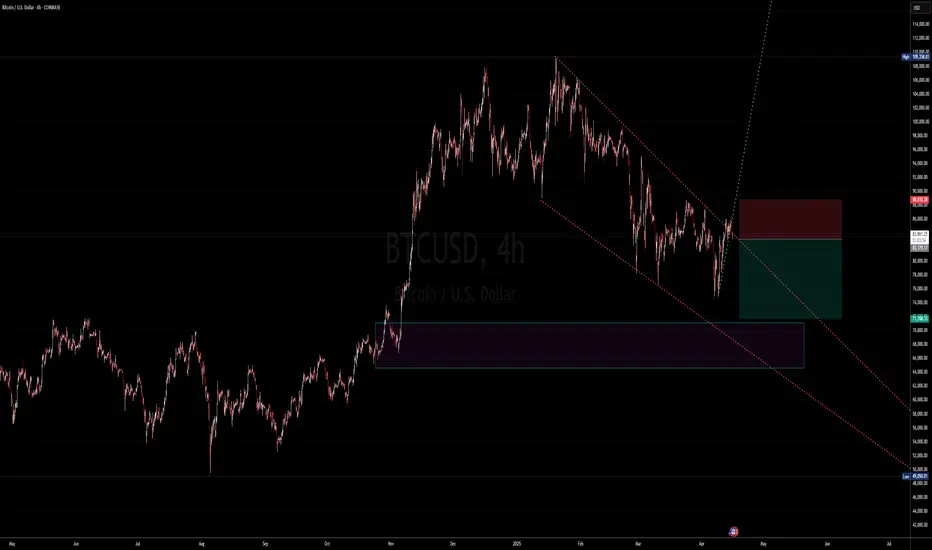
BTCUSD Chart - Potential Short OpportunityThe provided description outlines a technical analysis perspective on the BTCUSD (Bitcoin against the US Dollar) chart, suggesting a potential short selling opportunity based on the interaction with multiple long-term downward trendlines and a recent break of a short-term trendline.
The chart shows the BTCUSD touched multiple long-term downwards trendlines, also the short term trendline has broken for potential short opportunity. it may falls further 71-66K to support of previous highs, and to where the previous trend has begin.

BTCUSD INTRADAY Oversold bounce back capped at 88,000Recent price action in Bitcoin (BTCUSD) suggests an oversold bounce, with resistance capping gains at the 88,000 level. The continuation of selling pressure could extend the downside move, with key support levels at 80,850, followed by 77,500 and 74,420.
Alternatively, a confirmed breakout above 88,000, accompanied by a daily close higher, would invalidate the bearish outlook. In this scenario, Bitcoin could target 90,540, with further resistance at 91,890.
Conclusion:
The price remains below pivotal level, with 88,000 acting as a key resistance. Failure to break above this level could reinforce downside risks, while a breakout could shift momentum back in favour of bulls. Traders should watch for confirmation signals before positioning for the next move.
This communication is for informational purposes only and should not be viewed as any form of recommendation as to a particular course of action or as investment advice. It is not intended as an offer or solicitation for the purchase or sale of any financial instrument or as an official confirmation of any transaction. Opinions, estimates and assumptions expressed herein are made as of the date of this communication and are subject to change without notice. This communication has been prepared based upon information, including market prices, data and other information, believed to be reliable; however, Trade Nation does not warrant its completeness or accuracy. All market prices and market data contained in or attached to this communication are indicative and subject to change without notice.

Bitcoin, Gold, S&P 500 and InflationBitcoin, Gold, S&P 500 and Inflation
This is a 3 year view (2022 - 2025 to date), 1 week comparison chart of Bitcoin, Gold, S&P 500 and US cumulative rate of inflation. The most interesting part of this analysis to me is that the S&P 500 bounced off the cumulative rate of inflation slope. I did not know that until after I set up the comparison.
Gold = +80%
BTCUSD = +50%
S&P 500 = +19%
US cumulative rate of inflation:
2022 = +6.5%
2023 = +3.4%
2024 = +2.9%
3 yr = +10.8%
2025 = +2.4% forecast

BTC/USD Rejected at Supply Zone –Major Levels to Watch This WeekBitcoin is currently trading around $85,773, showing strength but facing stiff resistance near the $87,100 supply zone. Let's break down what the chart is telling us and why this week could be critical for price direction.
Key Levels:
Supply Zone: $86,800 - $87,500 → Price has been rejected here multiple times. This is the sell wall.
Immediate Support: $82,882 → A break below could trigger a sharper move down.
Major Demand Zone: $75,800 - $76,800 → Strong buyer interest in this region, marked by volume and past rejections.
Other Key Levels:
$83,547 – Mid-range support/resistance
$78,552 – Potential bounce zone if breakdown occurs
Price Action Insights:
BTC is consolidating just below a major resistance.
Volume is drying up near the top, suggesting either a breakout trap or an impending move down.
Arrows indicate potential liquidity zones where smart money could sweep price before reversal.
Scenarios:
1. Bullish Breakout: Clean candle close above $87,100 with retest → Target $89,000 - $90,000
2. Bearish Rejection: Strong rejection from supply zone → Watch $82,882 and $78,552 for reaction
3. Liquidity Sweep Play: Price spikes above supply to trap longs, then dumps hard → common before major macro news
Fundamentals to Watch:
U.S. economic data releases (highlighted on the chart – April 15 & 17)
Any shift in Fed tone or inflation data could trigger volatility.
Will BTC break above or fall back into the range?
Comment your bias below!
Like & follow for real-time updates and setups!

BTCUSD (4H): Short Position OpportunityHello Traders.
You may find more details in the chart!
Good Luck!
Please support with a like or comment if you find this analysis useful.❤️

Bitcoin Bulls Pave Path to $100,000FenzoFx—Bitcoin is trading bullishly, staying above the 50-period SMA and the 81,160 support. Currently, it hovers around $85,650, testing resistance.
As long as prices hold above 81,160, the next target could be $88,650. However, if bears push below $82,811, consolidation may occur, with support at 81,160.
Trade BTC/USD swap-free, effortlessly. >>> FenzoFx Decentralized Forex Broker

Secure ptofits of LONG📊 BTC Daily Chart – In-Depth Analysis (as of Apr 15, 2025)
🔍 Overview
You're holding a long position from below $80K, still active but now at a +5-6% gain, while TP is placed around 88.3K, close to a key resistance and trendline confluence. Let's break this all down and answer your core question: Is it wise to secure profits now even if TP hasn't been reached?
⚒️ BitcoinMF PRO & Fisher Confirmation
The BitcoinMF PRO indicator has been delivering precise entries/exits—highlighted with green "Long" and red "Short" tags.
Your current active long was marked by BitcoinMF PRO near the lower end of the descending channel with Fisher Transform at a local bottom, signaling an extremely oversold bounce zone.
The Fisher is curling up from a "super low" region, meaning it is entering mid-zone. This reduces risk-reward from here for new longs—good reason to lock partial profits.
📉 Technical Chart Structure Breakdown
🔺 Linear Regression Channels:
BTC is now trading near the top of the smaller descending red channel, nearing rejection territory.
Also, it’s approaching the bottom half of the broader dark blue ascending channel = resistance cluster zone.
🔁 Elliott Wave Structure (Possibly Ending Wave 4)
This looks like a potential 3 → 4 → 5 wave structure unfolding.
Wave 3 likely bottomed near $71K- FWB:73K , and this long is likely part of Wave 4 retracement. If correct, Wave 5 may resume down again unless invalidated above $88.3K.
🔸 Fibonacci Watch:
0.5 Fib retracement from recent swing high to low is around $84.2K-$85.5K—you’re sitting on it right now.
0.618 Fib confluence is ~$88.5K, right where TP is set. That zone is statistically known for rejections. This is another reason to secure a chunk of profit now.
📉 Volume & Sentiment
Volume is weak on this rally, indicating a lack of conviction.
Fear & Greed Index (live: ⚠️ around 72 – greed zone) is starting to lean hot.
Market sentiment is optimistic, and price is hovering just below known short zones.
🏦 Whale Activity, Exchange Inflows & CME Gap
Whale wallets have shown mild accumulation at lower levels (~ FWB:73K -$75K), but no aggressive buying up here.
Exchange inflows are increasing slightly – suggesting some may be getting ready to sell into this strength.
✅ CME Gap around $66K is still unfilled. Historically 90% of gaps fill. Keep that in your long-term radar.
🔄 Long vs Shorts Ratio (Bybit + Binance)
On both Bybit and Binance, Longs > Shorts by ~58/42 – minor imbalance. Suggests majority is positioned long, slightly raising correction risk.
✅ Final Strategic Take
❗ Why You Should Secure Profits Now:
Price is at a resistance confluence zone (Fib + LR + sentiment).
The move has already run +5-6%, and even if price doesn’t touch TP at 88.3K, greed could erase that unrealized profit quickly.
If this is just Wave 4, the next move could be a final push down to $70K or lower (Wave 5).
Volume divergence + rising inflows = risk is increasing.
Locking at least 50-70% now is smart trader psychology. You can always re-enter.
🔮 Most Probable Next Move: 6.8 / 10 – Mild Up, Then Pullback
BTC has 69% probability of testing $86.5K–$88.5K, but rejection is very likely there.
After that, we could see a pullback to $80K–$82K.
Extreme bullish continuation (above $90K) currently has <20% probability unless macro/Fed/etc. change.
📌 Action Recommendation:
📈 Secure partial profits immediately.
🧠 Move stop-loss to breakeven or slightly in profit to protect the rest.
🛑 Avoid FOMO-ing into new longs now – let the chart confirm breakout first.
🧠 Ancient Wisdom:
In Pirkei Avot (Ethics of the Fathers), Rabbi Tarfon said:
“The day is short, the work is great… and the reward is much, but the Master is insistent.”
In trading terms: The market doesn’t owe you your TP. Secure reward when the work is done. Don’t overstay your welcome.
for more follow links in profile

Is BTC set to hit 90K before dropping?#BTC has been range-bound on the weekly , recently forming an SFP below the range low but failing to close below the Feb and Mar 10th lows. Could we see an SFP above the RH ($90K) before moving lower, potentially toward the FWB:65K -$72K target? That remains to be seen. The HTF MS remains bearish, and until it shifts, the risk to the downside is high. For a bullish shift on the weekly, we need weekly closes above $94000. Until then, downside risk persists.
On LTF/MTF: I update my analysis regularly, but for now, I’m considering a few scenarios:
👉a. BTC could bounce from an 18H HOB if the 2H HOB breaks, potentially aligning with USDT.D hitting a 23H HOB at 5.62%. This might form a DB at a 22H PHOB at 5.35%, or USDT.D could target a 12D demand or a 22H HOB at 5.15%.
👉b. BTC might bounce, breaking the current 21H OB, and reach the HTF supply at $90K, while USDT.D takes the 23H PHOB and possibly the 22H HOB before rising to 5.77%-6.01%.
Also note, the daily close below the $84600 SH shows weakness on the chart. There’s little to do until we either reach $72K or see an MS shift, which could open risky upside trades. These are risky because we haven’t taken the liquidity needed for higher prices. MT also mentioned that higher prices without key level breaks are likely a bull trap. Avoid heavy trades until direction is clear.
Until then, we focus on taking LTF scalp trades 🤝

Bitcoin: Waiting for a clear long setupOn the daily chart, Bitcoin is trying to break out of the downtrend, but for me, there’s still no reliable signal to go long. And without that, I won’t be gambling in this casino.
It's good to see some consolidation at current level.
Interestingly, the uptrend remains intact on both the weekly and monthly charts. That adds a solid extra argument in favor of a long position—if a strong setup forms on the daily chart.

BTCUSD update Hi traders you need to plan a trade n trade the plan,this is my plan n I post it 1 January now am in a recovery mode and still following the trend as I said this year I won't share many analytics but I do have specific platforms were I do share what am seeing n help those who see my post,soo we are gonna explode soon in btc its just a matter of time keep your head up n trust the process get rich or die trying never give up📈

BTCUSD Today's strategyYesterday, the price of Bitcoin increased, but the trading volume decreased, weakening the short-term upward momentum. However, in the long run, the market has sufficient liquidity. The active trading of a large number of investors supports price discovery, and it is likely to drive up the price when there are favorable factors.
It should be noted that the cryptocurrency market is highly volatile and uncertain. Although we are bullish on the price of Bitcoin today, unexpected factors may change its trend. When making investment decisions, investors should assess their risk tolerance and operate with caution.
BTCUSD
buy@83500-84500
tp:85500-86500
I hope this strategy will be helpful to you.
When you find yourself in a difficult situation and at a loss in trading, don't face it alone. Please get in touch with me. I'm always ready to fight side by side with you, avoid risks, and embark on a new journey towards stable profits.

BITCOIN FALLING RESISTANCE|SHORT|
✅BITCOIN is trading in a downtrend
Along the falling resistance line
Which makes me bearish biased
And the coin is about to retest the resistance
Thus, a pullback and a move down are expected
With the target of retesting the level below at 83,213$
SHORT🔥
✅Like and subscribe to never miss a new idea!✅
Disclosure: I am part of Trade Nation's Influencer program and receive a monthly fee for using their TradingView charts in my analysis.


Bitcoin bulls still face medium term diagonal resistance BITSTAMP:BTCUSD has recovered in recent days but still faces a hurdle to the upside as it is pushing up against a descending resistance line, with additional resistance at the $89,000 level.
Using the ForexGPT web app, we can see the following AI-generated analysis using the 4-hour time from on BTC/USD as of April 14th, 2025:
AI-generated analysis for BTC/USD, 4-hour bid prices from January 28, 2025, at UTC 02:52:38
Welcome to ForexGPT! Let's dive into the latest data for BTC/USD on a 4-hour timeframe.
As of the last candle on April 14, 2025:
Price: 84809.2
Open: 84280.4
High: 85038.6
Low: 84157.1
Close: 84809.2
7-period SMA: 84553.9143
14-period SMA: 82656.45
50-period SMA: 81183.452
100-period SMA: 83373.351
Bollinger Bands: Upper: 86400.4939, Middle: 82292.64, Lower: 78184.7861
Donchian Channel: Upper: 85786.4, Middle: 81203.2, Lower: 76620
Sentiment Score: 70.6311
Given the current sentiment score of 70.6311, the market sentiment appears to be quite positive. The price is trading above the 7-period SMA, indicating a short-term bullish trend. The 14-period and 50-period SMAs are also trending upwards, supporting the bullish sentiment. The Bollinger Bands suggest that the price is near the upper band, which could indicate overbought conditions, but also strong upward momentum.
ForexGPT AI-generated Trade Signal
Based on the analysis, I anticipate a long position with the following details:
Entry Price: Market order at 84809.2
Take-Profit Price: 85786.4 (Donchian Upper)
Stop-Loss Level: 83373.351 (100-period SMA)
Risk-Reward Ratio:
Potential Profit: 85786.4 - 84809.2 = 977.2 pips
Potential Loss: 84809.2 - 83373.351 = 1435.849 pips
Risk-Reward Ratio: 977.2 / 1435.849 ≈ 0.68
While the risk-reward ratio is below 1, the strong bullish indicators and positive sentiment may justify the trade. However, always consider your risk tolerance and position sizing carefully.
For further analysis, you might want to explore other timeframes such as 1-hour, daily, or weekly to get a broader perspective on the trend.
Above analysis provided by ForexGPT LLC subject to our terms, and is not investment advice.
