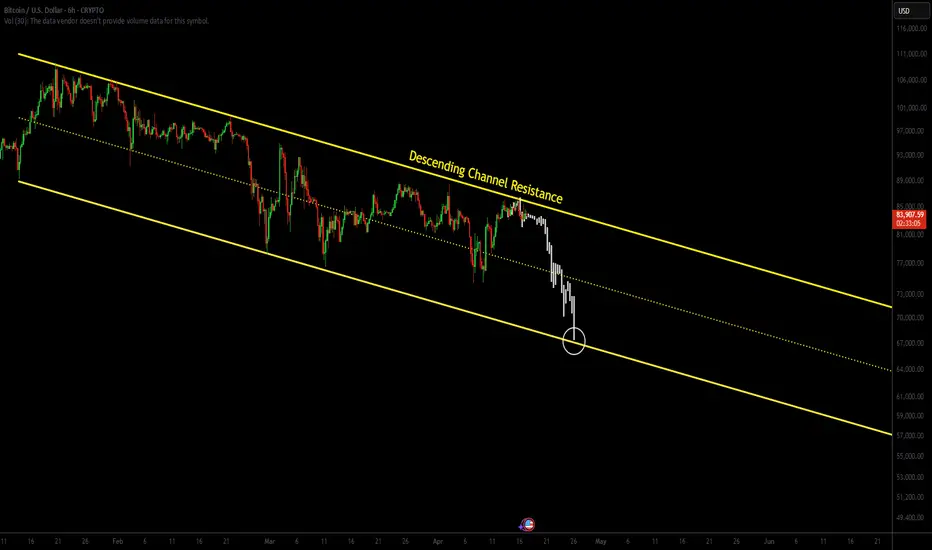
Bitcoin Pressing Against Descending Channel ResistanceIn today’s analysis, we examine Bitcoin’s price action as it continues to respect a descending channel pattern. With current price consolidating at the upper boundary of this channel, traders are now questioning whether BTC will break out or reject and rotate lower.
Key Points Covered in This Article:
- Bitcoin is currently consolidating at resistance of the descending channel
- A break of the recent swing low could lead to a drop to $67,400 support
- Confirmation of bullish breakout requires volume-backed move above channel resistance
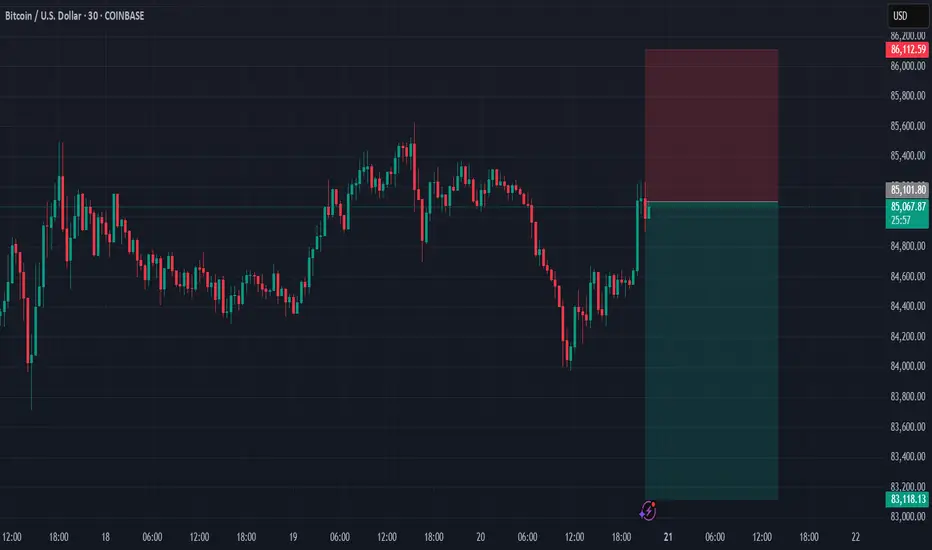
Bitcoin is currently pressing into the top boundary of a descending channel, where resistance is holding firm. On the lower time frame, price action has entered a period of consolidation — a key sign of indecision. However, from a structural point of view, resistance remains resistance until broken. A failure to break through the upper boundary could accelerate downside momentum.
Should the current swing low be breached, traders can expect a move toward the lower boundary of this descending channel, situated around $67,400. This level will act as the next significant support, and it may provide a potential entry for reversal plays, depending on how price behaves upon reaching it.
For bullish continuation to occur, Bitcoin must decisively break above the descending channel with strong volume confirmation. Without this signal, any moves to the upside may be short-lived and potentially lead to liquidity grabs before another rotation lower. Traders should stay patient and wait for either a clear breakout or confirmation of further downside before entering positions.
BULLUSD trade ideas
Falling wedge 4hr timeframeBullish on btc, no long talks, bullish break above the upper trend line is all you need to dive right in.
Share your thoughts??

bitcoin sell or shortliquidity down below
bullish shorterm exhaustion
use proper risk management
#forex
#bitcoin
#weekend
#crypto
#coins

Mastering Volatile Markets: Liquidity Makes or Breaks Trades█ Mastering Volatile Markets Part 2: Why Liquidity Makes or Breaks Your Trades
If you've read the first part of this four-part series, you know that reducing position size is a key strategy for surviving volatile markets. The second crucial factor that determines success or failure in wild markets is understanding liquidity.
In volatile markets, liquidity is often the real reason behind those massive price spikes — whether 300-500 point moves in the NAS100, violent whipsaws in crypto or stop hunts in forex.
█ Liquidity: The Silent Killer in Wild Markets
In normal market conditions, liquidity is everywhere. You can enter and exit trades with minimal slippage, and everything feels smooth. But in volatile conditions, liquidity can disappear quickly.
Here's why it happens:
Market makers pull back to avoid getting caught in wild moves.
Spreads widen , making execution harder.
Order books thin out , meaning there aren't enough buy or sell orders to absorb aggressive price movements.
Even small orders can cause significant price changes when liquidity is low.
This is what causes those huge candles you often see in volatile markets. It's not just about more buyers or sellers; it's about less liquidity available to absorb those trades.
There’s also a common misunderstanding at play here: High Volume = High Liquidity
Many newer traders see a big volume candle and think, "Oh, high volume means it's safe to trade." But that’s an inaccurate conclusion.
⚪ Volume refers to the number of transactions happening.
⚪ Liquidity refers to how much depth the market has to handle those transactions without causing price instability.
In volatile markets, high volume doesn't mean there's enough liquidity.
And low liquidity causes wild wicks, huge spreads, higher slippage and unstable price action.
█ How to Navigate Low Liquidity in Volatile Markets
So, how can you trade effectively in these conditions?
1) Expect Crazy Moves — Levels Will Get Violated
In high-volatility, low-liquidity markets:
Support and resistance levels won't hold as they usually do.
Price will blow through key levels like they were nothing.
Fakeouts become extremely common.
2) Don't Rely Solely on Support & Resistance
As a newer trader, it's vital not to blindly rely on S/R levels in these markets. Here's why:
Don't expect clean bounces or perfect reactions.
Fakeouts, wicks, and stop hunts are normal.
Tight stops right behind these levels? You'll get stopped out a lot.
Experienced traders know this, which is why we adapt the strategies to handle the market's unpredictability.
3) Split Your Orders Into Smaller Chunks
One of the most effective techniques in volatile markets is order splitting.
Break it into smaller chunks instead of entering your full position at one price. This would help you survive fakeouts, scale in better across larger price moves and avoid becoming liquidity for bigger players.
Example: Let's say you want to go long at support (15,000 on the NAS100), instead of entering all at 15,000. Instead Enter:
25% at 15,000
25% at 14,950
25% at 14,900
25% at 14,850
This way, if the market fakes out below support due to low liquidity, you get filled at better prices without panic.
4) Control Your Emotions — Understand the Environment
This is HUGE in volatile markets.
Many retail traders panic when prices move against them quickly. But if you understand the nature of low liquidity , you can remain calm:
It's normal for the price to move wildly.
Levels will get swept.
Fake moves are common before the market plays out the right way.
█ Summary
Let’s take stock of what we learned today about liquidity in highly volatile markets:
High volatility often equals low liquidity.
High volume does not equal high liquidity.
Expect fakeouts , wild price behavior, and wide spreads.
Don't rely blindly on support/resistance levels.
Split your orders into smaller chunks to manage risk.
Trade smaller position sizes and stay calm.
Remember, you must adapt not only your size but also your execution . Understand liquidity, or it will punish you.
█ What We Covered Already:
Part 1: Reduce Position Size
Part 2: Liquidity Makes or Breaks Trades
█ What's Coming Next in the Series:
Part 3: Patience Over FOMO
Part 4: Trend Is Your Best Friend
-----------------
Disclaimer
The content provided in my scripts, indicators, ideas, algorithms, and systems is for educational and informational purposes only. It does not constitute financial advice, investment recommendations, or a solicitation to buy or sell any financial instruments. I will not accept liability for any loss or damage, including without limitation any loss of profit, which may arise directly or indirectly from the use of or reliance on such information.
All investments involve risk, and the past performance of a security, industry, sector, market, financial product, trading strategy, backtest, or individual's trading does not guarantee future results or returns. Investors are fully responsible for any investment decisions they make. Such decisions should be based solely on an evaluation of their financial circumstances, investment objectives, risk tolerance, and liquidity needs.

Resistance in the downward channel of BitcoinIn today’s analysis, we examine Bitcoin’s price action as it continues to respect a descending channel pattern. With current price consolidating at the upper boundary of this channel, traders are now questioning whether BTC will break out or reject and rotate lower.
Key Points Covered in This Article:
- Bitcoin is currently consolidating at resistance of the descending channel
- A break of the recent swing low could lead to a drop to $67,400 support
- Confirmation of bullish breakout requires volume-backed move above channel resistance
Bitcoin is currently pressing into the top boundary of a descending channel, where resistance is holding firm. On the lower time frame, price action has entered a period of consolidation — a key sign of indecision. However, from a structural point of view, resistance remains resistance until broken. A failure to break through the upper boundary could accelerate downside momentum.
Should the current swing low be breached, traders can expect a move toward the lower boundary of this descending channel, situated around $67,400. This level will act as the next significant support, and it may provide a potential entry for reversal plays, depending on how price behaves upon reaching it.
For bullish continuation to occur, Bitcoin must decisively break above the descending channel with strong volume confirmation. Without this signal, any moves to the upside may be short-lived and potentially lead to liquidity grabs before another rotation lower. Traders should stay patient and wait for either a clear breakout or confirmation of further downside before entering positions.

Bitcoin Monitoring- This is not a trade setup.
--------------------------------------------
- Zones to keep close surveillance :
--------------------------------------------
- 25,200$
- 27,300$
--------------------------------------------
Happy Tr4Ding!

I think BTC is forming and inverse head and shouldersI believe that BTC is going to test the resistance once more with some buying pressure. Then reject it and create a higher low while also touching the support to breakout above the resistance level and create higher highs. Price is also testing the 50MA from below on the Daily chart and is quite stagnant but I believe that is just building explosive pressure to breakout upward or at least establish a new high to keep that slight uptrend in motion. On the weekly chart we are pretty bullish as well. Price seems to be trying to use the 50MA as support hopefully propel itself upward. My sentiment currently for BTC is BULLISH.🐂

BTC Diamond Ser ?- While bears see bearish pennants, I see diamonds in the rough.
- I remain bullish, not due to the price, but for the sake of humanity.
- This isn’t an analysis, just a light-hearted joke, so please don’t roast me too hard! 🙏.
- Remember, diamonds are forever.
- Hodl!
Happy Tr4Ding!

BITCOIN (BTC) Trading Plan.Bitcoin (BTC) Trading Plan:
Resistance Level: $88,000
Support/Channel Level: $85,000
Target Levels:
If price rejects $88,000 and breaks below $85,000,
Sell target: $78,000
If price holds above $85,000 and breaks out above $88,000,
Buy target: $93,000

BTC/USDT Trade Setup (30-Minute Time Frame) 16/04/202📅 Date: 16/04/2025
🕑 Time: 02:18 AM
💰 Current Price: 84,001 USDT
Trade Idea:
Pattern Identified: Double Top
Action: Sell at current price (84,001)
Target Price: 80,800
Stop Loss: 86,680
Risk/Reward Ratio: Approx. 1:1.2
Bias: Bearish — anticipating a rejection from resistance and a breakdown toward neckline support.
Double Top Pattern Summary:
The double top is a classic bearish reversal pattern that forms after an extended uptrend. It is characterized by two consecutive peaks at approximately the same level, separated by a moderate trough.
First Peak: The price rallies and then pulls back to a support level called the neckline.
Second Peak: The price climbs again but fails to break the first high, forming the second top.
Confirmation: A break below the neckline often signals a potential downside move.
Disclaimer: This trade idea is for informational purposes only and does not constitute financial advice. Cryptocurrency trading carries a high level of risk and may not be suitable for all investors. Please conduct your own research or consult a licensed financial advisor before making investment decisions.

BTC/USD - The Bitcoin Cycle TopBTC has recently broken below a key uptrend line that had been guiding price for some time. I’m watching for a potential backtest of that broken trendline, a rather classic move that could set the stage for a final upwards squeeze, possibly printing a quick higher high to trap late longs.
I’m watching the circled area closely as a potential exhaustion zone. Key levels and price action around the trendline will be critical, breaking of upwards trendlines after backtesting may mark the beginning of the larger unwind.
We could see multiple backtests of the broken trendline over time, with the trendline now likely acting as resistance.
Note: I’m publishing this idea simply to have a timestamped record. This post is my way of putting a clear marker in the sand. I’m not looking to debate or go deeper into the reasoning, and I generally won’t be responding to comments.


Bitcoin alert drop to 82kBitcoin’s dancing around $87,000, but the music’s about to stop.
We’ve got early Break of Structure (BoS) and clear Change of Character (ChoCH)—momentum’s fading fast.
Right now, I’m watching for a rejection off the upper range, which could trigger a sharp correction.
🔻 Target: $82,000
That’s a ~6% move.
Not massive—but definitely fast.
This isn’t the big drop…
Just a warm-up for something nastier.
You know how it goes—first they shake the weak hands. Then they bite.
Status: Setting up
Confidence: High
Timing: Soon.
You’ve been warned. The Wolf sees it before the pack does.
– Alpha Sigma Wolf
“Not all howls are warnings. Some are confirmations.”
#Bitcoin
#BTC
#BTCShort
#CryptoTrading
#TechnicalAnalysis
#SmartMoneyConcepts
#PriceAction
#BreakOfStructure
#AlphaSigmaWolf
#WolfOfCrypto
#TheWolfSees
#ChoCH

CHECK BTCUSD ANALYSIS SIGNAL UPDATE > GO AND READ THE CAPTAINBaddy dears friends 👋🏼
(BTCUSD) trading signals technical analysis satup👇🏼
I think now (BTCUSD) ready for(BUY)trade ( BTCUSD) BUY zone
( TRADE SATUP) 👇🏼
ENTRY POINT (86900) to (86800) 📊
FIRST TP (86470)📊
2ND TARGET (85940)📊
LAST TARGET (85500) 📊
STOP LOOS (87500)❌
Tachincal analysis satup
Fallow risk management

A landscape of bitcoinIn my opinion there is a logarithmic rhythm in chart as I drawn, I hope to happen :))

Supply and Demand by Thapelo Consolidation and Expansion
The markets either do one of two things: Price either consolidates or expands.
Consolidation: a period in the market where price is moving calm which moves in a range known as the dealing range. We will be able to identify a clear high and low to this range.
You have probably heard of the term range bound, ranging, or consolidating. This means that price is typically staying in one area, and just moving sideways, rather than up or down.
The range can be tight (meaning a spread of only a few pounds), or the range can be loose (meaning a spread of hundreds of thousands of pounds from range high to low. This partly will come down to the timeframe implemented.
Expansion: a period in the market where price is moving aggressively in one direction or the other. We will see an impulsive move to the upside, or an impulsive move to the downside, where price will give us large candle bodies or wicks. This is known as expansion.

BTCUSD Sell Signal @ 85100A bearish signal has been triggered for Bitcoin against the US Dollar at the 85,100 level. This indicates a potential trend reversal or correction from recent highs, suggesting sellers may be stepping in at this price point. Traders might consider this an opportunity to short BTCUSD or take profits on long positions. As always, proper risk management and confirmation from additional technical indicators (e.g., RSI, MACD, trendlines) are recommended before taking action.
LSTM AI Model Predicts BTC Move on the 4H Chart 🧠 LSTM AI Model Predicts BTC Move on the 4H Chart ⚡
I've built and trained an LSTM (Long Short-Term Memory) deep learning model specifically to analyze 4-hour BTC chart data — and it's showing some strong signals.
📚 What the model does:
The LSTM takes recent 4H candlestick data and learns from historical trends, volatility patterns, and short-term momentum. With ~96% accuracy on training data, it's shown solid potential in picking up turning points and projecting short-term moves.
🚀 Current Prediction:
The model suggests Bitcoin is on track to push toward $70K, continuing its current uptrend within the next 30 days if momentum holds.
This isn’t just a moving average crossover — this is deep learning trained to recognize complex crypto behavior.
⚠️ Disclaimer:
As always, no model is perfect. This is a forecast, not financial advice. Use it as a perspective, not a guarantee.
Let me know if you're seeing similar signs, or if you're using ML in your trading too! 🔍
#BTCUSD #Bitcoin #CryptoForecast #4HChart #LSTMModel #AITrading #BTCto70K #CryptoAnalysis

My short term humble forecastThe yellow line is my forecast with the estimation short term local highs and local lows, along with the reversal. The vertical lines are the estimation dates it will occurs.

BTC/USDSomething like this makes the most sense from manipulation perspective.
I'm sure much was learned from the 2020 crash.
Say you build a shelf for your garage, hindsight says could've used screws instead of nails here and should've clamped there, wood glue, different joint style, etc etc etc... but the finished product won't look significantly different or have any change in functionality.
Sharp dive somewhere in the 40k region is my guess.

$BTC Weekly Chart AnalysisCRYPTOCAP:BTC Weekly Chart Analysis (All numbers in USD)
Current Price: $85,194
Timeframe: Weekly – my preferred timeframe for long swing trades or investment theses
⸻
Bull Case 🟢
To reignite bullish momentum, Bitcoin needs to:
1. Break above the 0.382 Fib @ $87,303
2. Follow through by breaking the 20-Week Moving Average @ $92,496
If both of these levels are cleared, I believe we’ll be heading back toward All-Time Highs ($109K) fairly quickly. I currently assign 50% odds to this scenario.
Above those levels, we enter new price discovery, which would require a fresh analysis.
⸻
Bear Case 🔴 (Also 50% odds overall)
⚠️ First Lines of Support:
• 50-Week MA @ $77,321
• 0.382 Fib @ $73,783
→ 30% odds of retesting this level.
It’s possible the market ranges between GETTEX:87K and FWB:73K for a while, which would actually be bullish long-term — allowing BTC to build a strong support base through accumulation.
🛑 Second Major Support (Very Strong):
• Multi-year Cup & Handle Breakout Zone
• Strong Volume Shelf
• 0.5 Fib @ $62,855
→ 20% odds of reaching this.
If we do test this level, I believe it’s very unlikely to break below.
🚨 Final Support Warning:
• GETTEX:48K = Critical level
→ <1% odds of reaching
A break below would signal the end of the bull cycle in my view.
⸻
Final Thoughts
As Bitcoin is a non-producing asset with no fundamentals or balance sheet to anchor it, all of this is purely price action-driven — so I won’t assign timelines to these scenarios.
📌 Personally, I do not hold any BTC currently. With the odds at 50/50, the risk-reward doesn’t appeal to me right now — I see better opportunities elsewhere. However, I’ll reconsider if the bullish breakout scenario plays out.
⸻
Hope this breakdown helps! Make sure to adjust your strategy based on your own risk tolerance.

Technical Analysis on BitcoinHey guys
Bitcoin has recently broken out of a long-term descending channel, which has caught the attention of many traders. Typically, once the price stabilizes outside of such a channel with confirmed candlestick closes, buyers enter the market in anticipation of a bullish move. However, it's important to be cautious.
There is still a possibility that the price may retrace to a highlighted liquidity zone below, where it can gather enough momentum and liquidity for a stronger upward movement.
Therefore, traders should be aware of potential false breakouts and wait for solid confirmations before fully committing to long positions.

Happening NOW, breakout on Daily, 4hour and 60min timeframesUsing simple trend lines, a buy signal has happened on the Daily, 4-hour and 1-hour charts.
I'm using the candle bodies for my trend lines.
