BTC/USD 1H Chart Analysis – Bearish Setup with SBR Rejection🔵 Key Zones & Levels:
🔷 SBR Zone (Support ➡ Resistance):
Price Range: ~$81,000–$83,000
🛑 Stop Loss: $83,002.31 (Just above resistance)
Expecting sellers to step in here if price retests this level
🟠 Mid-Range Zone:
Current price is consolidating just below SBR zone
Could form a lower high before dropping
🟦 Target Zone (Support Area):
🎯 Target Price: ~$75,000
Previous demand area – price bounced hard from here before
🔁 Trade Plan:
📉 Bias: Bearish
📍 Entry: Near current price or after retest of SBR zone
🛑 Stop Loss: $83,002.31
🎯 Target: $75,000 (approx -8.33%)
✅ Summary:
Risk-Reward: Appears solid (R:R > 2:1)
🕵️♂️ Watch for: Fakeouts or rejections in the SBR zone
🔻 Potential Move: -6,804 points if plan plays out
BULLUSD trade ideas

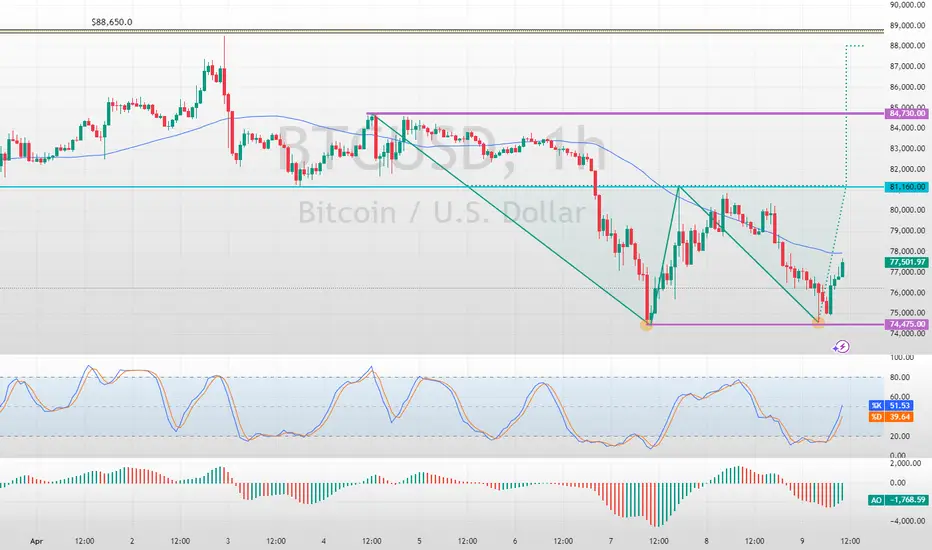
Bitcoin Formed a Double Bottom Bullish PatternFenzoFx—Bitcoin formed a double bottom bullish pattern. A consolidation phase toward $81,160 is imminent if the price holds above $74,475.
>>> Trade BTC/USD, swap free at FenzoFx Decentralized Forex Broker.
BTCUSD 1H Outlook – Anticipating Liquidity Sweep & ReversalPrice is currently reacting at minor resistance, but the structure suggests a potential liquidity grab below the recent lows. If price taps into the 74K demand zone, I’ll be watching for bullish confirmation targeting the 84K region.
📌 Key Levels:
Demand: 74,000
Resistance: 84,000
Watching for: Sweep > Rejection > Break of structure
Patience here is key. Waiting for price to show its hand before executing.

Bitcoin and 50 SMA on a WEEKLY chart - UPDATE Following on from the sharp drop in the beginning of the week, where PA dropped Below the 50 SMA ( RED) , PA has recovered and, as you can see, the candle Body is currently sitting ON the 50 SMA
We may need to remain in this area to bring back the Bullish Sentiment and then move higher.
It can be said that a bullish sentiment remains with Bitcoin as its did NOT crash as sharply as Stock Markets.
We are also now waiting on the MACD to fully enter the "Bounce Zone"
The Weeks candle on the histogram has returned to RED and so some caution is required here, while we wait.
It is the next few days that are crucial now. The "Tariff" dust us settling and countries are reacting to Trumps Tariff impositions.
My Gut feeling is VERY positive right now.
But that is just me,
Watch that candle on the 50 SMA like a Hawk. If we loose that again and the week closes below, THEN we need to think carefully

check the trend It is expected that a trend change will form in the current resistance range and a corrective trend will form. By passing the resistance range, the upward trend will likely continue.

BTC heading to 59k levels, then 50kThere is no macro narrative nor equity flows to support any story of CRYPTOCAP:BTC bouncing back north. It will hit the next support levels at 100week and 200week SMA, which also correspond to the bottom of this bullish long term channel.
There needs to be a positive macro narrative to facilitate the volumes needed to make the price movement trend north but I see indication of that in US or European markets for the foreseeable future.

The Big drop is coming This is just my idea I'm hoping Bitcoin will fall to 72000 if it does I'm thinking it going to keep dropping to 70000. This would be great if your in a sell now might take a day or 2 to get there but I'll wait if the monoooy is right lol. COINBASE:BTCUSD

Level to watch The market is currently at a critical juncture, facing a pivotal decision: either rallying back to 90,000 or breaking the key support level at 73,800.
Previously, I highlighted a potential top once the market reached 100,000, with an initial target around 74,000, which the market has already breached twice. At this stage, it’s a fierce battle between the bulls and the bears, making it challenging to predict the next move.
A rally from here could push the market back into the 85,000-90,000 range. If it breaks through 90,000, there’s potential for a climb to 108,000, possibly even 125,000.
On the other hand, a break below the crucial support at 73,800 could signal a deeper correction, potentially bringing the market down to 48,000.
I've been short on ETH and XRP, expecting a more bearish trend for both. ETH has already hit its target, while XRP could potentially drop back to 0.45.
The upcoming days will certainly be fascinating to watch.

180K BITCOINBitcoin is doing the nastiest change of hands from the impatient, accumulate each dip, we will WIN!

BTC Perfect Retrace .618 Fib on the 4hr Timeframe. LONG??As BTC just Retraced on the .618 Fib, this may indicate that BTC is on a slow trend-reversal.
As it's 20 min later now after i started the first line of this Chart-reading, I see the Green candle has grown significantly already, which indicates bullish momentum.
I have set 5 Fib levels for Retracement possibilities.
I actually think i did it a bit wrong here, for it will ofcourse not retrace all the way up in 1 leg. But it may happen in a few moves/waves.
I have NOT consider EWT here so I think that also makes my Analysis not too accurate yet, but ofcourse, the 0.5 and .618 are feasible. I haven't speculated price-movements (for time-reasons) because I am thinking of starting a Funded acc fast to catch a few moves on the market! Lets see what it does!
*All fibs according to colour, 0.5-628-1 and 1.618 respectively.
I appreciate Criticism, boosts and Feedback for my learning curve.
So if you criticise, please be constructive.
**At this point it has NOT even touched the .236 level yet, which may indicate a weak bullish bounce, thus a continuation of downtrend, But as this is the 4 hour timeframe, I think we have plenty of time to make that 0.5 or 618 level possible! - I havent considered any other timeframes yet, for same reasons: I can't lose that time right now. Maybe I can make a more complete analysis later. This is all for practice and learning! 😘💖

BTC Rejection at $82K Leads to FVG Retrace and $68K TargetBitcoin's recent price action shows a failure to establish a higher high after an attempted liquidation. The price encountered significant resistance around the $82,000 zone, leading to multiple rejections at this potential support level. Subsequently, there was a decisive break below the $82,000 zone, leaving behind a Fair Value Gap (FVG) in its wake. Following this breakdown, the price retraced back into this FVG, presenting a potential opportunity for a short-term sell entry. The targeted area for this trade is a lower order block situated around the $68,000 zone. This scenario suggests a bearish continuation bias after the failed breakout and the filling of the inefficiency created by the initial downward move.

Bitcoin rsi wavesThe rsi is producing waves. It looks like we might be hitting the bottom of the current one.


BTC trading strategy analysisTrade setup:
⬇️ Sell now or sell on 79000.0
⭕️SL @ 80500.0
🔵TP1 @ 75750.0
🔵TP2 @ 74410.0
🔵TP3 @ 72400.0
What are these signals based on?
Classical Technical Analysis
Price Action Candlesticks Fibonacci
RSI, Moving Average , Ichimoku , Bollinger Bands

* BTC Elliot Waves Analysis Update * Hello again fellow gamblers,
This is another update on my Bitcoin analysis.
Thanks for watching the video and Let me know what you think!

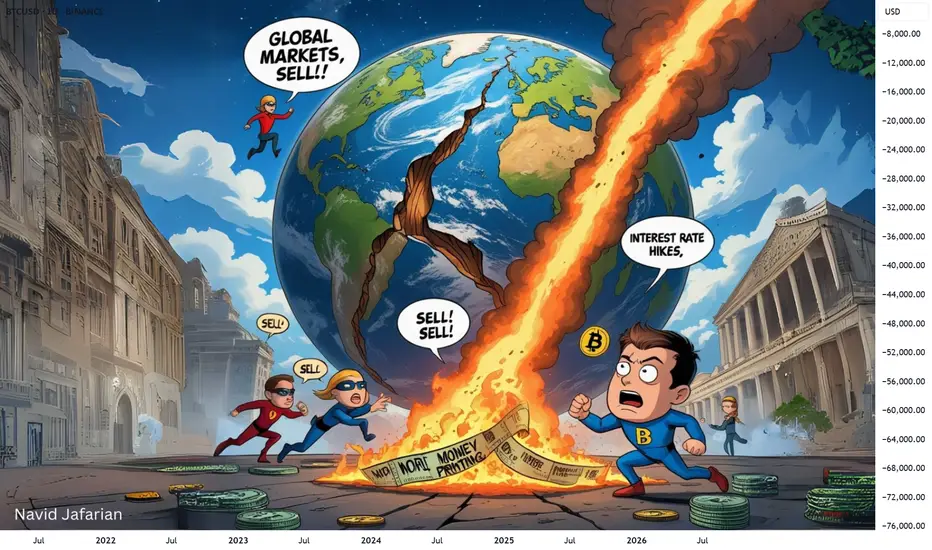
Global Markets Crashing: What Now?⚠️ Global Markets Crashing: What Now?
Don't panic , this is a worldwide event . Even big players are affected.
The important thing is to be patient and focus on future opportunities . We're hoping for a recovery in 2025.
We're holding on! ⏳
If you're experiencing losses right now , don't get discouraged, almost everyone is in the same boat . Even the largest funds managing billions of dollars are in trouble. Trillions of dollars are being wiped out from the world economy. Every country and every stock market is crashing. If you're thinking, 'My altcoin is dropping,' just look at how much ETH has fallen (18% in just one day).
Everything across the globe is falling , so it's natural that our market and investments will also fall. Don't feel bad if you didn't sell at the top in November or December; these are learning experiences for the future. Remember to take profit in the next uptrend.
Right now, all we can do is wait and hope for global issues to be resolved. Interest rate cuts and printing more money could bring a recovery in 2025.
S tay strong and make sure to take your profits if we see a big pump towards the end of the year.
We are also holding all our assets and waiting.
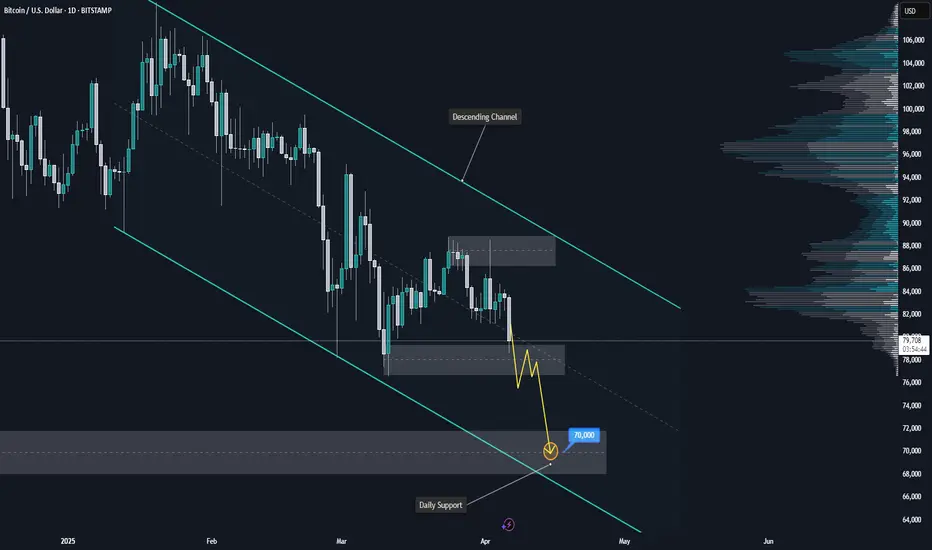
BITCOIN Downtrend Continues – Is $70K the Next Stop?COINBASE:BTCUSD continues to trade within a well-defined descending channel, maintaining a clear bearish market structure on the daily timeframe. After a strong rejection from the upper boundary of the channel, the price has retraced to a minor support zone around $78,000.
Given the prevailing momentum and strength of the broader downtrend, this support is likely to break under continued selling pressure. A clean breakdown below this level would reinforce the bearish bias and open the door for a move toward the daily support zone near $70,000, which aligns with the lower boundary of the channel.
This zone marks a potential area of interest where price may react or attempt a short-term bounce. However, unless there is a significant shift in momentum, the path of least resistance remains to the downside.
Traders should watch for confirmation of the bearish continuation, such as lower highs, weak bullish pullbacks, or increased volume on red candles, before considering short entries.
If you align with this outlook or have additional perspectives, feel free to share your thoughts below.
BTC on the Edge of Capitulation.Bitcoin trades on a critical make or break level of a big bullish butterfly from the topping arch.
This tends to be an imperatively important pivot point in a trend. In the strong trend the butterfly is an ABC correction and then we're into a new 5 wave climb. In the failure of the butterfly, this is the failure of the uptrend and we switch from a steady consistent downtrending action with pullbacks and new lows to out and out puking.
We are right on the verge of puking.
BTC is now trading at this level for the third time. Realistically, the best odds were off the first one. Being here a third time is quite sketchy.
Coupled with the fact indices are looking ultra rough and most of the alts are showing massively obvious big break signals (like huge head and shoulders etc) - this looks bad.
If this breaks there are no major supports before 55K. The next supports would be minor shallow bounce supports. We could downtrend to the 4.23 fib which is around 20K and if we get there a spike out of it would even make 10K viable.
BTC can drop over 70% from the price is trades today in a butterfly break.
We sit specifically on the decision level now.
If it breaks- it can be a very serious thing.
MUCH WORSE THAN THE LAST BREAKS.

bitcoin 1 min trade setup btc 1 min trade setup. I am expecting an up move in bitcoin for a short period of time.

Weekly BTC: Could Bitcoin Crash to $30K Before the US Election?My messages or posts are NOT intended as a recommendation to buy, sell securities or cryptos. Not Financial Advise! DYOR!

"Monthly timeframe of Bitcoin using TradingView patterns."In these similar trends from the past, with equal distances, these vertical lines are based on the idea of Hawking (if I remember correctly, the name escapes me). But look at the chart, I've drawn boxes that indicate this. In these time frames, we observe both significant growth and sharp declines until the last arrow tip. If you notice, there’s growth and then it gradually slows down. My own weekly plan is to buy around levels 71, 70, and 69, but in the future, Bitcoin is likely to reach above 200,000

BTCUSD: Last chance to prove the Bull Cycle is still intact.Bitcoin remains bearish on its 1W technical outlook (RSI = 40.819, MACD = 1234.500, ADX = 47.185) as it is on the 3rd red 1W candle in a row, which just hit the 1W MA50. First contact since Sep 2nd 2024. The weeky low is also almost at the HL bottom of the Bull Cycle's Channel Up. Needless to say, it has to hold in order for the bullish trend to continue. Practically this is the market's last chance to prove that the Bull Cycle is still intact. So far the -32% decline is no different that all prior inside the Channel Up but an Arc shaped bottom needs to start forming. If it does and that's the new bottom, expect $160,000 by September.
## If you like our free content follow our profile to get more daily ideas. ##
## Comments and likes are greatly appreciated. ##

BTCUSD Downtrend until 68K then switch to 129KIn my opinion, Bitcoin will continue its downward movement to around the $68,000 level, as indicated in the image. Afterward, it will execute its final upward movement for the year 2025, reaching approximately $129,000.
