Massive bullish divergence on BTCUSD 1D chartThe is a massive bullish divergence on the BTCUSD 1D chart.
BULLUSD trade ideas

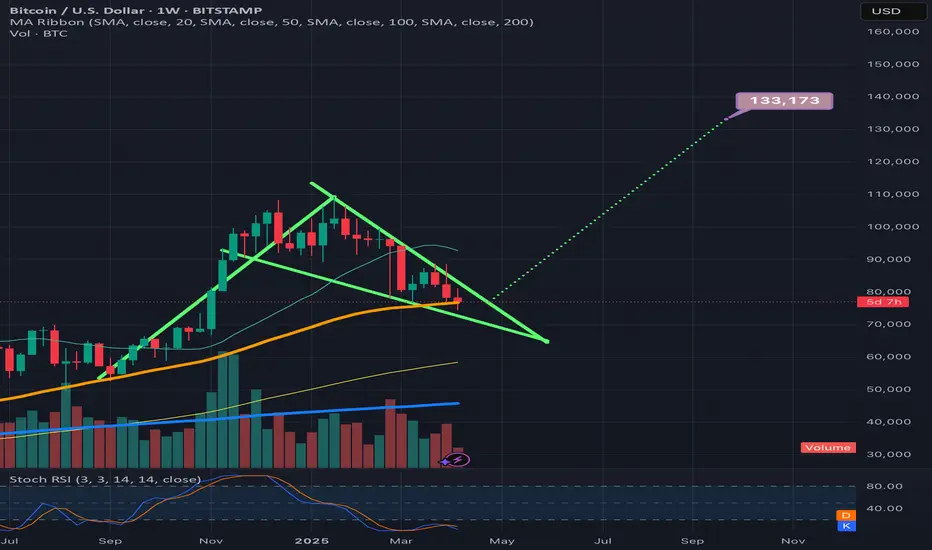
1day chart fallingwedge/bullish pennant on bitcoinI just posted a weekly version of this same pennant in the previous idea which I will link below, i wanted to also post the version of it on the 1day timeframe as well because the top trendline of the wedge on the 1day time frame has a different trajectory which lengthens the wedge considerably. With this longer wedge we can see that if it is the more valid for the 2 versions, that we probably wouldn’t be expecting a breakout until June at the earliest. Not quite sure yet which version of this wedge is ore valid so I’m posting both versions for now to keep and eye on them. For the weekly charts pattern to be the more valid of the 2, we will likely need to see the weekly 50ma continue to maintain support. *not financial advice*

BTCUSD. Weekly bull pennantThe daily failing wedge’s top trendline is not as sharp of a trajectory as the the weekly timeframe’s and due to this, the daily time frames wege is noticeably longer, so I thinkI am going to post a follow p idea to this one that shows the longer version of the wedge, not sure which one is more valid yet at this current time. If the weekly 50ma(in orange) can hold support then we should break up from this wedge right around where I have placed the dotted measured move lne, in which case the breakout target would be around 133k, if the longer version of the wedge on the daily time frame is the more valid of the two then we will likely have to correct longer before we see a breakout. Will post the longer version n the very next idea post. *not financial advice*
BTCUSD APRILBUY BELOW GOLD LINE
SELL ABOVE
EVEN A CAVEMAN CAN DO THIS
Remember, it's gonna be a wild ride. And that ride never ends.

BTC SHORT TP:77,200 07-04-2025⚠️ Despite its recent recovery, Bitcoin is showing bearish patterns on the 1-hour and 2-hour timeframes. That's why I'm targeting a short at 77,300.
This analysis is based on those timeframes, so we expect it to develop in the next 12 hours; otherwise, it will be invalidated.
Follow me to stay updated and keep stacking those greens together! 💰🔥

BTC, Daily, LongBTC, Daily, Long
Based on Hyper block liquidity
!st Target 84K
2nd Target 86k
3rd Target 90k


Bitcoin Plan.I tried to explain simply the things to pay attention to.
* The purpose of my graphic drawings is purely educational.
* What i write here is not an investment advice. Please do your own research before investing in any asset.
* Never take my personal opinions as investment advice, you may lose your money.

$$$ BTCUSD MACRO-BULLISH $$$ 1W CHART $$$BITFINEX:BTCUSD 1W Chart
There are many reasons to look at this weekly chart and see that there's absolutely no reason to be bearish on Bitcoin yet.
Holding strong r/s flip support.
Holding regression trend.
Holding parabolic trend.
Stoch RSI at the bottom.
Weekly bullish divergence.
Assuming this plays out in a way that's similar to the last local bottom, the current target is around $134k-$135k.
It would take a lot to invalidate all of these bullish indicators, but if that does somehow happen, with a CLOSE of the weekly candle that invalidated these, then It's pretty much definitely over for a loooong time.
NFA blah blah blah..

BTC Tightening Up – Key Support & Resistance in Focus!📝 🚀 BTC/USD – 4H Price Action Masterclass | Breakout Brewing Between $71.2K & $72K!
Bitcoin is currently consolidating in a high-tension zone on the 4-hour chart, forming a classic range-bound structure between two key levels:
🔹 Support at $71,200 – a previous resistance now acting as short-term demand
🔹 Resistance at $72,000 – a strong psychological barrier that price has failed to close above
This tightening range is setting the stage for a high-impact move, and the market is showing signs of compression. No indicators, no noise — just clean structure and price action clarity.
🔍 Detailed Technical Breakdown:
📌 $71,200 – Flip Zone:
Recently flipped from resistance to support after a breakout. Price is now retesting this level with precision, suggesting potential accumulation — but failure here may trigger strong selling pressure.
📌 $72,000 – Critical Resistance:
This level has held price down for multiple sessions. If bulls manage to close above it on strong volume, we could see a push towards FWB:73K +, where liquidity clusters await.
⚔️ Battle of the Zones – What to Expect Next?
Bullish Scenario: A breakout above $72,000 on strong bullish candles could ignite a move toward the next resistance at $73,500–$74,000.
Bearish Scenario: If $71,200 breaks down, expect a sharp drop toward $70,400, possibly extending to the $69K handle.
This setup offers a textbook example of how support/resistance zones act as battlegrounds for short-term market control.
🔥 Why This Chart Matters (No Indicators Used):
Clean price action = clean decision-making.
Ideal for breakout traders & range scalpers.
High probability setup with defined risk levels.
Easy to read & replicate — especially for beginners learning PA.
💬 What’s YOUR take?
Are we about to see a bullish explosion, or is this a trap before a deeper drop?
👇 Drop your analysis in the comments – let’s build a real traders’ conversation below!
📈 If you found this chart helpful, don’t forget to like & follow for more clean setups.

Bitcoin has come down to our buy areaWe are now at the previous resistance support flip. only based on our technical analysis and regardless of fud and fundamental factors affecting the market this could be a very healthy area for a reversal after our 4–5-month downtrend.
Regardless or not of the bull market continuation or another lower high possibility in the above said downtrend, this i still a great area for us to make huge profits technically.

$75K BIT COIN: ReboundSo, since my last forecast we've finally after a few weeks reached the $75K mark. Is the bloodshed over? No.
Price is respecting areas where pivots happens based on the data thus far it is moving in a sellers market profile since it made its sharp decline on entering February 2025. At the end of February it was confirmed with the selloff that took it down to$78K and has a sharp bounce reaction as the buyers were getting squeezed the pressure was on there was profit taking also causing a selloff ripple effect.
Now finally having just tapped below $75K and briefly bounced, is the nightmare over? Based on the economic outlook my take is, we're not done with down momentum. I would expect price to dabble inside the two black horizontal lines and try to balance itself in this area $70-$65K. But that doesn't mean it cannot continue to bomb dive to a psychological price level $50K which makes total sense after hitting $100K.
Understand that all other coins have lost nearly or more of their value. If you were on the sidelines and cashed out at the highs consider yourself smart or lucky or both-- that was a good move. But are you considering buying at what some consider this to be a 'discount selloff' to buy the dip and HODL once more for a return to ATH?
Crypto tends to do its run during Fall/Winder. Is it smart to buy now or wait more mid-summer to start loading up the boat?
What are your thoughts!

Were To Buy BITCOINMartyBoots here , I have been trading for 17 years and sharing my thoughts on COINBASE:BTCUSD here.
.
BTC is very interesting chart for now that it has dipped 30% and trying to find support.
Do not miss out on BTC at the important levels as this will be a great opportunity
Watch video for more details

BTCUSD capped by resistance at 84,600Recent price action in Bitcoin (BTCUSD) suggests an oversold bounce, with resistance capping gains at the 88,000 level. The continuation of selling pressure could extend the downside move, with key support levels at 76,144, followed by 74,420 and 73,283.
Alternatively, a confirmed breakout above 84,600, accompanied by a daily close higher, would invalidate the bearish outlook. In this scenario, Bitcoin could target 88,000, with further resistance at 91,890.
Conclusion:
The price remains below pivotal level, with 88,000 acting as a key resistance. Failure to break above this level could reinforce downside risks, while a breakout could shift momentum back in favor of bulls. Traders should watch for confirmation signals before positioning for the next move.
This communication is for informational purposes only and should not be viewed as any form of recommendation as to a particular course of action or as investment advice. It is not intended as an offer or solicitation for the purchase or sale of any financial instrument or as an official confirmation of any transaction. Opinions, estimates and assumptions expressed herein are made as of the date of this communication and are subject to change without notice. This communication has been prepared based upon information, including market prices, data and other information, believed to be reliable; however, Trade Nation does not warrant its completeness or accuracy. All market prices and market data contained in or attached to this communication are indicative and subject to change without notice.

BITCOIN Will Move Lower! Sell!
Take a look at our analysis for BITCOIN.
Time Frame: 30m
Current Trend: Bearish
Sentiment: Overbought (based on 7-period RSI)
Forecast: Bearish
The market is testing a major horizontal structure 79,880.44.
Taking into consideration the structure & trend analysis, I believe that the market will reach 78,453.18 level soon.
P.S
The term oversold refers to a condition where an asset has traded lower in price and has the potential for a price bounce.
Overbought refers to market scenarios where the instrument is traded considerably higher than its fair value. Overvaluation is caused by market sentiments when there is positive news.
Disclosure: I am part of Trade Nation's Influencer program and receive a monthly fee for using their TradingView charts in my analysis.
Like and subscribe and comment my ideas if you enjoy them!

Bitcoin 1hr Update, Retrace To Continue HigherBitcoin from the 1hr pov will drop to the area between $78850 - $77555 to then bounce and continue higher but just to test the $82865 Res line, and as long as the Daily is in extended Bearish mode every bounce will be short lived to then continue lower until the Daily exits the Bearish mode.

Bitcoin IndecisionBitcoin printed a small bounce yesterday after a strong breakdown, but the technicals remain mixed. Let’s break it down.
The most obvious development is the **death cross** – the 50 MA has now crossed below the 200 MA. While this is considered a bearish signal, it’s also a **lagging indicator**, often reflecting past weakness rather than predicting future price action. The last time we saw a death cross on the daily chart, it came near the bottom, so take it with a grain of salt.
More interesting is yesterday’s candle – a small-bodied candle with long wicks on both sides, forming something of a **doji**. That reflects indecision after a high-volume breakdown. Bulls stepped in to defend just above the $73,800 support zone, which aligns with the May 2024 all-time high and previous resistance turned support.
Price is still trading well below both moving averages, which are now resistance. The triangle breakdown remains intact, and momentum has clearly shifted lower – but holding this horizontal support zone would at least keep the higher timeframe bullish structure alive.
In short: **death cross, indecision candle, and a critical support retest**. Bulls need to prove themselves quickly – otherwise, the path of least resistance could remain down.


Confluence at 65KBTC seems to be developing a bullish Gartley pattern, currently evolving within a potential bear flag.
The pattern would complete at point D, around $64,600–65,000, where multiple confluences meet:
- 78.6% retracement of XA
- 141.4% extension of BC
- Lower boundary of the flag
- Retest of former resistance trendline
- Saylor’s average entry price 😏
A key condition: we need to break below the current wedge to increase probabilities of reaching point C.
Until then, the pattern remains a setup in progress.
Letting it unfold, one leg at a time.

Bitcoin Bubble at $70K? Prepare for ImpactBitcoin recently faced strong rejection near the $81,000 level, forming a potential double top pattern on the higher timeframes. This classic bearish reversal setup is now playing out, as price action has begun to decline from the second peak.
Adding to the bearish confluence, the MACD has confirmed a bearish crossover, signaling weakening momentum and a potential trend reversal. The rejection at $81K aligns with historical resistance, and price has failed to break above it despite multiple attempts.
Going forward, there are two key scenarios to watch:
Retest of the $76,700 zone – A minor support area that could offer a bounce or consolidation before the next move.
Deeper pullback towards $70,000 – If bearish pressure continues, CRYPTOCAP:BTC could head lower to test this psychological and technical support level.

BITCOIN EMERGENCY!!!Please refer to my previous ideas on bitcoin it’s been a good flow on mapping where it goes :)
Bitcoin do historic moves we rally to 300k soon
Then eventually 2 million by 2030 see you guys on mars

The last bullish chance of Bitcoin in mid-term !!BTC is in a Falling Wedge Pattern. This means The Bulls Have Higher Chance To Claim The Trend Than Bears! No Break out Has Happened yet and we shall wait for a Break out But It should Happen Pretty Soon Because there is also a Regular Bullish Divergence On MACD as well! So The Bullish Chance for BTC Is Pretty High and we Shall see a Bullish Movement Up to $100K Pretty Quick!
-BTC is in a Falling wedge Pattern
-No Break out
-(+RD) on MACD
Give me some energy !!
✨We spend hours finding potential opportunities and writing useful ideas, we would be happy if you support us.
Best regards CobraVanguard.💚
_ _ _ _ __ _ _ _ _ _ _ _ _ _ _ _ _ _ _ _ _ _ _ _ _ _ _ _ _ _ _ _
✅Thank you, and for more ideas, hit ❤️Like❤️ and 🌟Follow🌟!
⚠️Things can change...
The markets are always changing and even with all these signals, the market changes tend to be strong and fast!!

CHECK BTCUSD ANALYSIS SIGNAL UPDATE > GO AND READ THE CAPTAINEntry Zone: Around 79,200 USD (blue shaded box).
Stop Loss: Marked in red at 79,500 USD (to limit losses if the trade goes against you).
Take Profit Targets:
Take Profit 1: Around 78,750 USD
Take Profit 2: Around 78,500 USD
Last Target: Around 78,250 USD
