BTC is still bullish!!!🚨 CRYPTOCAP:BTC is dipping hard! 🚨
📍 All eyes on $72,000 — this could be the ultimate buy zone:
🔽 Why this level matters:
1️⃣ Bottom of the blue wedge
2️⃣ Flipped resistance → support
3️⃣ Major demand zone
4️⃣ Classic -34% pullback move
📊 This could be a textbook entry point.
Are you ready to catch the bounce?
BULLUSD trade ideas

This could be a bitter end for BTC or an opportunity !!!Do you think this will happen, or do you see Bitcoin below $50K in the future?
Give me some energy !!
✨We spend hours finding potential opportunities and writing useful ideas, we would be happy if you support us.
Best regards CobraVanguard.💚
_ _ _ _ __ _ _ _ _ _ _ _ _ _ _ _ _ _ _ _ _ _ _ _ _ _ _ _ _ _ _ _
✅Thank you, and for more ideas, hit ❤️Like❤️ and 🌟Follow🌟!
⚠️Things can change...
The markets are always changing and even with all these signals, the market changes tend to be strong and fast!!

BTC - One More Leg...Hello TradingView Family / Fellow Traders!
This is Richard, also known as theSignalyst.
📉 BTC has been overall bearish , trading within the falling channel marked in red.
But the big question is — where could the potential bottom be?
👉 I’m watching the $70,000 zone!
Here’s why:
The $70,000 area is a key confluence zone — it aligns with the lower red trendline, horizontal support, a psychological round number, and a potential demand zone.
📚 According to my trading style:
As #BTC approaches the blue circle zone, I’ll be looking for bullish reversal setups — such as a double bottom pattern, trendline break, and more.
📚 Reminder:
Always stick to your trading plan — entry, risk management, and trade management are key.
Good luck, and happy trading!
All Strategies Are Good, If Managed Properly!
~Rich

Bitcoin (BTC): We Are In Profits, "Bloody Monday" "Bloody Monday," as they call it, is currently breaking every local support zone on smaller timeframes, and we have more and more BOS on the way.
While we are not yet where we want to be, we are keeping a close eye on our target zone, which we are going to reach, no doubt.
After that we will see how price will reach that zone and determine if we fall more or have the push we've been needing.
Swallow Academy

Bitcoin If you missed the rally do not top blast. Do not fomo. Do not trade with emotions.
If you bought the rally, congrats. Pay yourself. Do not get blinded by greed. Do not roundtrip
Back in 2022 most where celebrating there unrealized gains, and got liquidated when the market corrected. Every asset in the world follows one simple rule, nothing goes up forever.
The is no more liquidity on the up-side, we will go down. Gather liquidity for the next rally and bounce, just like 2022.
Bitcoin will be the most important asset you can have, but it has to follow the basic rules and will not go up forever.

BTC in a long correctionBTC as shown is in a correction pattern that could be an ABC or others, if this is true it is expected to be back down in 50 channel.
Good luck.

Bitcoin at MAJOR SUPPORT! Intraday Update: Bitcoin has hit major support at the 74000 level (today's lows at 74420) which should allow for a move back above the 80K level. A move below 74K level could put the 68848 level in view,

BTC/USD Forming Bullish Falling Wedge – Potential Target📐 2. Technical Pattern – Falling Wedge
A falling wedge forms when the price consolidates between two converging downward-sloping trendlines. It suggests diminishing selling pressure and a likely reversal.
Key Characteristics in This Chart:
Upper Resistance Trendline: Formed by connecting the series of lower highs.
Lower Support Trendline: Formed by connecting the lower lows.
The price respects both boundaries, confirming wedge structure.
Volume generally decreases during the wedge (implied but not shown).
✅ Bullish Implication: Once price breaks above the upper resistance, it often triggers a sharp upward move due to the squeeze of supply and the build-up of demand.
🧱 3. Support and Resistance Zones
🔻 Resistance Zone:
Area: ~100,000 to ~108,000 USD
Marked as a wide horizontal band (beige-shaded area).
Previous price peaks and consolidations suggest this zone is strong supply.
Breakout above this zone could trigger momentum towards the higher target.
🔹 Support Zone:
Area: ~72,000 to ~75,000 USD
Historical reaction level where buyers previously stepped in.
Coincides with the lower wedge boundary and recent bounce points.
Repeated tests strengthen this as a reliable accumulation zone.
🎯 4. Trade Setup Strategy
💼 Entry Strategy:
Trigger: A confirmed breakout above the wedge’s upper trendline (black diagonal line).
Confirmation: A strong bullish daily close above the trendline, ideally with volume spike.
The current price (~77,130) is near the lower boundary—offering a potential early entry or low-risk setup with a tight stop.
📌 Stop-Loss Placement:
Level: 70,916 USD
Below the wedge’s lower support and beneath the broader support zone.
Ensures exit if the pattern fails or bears regain control.
🧭 Target Projection:
Target Price: 114,562 USD
Based on the height of the wedge projected from the breakout point, a standard wedge breakout measurement.
Aligns with historical highs and psychological resistance.
🧮 Risk-Reward Ratio: Assuming entry around 77,130:
Risk (Stop-Loss): ~6,200 points
Reward (Target): ~37,432 points
R:R Ratio ≈ 1:6 – Highly favorable
⚙️ 5. Market Psychology & Price Action Insight
The falling wedge pattern suggests exhaustion of sellers.
Buyers are defending the support zone aggressively—creating higher lows within the wedge.
Each bounce is slightly more aggressive, indicating growing bullish sentiment.
A breakout from the wedge could act as a catalyst for rapid price acceleration as sidelined bulls enter and shorts cover.
📊 6. Summary of the Setup
Component Detail
Pattern Falling Wedge (Bullish)
Timeframe 1-Day Chart
Entry Point Breakout above upper trendline
Stop Loss 70,916 USD
Target 114,562 USD
Support Zone 72,000–75,000 USD
Resistance Zone 100,000–108,000 USD
Risk/Reward Approx. 1:6
Bias Bullish
📌 Final Thoughts
This setup provides a technically sound opportunity with clear invalidation (stop loss) and a well-defined profit target. The risk-to-reward ratio is attractive, and the price structure suggests a bullish reversal is likely, pending a confirmed breakout.

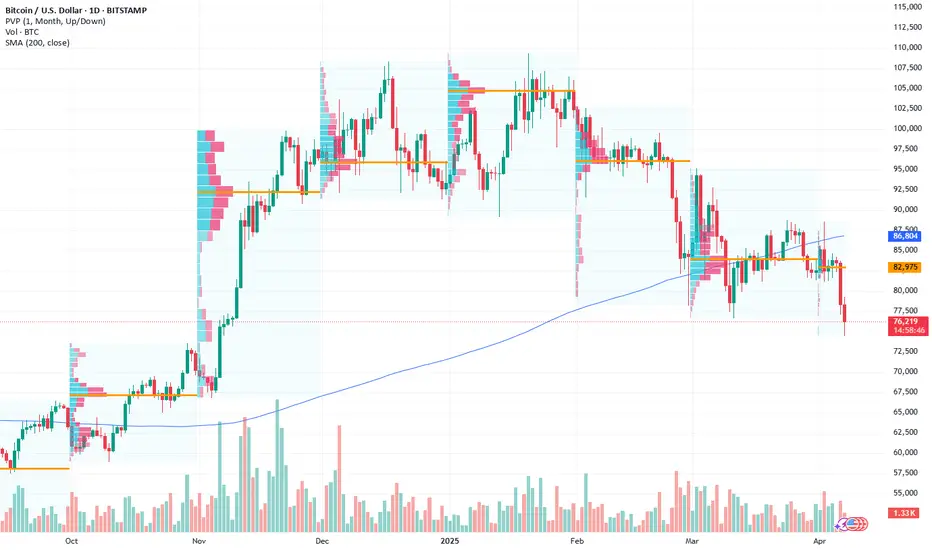
Bitcoin Tests 2024 HighBitcoin is sitting at a critical inflection point on the daily chart. After breaking down from the symmetrical triangle with strong momentum, it continued lower, with volume confirming the move.
It’s now landed squarely in the FWB:73K –$75K region – a zone that just so happens to be the May 2024 all-time high. I’ve casually mentioned for over a year that a retest of that level wouldn’t be out of the question – and here we are.
Both the 50 MA and 200 MA were already acting as resistance going into this drop, so there were plenty of warning signs before the breakdown. With price now resting above major horizontal support, bulls need to hold the line here to keep the broader uptrend intact. A bounce would be constructive and could eventually form a higher low on the larger timeframe. But if this level fails, the door opens for a much deeper correction.
Bottom line: this is a massive test. The next move will likely shape the tone for the rest of the quarter.

I'm Bullish, but... BTC / USDHello my friends,
At a minimum we're looking at 30 days inside this wedge before breaking out and testing the $96k range once again. Trust me, Bitcoin must form a bullish structure before doing anything interesting.
It could wick to FWB:73K but I'm thinking the heavy orders around $75k might hold and we range instead of dumping more.
Keep an eye on this wedge.
Trade thirsty, my friends!

74k very likelyHello traders! I think this week is the bootom of this movement, and 150k should hit next. Keep stacking BTC!

BTC - Slight Distribution After Nearly 10xMorning my fellow traders, and happy new year!
I hope you do not have a hangover right now. But if you do, get a tea going, it usually does the trick for me!
I can't deny the possibilities for another rally to take out the highs, but I'm thinking what the market makers are planning is a simple inverted Adam & Eve pattern that will lead us to new opportunities within the next month or so.
Keep in mind that for sometime now Alts have not been giving, and I believe that after this next Alt season (which I believe we will still get), they will keep giving less and less.
I sold near $100k for probably a couple weeks now. Did not get a perfect $108k sale, which is fine. Now I'll focus on a reentry if this plays out.
Trade thirsty, my friends!

Pullback to 80KMorning folks,
So, our long-term bearish journey that we were following for 4-5 weeks comes to an end. BTC more or less hit our 74K target and strong weekly support area .
The next one stands around 69K, but market strongly needs a new driving factor to break ~70K support area, and hardly this will happen this week.
Taking in consideration that market is oversold, now we set a tactical target- pullback to 80K resistance area , and then we will see, should be sell again or not.

Will BITCOIN prove to be resilient amidst this market crash??Bitcoin (BTCUSD) just hit its 1W MA50 (red trend-line) for the first time since September 06 2024, while completing the first 1D Death Cross since August 09 2024. This is a critical double combo development as last time those conditions emerged it was a bullish signal.
Despite the theoretically bearish nature of the Death Cross, the last one on 1D was formed just four days after the market's previous major long-term bottom of August 05 2024. That bottom was exactly on the level that the market hit today, the 1W MA50.
The 1W RSI sequences among the 2 fractals are identical and if it wasn't for the abysmal negative market fundamentals regarding the back-and-forth tariffs, that would be an automatic long-term buy entry, the 3rd on of this Bull Cycle.
The only condition we can technically rely on right now, amidst the stock market crash, is for the weekly candle to close above the 1W MA50, as it did on August 05 2024. In that case and of course if and only if the trade war gets under control (and/ or the Fed makes an urgent rate cut), we can expect a new long-term Bullish Leg to begin towards $150k and above.
Failure to address those concerns and a 1W candle close below the 1W MA50, can result into a stronger sell-off towards $50000 and the next long-term technical Support level of the August 05 2024 Low (49150). That would also be a major Support cluster as the 1W MA200 (gray trend-line) is just below that level (and holding since October 16 2023) and by the time of the drop, the market may test that as well.
So what do you think? Will BTC turn out to be resilient amidst this market crash or will it follow suit and decline towards $50k? Feel free to let us know in the comments section below!
-------------------------------------------------------------------------------
** Please LIKE 👍, FOLLOW ✅, SHARE 🙌 and COMMENT ✍ if you enjoy this idea! Also share your ideas and charts in the comments section below! This is best way to keep it relevant, support us, keep the content here free and allow the idea to reach as many people as possible. **
-------------------------------------------------------------------------------
💸💸💸💸💸💸
👇 👇 👇 👇 👇 👇

Bitcoin continues to fallBitcoin has broken its 3-year channel downwards, marking the start of a major correction on the 1-day timeframe

Where can Bitcoin turn bullish again? (2D)Before anything, pay attention to the timeframe of the analysis. This is a 2-day timeframe, so it will take time.
The green zone is where Bitcoin can start moving toward the specified targets. If the ATH is broken, Bitcoin could also move toward $120K and $140K. However, based on the chart, there is currently no certainty about Bitcoin’s final target.
Reaching the green zone may take more than 4 to 5 weeks.
We are looking for buy/long positions in the green zone.
A daily candle close below the invalidation level will invalidate this analysis.
For risk management, please don't forget stop loss and capital management
When we reach the first target, save some profit and then change the stop to entry
Comment if you have any questions
Thank You

CHECK BTCUSD ANALYSIS SIGNAL UPDATE > GO AND READ THE CAPTAINTrade Setup:
Current Price: Around 75,896
Entry Zone: Near 76,000 (highlighted by a blue rectangle)
Targets:
1. Take Profit 1: 76,500
2. Take Profit 2: 77,500
3. Last Target: 78,000
Stop Loss 75,250
FALLOW RISK MANAGEMENT ✅

#BTCUSDT.. single supporting area, holds or not ??#BTCUSDT. perfect move as per our last couple of ideas regarding #btcusdt
Now market have current supporting area that is around 82300
Keep close that level because if market clear that level then we can expect a further drop towards downside next areas.
Good luck
Trade wisely

BTC Setting Up for One More Drop? Eyes on 72K SweepBitcoin is moving in line with its projected bearish trend. We’re likely to see more short-side movement with imbalance being cleared toward the 72K zone. Watch how price behaves around 66.5K–68K for any reaction — but for now, momentum favors the bears. follow for more insights , comment , and boost idea

April 4 Bitcoin Bybit chart analysisHello
It's a Bitcoinguide.
If you have a "follower"
You can receive comment notifications on real-time travel routes and major sections.
If my analysis is helpful,
Please would like one booster button at the bottom.
Here is the Nasdaq 30-minute chart.
There are indicators released at 9:30 and 12:00.
First of all, Nasdaq reached a very important point on the chart
yesterday morning.
In a situation where there is no particular movement due to Trump's tariff policy,
it continues to flow downward.
As far as I remember, the US is a country with a lot of showmanship.
I've experienced it a lot while analyzing charts.
There are two indicators released today,
The Bollinger Band monthly central line touches on the chart + two indicators released,
so there is a very high possibility that Nasdaq will go up.
In the end, it's an action and a play on words to pick up and put down the ants,
and it won't be operated to the point where the US is destroyed.
Since there is a stop loss, we proceeded very aggressively.
As you can see, in the indicator announcement time zone,
the blue finger is short->long
or the red finger is long.
The rebound from the bottom is a condition for a sweep when looking at the chart upside down, so if successful, a surge can occur.
I just applied it to Bitcoin.
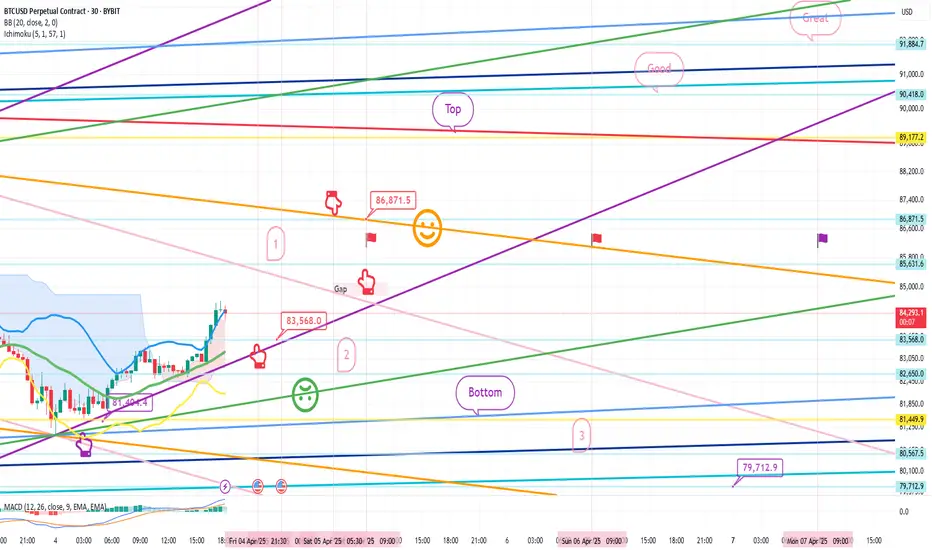
This is a 30-minute Bitcoin chart.
I marked the daily closing section for each flag,
and the purple flag on the far right is next Monday.
The purple finger on the lower left
is connected to the 81,404.4 dollar entry point yesterday, April 3.
Because it is touching the center line of the Bollinger Band 12-hour chart,
you need to hold on until 9 o'clock when additional candles are created to go up more.
*One-way long position strategy when the red finger moves
1. 83,568 dollar long position entry point / stop loss price when the green support line is broken
2. 86,871.5 dollar long position 1st target -> Top 2nd target
After that, target price in order.
If the strategy is successful, the 1st section that returns
You can use the long position re-entry section
The movement within the 1st section at the top and the 2nd section at the bottom is a sideways market.
If there is a crash in Nasdaq
It can drop below the bottom
And it can drop to 79.7K 3 times over the weekend, so please take note.
Up to this point, my analysis
Please just refer to and use it
I hope you operate safely with principle trading and stop loss prices.
You worked hard this week too.
Thank you.
BTC HTF ThoughtsChart from end of Dec/early Jan. Idea back then was that the top is in, and we'll revisit at least 51.5 levels. IMO low will be between 41.5-32.5, with potential to reach 23s.
However, it won't happen in one day and it's finally at prices i want to scale in and hold for the next weeks/months incase i'm wrong with the macro idea.
I'm a buyer between 74-62, levels in between are 72, 69, 65 and 62.

Bitcoin Poised for a Bullish Break? Eyes on Key Levels
- Key Insights: Bitcoin remains a focal point of interest with its notable
resilience amid recent market volatility. Analysts suggest Bitcoin is at a
critical juncture, and its ability to maintain support is crucial for future
momentum. This week presents an opportunity for traders to consider a long
position as Bitcoin navigates key support levels and potential breakouts.
Keeping an eye on broader market sentiments and Bitcoin’s divergence from
traditional assets, such as gold, may offer clues on price direction.
- Price Targets: For the upcoming week, traders looking at long positions might
consider these levels:
- Next week targets (T1) at $78,000 and (T2) at $82,500
- Stop levels (S1) at $73,500 and (S2) at $71,500
- Recent Performance: Bitcoin's recent market activity continues to display its
well-known volatility. Despite a broader market downturn, Bitcoin has
maintained a largely neutral to slightly bullish posture, closing last week
at levels suggesting stabilization. However, it remains under broader
downtrend pressures similar to gold, which has faced selling off despite its
technical uptrend status.
- Expert Analysis: Market experts emphasize the critical nature of Bitcoin's
current trajectory. With support levels monitored closely around $74,000,
Bitcoin’s path is seen as pivotal for dictating future trends. Its relative
resilience compared to other assets points to a potential resurgence in risk
appetite, though caution remains warranted as Bitcoin must uphold key
support to avoid bearish reversals.
- News Impact: One of the notable bullish indicators is MicroStrategy's
substantial acquisition of 22,000 bitcoins at an average price of $67,500,
revealing a positive sentiment among sectors despite existing volatility.
Additionally, technology stocks and crypto-linked equities are demonstrating
resilience amid broader market pressures, indicating a complex and nuanced
investor sentiment surrounding Bitcoin and related assets.
BTC Possible Trendmaster Scenario BTC Possible Trendmaster Scenario
Two Scenarios.
Good Market Buy zone.
Will buy more on yellow Scenario.
Bullish time will come soon
