BTCUSD: Expecting Bearish Movement! Here is Why:
It is essential that we apply multitimeframe technical analysis and there is no better example of why that is the case than the current BTCUSD chart which, if analyzed properly, clearly points in the downward direction.
Disclosure: I am part of Trade Nation's Influencer program and receive a monthly fee for using their TradingView charts in my analysis.
❤️ Please, support our work with like & comment! ❤️
BULLUSD trade ideas

BTCUSD (M30) NEW ANALYSIS RSI BULLISH
**🔹 Trend:** Short-term consolidation, larger trend still bullish
**🔹 Your Avg. Entry:** ~$83,500
**🔹 Immediate Resistance:** $84,600 – $85,200
**🔹 Strong Resistance:** $86,000 – $86,800
**🔹 Support Zone:** $83,000 – $82,600
**🔹 Key Psychological Level:** $80,000
---
### 📈 Trade Management
**✅ Targets:**
- **TP1:** $84,800 (previous rejection zone)
- **TP2:** $85,800 (near-term high)
- **TP3 (if momentum strong):** $86,800 – $87,200
**❌ Stop-Loss Options:**
- Conservative: Below $82,500
- Aggressive: Below $81,900 (structure breakdown confirmation)
**🔁 Add More?**
- Optional last buy zone: $82,600 – $81,800 (only if BTC shows wick + strong bounce on M30 or H1)
---
### 📊 Indicators to Watch (on M30)
- **RSI > 50:** Bullish continuation
- **MACD crossover + histogram green:** Strength building
- **Price holding above EMA50:** Trend intact
---
🔒 Risk Tips
- Use trailing SL if price breaks $85.5k+
- Be cautious if price breaks down and consolidates below $82.5k (could flip bias to bearish)
- Don’t overleverage near resistance

Bitcoin is approaching as the global liquidity explosion reachesThese fractal patterns don’t lie — Bitcoin has found its dip, and it’s time to reverse upward. We are ready for the explosion, because everything is repeating once again. The M2 liquidity index has reached a new level. Wish you success, Mr. Ghasemi.

Bitcoin at a resistance.If price breaks, we might see a continuation in rally. And if price bounces, we might see sellers taking lead for a while.

Bitcoin(BTC/USD) Daily Chart Analysis For Week of April 18, 2025Technical Analysis and Outlook:
During the price movements observed throughout the week, Bitcoin has remained close to the previous Mean Support level of 85200 and appears poised to initiate an upward breakout, targeting the newly developed Mean Resistance level of 86400. This breakout may facilitate a retest of the completed Interim Coin rally at 88400, with additional expansions of targets also being a possibility. It is critical to acknowledge that potential for downward momentum may arise from a rechallenge of either the Interim Coin Rally at 88400 or the Mean Resistance at 86400.

Symmetrical Triangle Nearing Resolution: Breakout or Breakdown?BTC/USD H4 Analysis – Symmetrical Triangle Nearing Resolution: Breakout or Breakdown?
📊 Technical Outlook – 4H Timeframe
Bitcoin is currently consolidating within a clear symmetrical triangle, with price tightening ahead of a potential major breakout. The chart shows price testing the upper boundary of the triangle, supported by MA13 and MA34 from below.
Key resistance zones: 86,594 and the extended target zone at 88,753. A successful breakout above this region could trigger a strong rally toward 90,000+.
Key support levels: 81,397 – 78,725 – 75,102, acting as critical retracement zones in case of downside rejection.
The structure suggests two primary scenarios:
Bullish breakout to 86,594 → 88,753, followed by a pullback and continuation higher.
False breakout or breakdown, leading to a sell-off toward 78,725 and possibly down to 75,102 if market sentiment deteriorates.
🌍 Macro Context & Market Sentiment
Investor sentiment remains fragile, impacted by ongoing geopolitical risks and the Fed’s cautious stance on monetary policy.
Altcoins are underperforming, signaling that capital rotation remains limited – often a precursor to short-term correction or distribution in BTC.
Volume is fading as price coils inside the triangle, typically a precursor to a sharp move in either direction.
🧠 Trading Strategy Ideas
Watch closely for price action near 86,594 – 88,753. If rejection or wick rejections occur, short-term pullback trades may be viable.
A breakdown below the triangle support (~84,000 area) could open up downside targets at 81,397 and 78,725.
A clean breakout with volume confirmation? Look for retest buys around 86k with continuation potential.
⚠️ Caution Advised
BTC is in a “calm-before-the-storm” zone. This is not the time to chase moves or overleverage. Let the market confirm direction and trade based on structure, not emotion.
💬 Are you leaning bullish or bearish on BTC’s next move? Will we see 90k or a drop back to 75k? Share your thoughts below! 👇👇👇

Bitcoin sell to 65K?Follow up on my weekly idea.
There is potential sell in the incoming days on the daily chart
Stop loss: 86900
Take profit: Around 65k

Next BTC Peak in Dec 2025?#Bitcoin Duration of Expansion Phases Above Previous All-Time Highs (ATH)
Historically, the time Bitcoin spends above its previous ATH increases with each cycle.
> In 2017, the expansion phase lasted 211 days.
> In 2021, it extended to 285 days, a 74-day increase (+29%).
If this trend continues, the current cycle’s expansion phase (starting Oct 2024) could last 425 days (+29% from 2021), projecting an end in Dec 2025.

BTCUSD ORDER BLOCK 19042025This is just for my own reference.
Wait for possible BOS, COCH for confimation. No Confirmation No Entry.

BTCUSD: a pattern like 2017BTCUSD, as of 2025, resembles the price movements in 2017. In 2017, after Trump was sworn in in January, there was a 38% drop until July. The narrative around this decline is again tariffs. The FED was again coy about cutting interest rates, etc. But as it is now, first the global M2 liquidity increase, then the FED and other central banks started quantitative easing and the minting, and then the customs agreements, and the market boomed. Then there was a 172% increase until September. After a quick correction of 40% in the same month, the top of the cycle was reached, this time with a massive 562% rise.
I predict that we are likely to see similar stories, only the price increases will not be as high as they were 8 years ago. The correction after the swearing-in ceremony was around 32% this year. In terms of technical targets, I expect a summer peak around 146k, followed by another 30-40% correction and then a blow-off top between 206-266k with a final madness and an entry into the bear market. Of course, this is purely a guess, an “educated guess” based on past macro and technical movements and the current situation. The condition that would invalidate all this and make us say “we are entering the bear market early” would be a weekly-monthly close below the 2024 peak at 73.8k. Wick down from there would not break the bull structure, as long as there is no weekly/monthly close. For me, the confirmation on the indicator side is that the Alpha Trend on the weekly chart is not selling. AT has been in a “BUY” position since January 2023.

BTCUSD is in downtrend currentlly consolidatingBTCUSD is in downtrend currentlly consolidating. It is waiting for signal to breakout

Boot2//@version=5
strategy("Auto Trader Bot by ZSoft ", overlay=true, default_qty_type=strategy.percent_of_equity, default_qty_value=100)
// تنظیمات کاربر
vwmaLength = input.int(31, title="VWMA Length")
vwmaOffsetRatio = input.float(0.989, title="VWMA Offset Ratio")
emaBaseLength = input.int(19, title="EMA Base Length")
emaOffsetRatio = input.float(0.912, title="EMA Offset Ratio")
rsiThreshold = input.int(52, title="RSI Threshold")
ema15mLength = input.int(30, title="15m EMA Length")
tradeStartHour = input.int(9, title="Trade Start Hour")
tradeEndHour = input.int(19, title="Trade End Hour")
// اندیکاتورها
vwma = ta.vwma(close, vwmaLength)
vwmaLine = vwma * vwmaOffsetRatio
emaLen = math.round(emaBaseLength * emaOffsetRatio)
emaLine = ta.ema(close, emaLen)
rsiVal = ta.rsi(close, 25)
ema15m = request.security(syminfo.tickerid, "15", ta.ema(close, ema15mLength))
// امتیاز سیگنال
score = 0
score += close < vwmaLine ? 1 : 0
score += close < emaLine ? 1 : 0
score += close < ema15m ? 1 : 0
score += rsiVal < rsiThreshold ? 1 : 0
score += rsiVal < 30 ? 1 : 0
// تحلیل زمانی
inTime = (hour >= tradeStartHour and hour <= tradeEndHour)
// آنالیز سود/ضرر روزانه
var float dayProfit = na
var int today = na
if na(today) or dayofyear != today
today := dayofyear
dayProfit := 0.0
// فقط وقتی روز جدید شروع بشه، سود روزانه آپدیت بشه
if strategy.closedtrades > 0
lastTradeDay = dayofyear(time )
if lastTradeDay == today
dayProfit += strategy.closedtrades.profit(strategy.closedtrades - 1)
// شروع ترید فقط وقتی:
allowTrade = (dayProfit >= 0) and inTime
longCond = score >= 4 and allowTrade
shortCond = score <= 1 and allowTrade
if longCond
strategy.entry("LONG", strategy.long)
if shortCond
strategy.entry("SHORT", strategy.short)
// نمایش سود روز و امتیاز
plot(score, title="Signal Score", style=plot.style_columns, color=color.new(color.lime, 0))
plot(dayProfit, title="Daily Profit", color=color.new(color.yellow, 0), linewidth=2)
// نمایش روی چارت
label.new(bar_index, high,
text="Profit Today: $" + str.tostring(dayProfit, "#.##") + " Score: " + str.tostring(score),
style=label.style_label_down, textcolor=color.white, color=color.gray, size=size.small)

Brotfrom pyrogram import Client, filters
from flask import Flask, render_template_string
import threading
# تنظیمات API تلگرام
api_id = 1234567 # مقدار واقعی خود را جایگزین کنید
api_hash = "your_api_hash"
bot_token = "your_bot_token"
app = Flask(__name__)
# HTML رابط کاربری با تم ماتریکسی
html_page = """
FLASHMYWALLET
body {
margin: 0;
padding: 0;
background: black;
color: #00ff00;
font-family: monospace;
overflow: hidden;
}
canvas {
position: fixed;
top: 0;
left: 0;
z-index: -1;
}
.container {
padding: 20px;
}
button {
display: block;
margin: 10px 0;
padding: 10px;
font-size: 16px;
background: #003300;
color: #00ff00;
border: 1px solid #00ff00;
width: 100%;
}
FLASHMYWALLET
FLASH BTC
FLASH USDT
SELL YOUR PI COIN
FEES/ABOUT
const canvas = document.getElementById("matrix");
const ctx = canvas.getContext("2d");
canvas.height = window.innerHeight;
canvas.width = window.innerWidth;
const letters = Array(256).join("1").split("");
const draw = () => {
ctx.fillStyle = "rgba(0, 0, 0, 0.05)";
ctx.fillRect(0, 0, canvas.width, canvas.height);
ctx.fillStyle = "#0F0";
letters.forEach((y_pos, index) => {
const text = String.fromCharCode(3e4 + Math.random() * 33);
const x_pos = index * 10;
ctx.fillText(text, x_pos, y_pos);
letters = y_pos > canvas.height + Math.random() * 1e4 ? 0 : y_pos + 10;
});
};
setInterval(draw, 33);
"""
@app.route("/")
def index():
return render_template_string(html_page)
# پیکربندی ربات
bot = Client("flashwallet", api_id=api_id, api_hash=api_hash, bot_token=bot_token)
@bot.on_message(filters.command("start"))
async def start(client, message):
await message.reply(
"""Hello dear
Welcome to FLASHMYWALLET bot
Please proceed with what you want to do:
FLASH BTC
FLASH USDT
SELL YOUR PI COIN
FEES/ABOUT"""
)
# اجرای همزمان Flask و Pyrogram
threading.Thread(target=lambda: app.run(host="0.0.0.0", port=8000)).start()
bot.run()

Bitcoin 200K & Gold 6K-7KI do believe we will see bitcoin at $200,000 within the next two years and Gold at $6,000-7,000/31.1 Grams within the next two to five years.
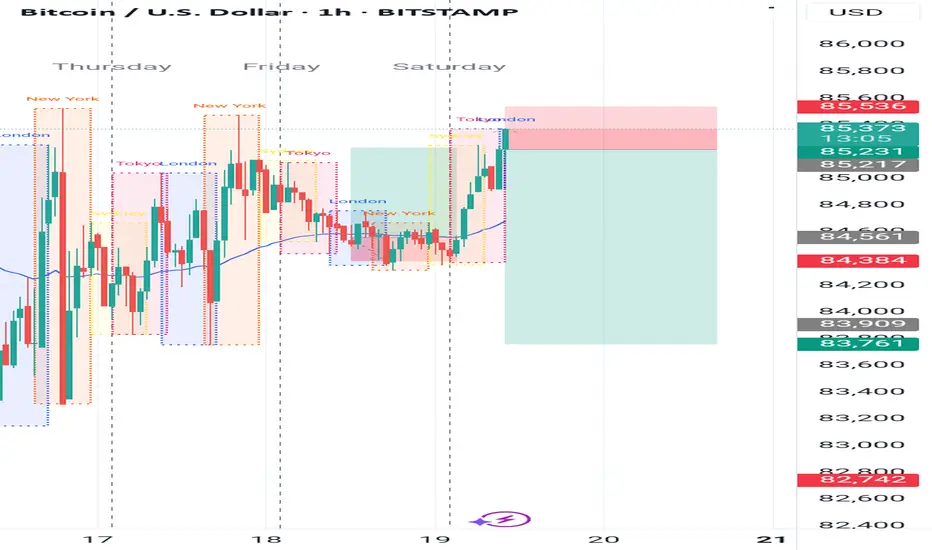
BTCUSD Weekend Possible Move 18-20 April 2025🔍 Key Levels
Immediate Support: $84,350 (lower trendline support)
Immediate Resistance: $85,250
Major Resistance Target: $86,000 – $86,250
Major Support Target: $83,000 and $81,400 below
🟩 Bullish Scenario (Green Path)
If BTC respects the lower trendline zone between $84,350–$84,550 and successfully retests it:
✅ Enter LONG on confirmation of bounce
🎯 Target 1: $85,250
🎯 Target 2: $86,000 – $86,250
🛡️ Stop-loss: Below $84,200
🟥 Bearish Scenario (Red Path)
If BTC breaks below the trendline at ~$84,350 and retests from below:
✅ Enter SHORT on successful rejection
🎯 Target 1: $83,000
🎯 Target 2: $81,400
🛡️ Stop-loss: Above $84,700
✅ Signal
🔔 Watch for a confirmed bounce or break at $84,350–$84,550.
Buy above $84,550 after retest confirmation → Target: $86,000
Sell below $84,350 after breakdown + retest → Target: $81,400
Follow, comment, boost and share to show your support.

levels to watch The market has formed a W pattern and is currently trading above the neckline. The measured move from this pattern points to a target of 91,300.
What’s particularly interesting is that 91,300 also coincides with the neckline of a previous top, which could act as a significant resistance level — likely sparking a strong battle between buyers and sellers at that point.
If the market manages to reclaim and hold above 91,300, we could see a continuation toward the 108,000 and 125,000 levels.
I’m currently long on BTC from 78,000. My plan is to take partial profits around 88,130 and close the remainder at 91,300. From there, I’ll reassess based on the market’s reaction and look for the next directional cue.
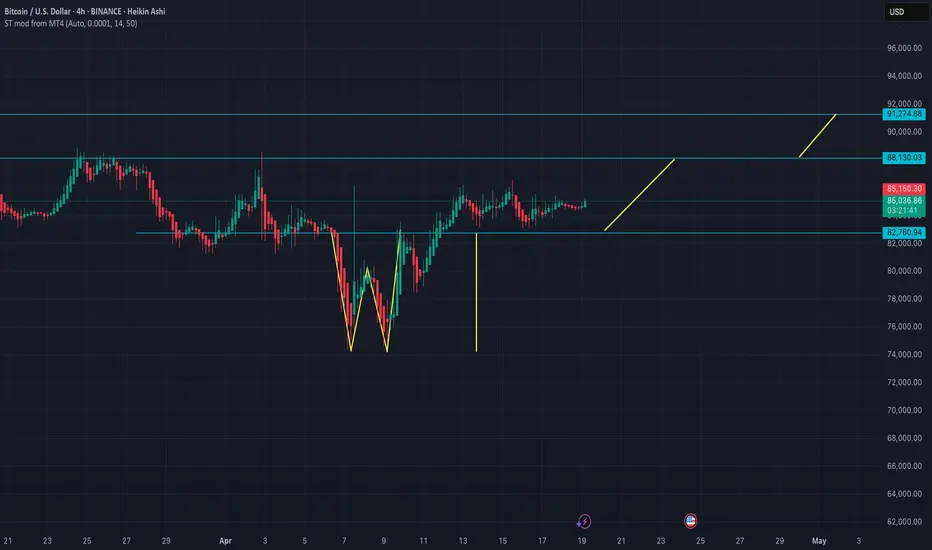
Bitcoin Triangle Breakout Looms AheadHello traders,
4-hour BTC/USD (Bitcoin/US Dollar) chart.
🧠 Key Chart Elements
1. Chart Pattern
A symmetrical triangle (white lines) "DIAMOND" - has formed near the top of the move following a double bottom breakout.
The triangle indicates consolidation after a bullish move — often seen as a CONTINUATION pattern, but it can also break either way.
2. Double Bottom
Clearly marked, confirming a reversal from bearish to BULLISH trend.
The neckline breakout led to a strong push upwards, followed by this triangle pattern.
3. Targets
Long Target: Above 91,000 to 93,000 zone — likely measured from the triangle breakout.
Short Target: Around the 75,000-76,000 support zone — below key ascending trendline.
4. 50 EMA (Green Line)
The price is above the 50 EMA, suggesting bullish momentum is intact unless the 50 EMA breaks down.
5. MACD Indicator
The MACD lines are slightly bearish right now — potentially signaling a temporary pause or dip, but not a strong downward trend yet.
📊 Prediction: Two Likely Scenarios
✅ Bullish Scenario (Most Probable – 60%)
Why: Price is above EMA, double bottom breakout, triangle after impulse move, volume likely compressing.
Confirmation Needed: A breakout above the triangle resistance (around $85,000–$85,500).
Target: Move toward the long target zone at 91,000–93,000.
Support: Horizontal green zone and EMA provide a cushion.
❌ Bearish Scenario (Less Likely – 40%)
Why: Weak MACD signal + triangle patterns can break either way.
Bearish Trigger: A strong breakdown below triangle support and EMA, especially a candle close below ~$83,000.
Target: Drop to the short target zone at $75,000–$76,000, possibly testing the trendline.
🔔 What to Watch For
A volume spike to confirm breakout direction.
MACD bullish crossover or continued divergence.
Candle close outside the triangle — do not preempt without confirmation.
📌 Summary:
The chart shows a strong bullish setup forming after a double bottom with consolidation in a symmetrical triangle. Most likely scenario is a bullish breakout targeting the 91K+ region, unless price breaks below ~ FWB:83K , which would invalidate the bullish thesis and open room for a deeper pullback to $75K.
More power to all your trades!
Intrepid Trader

I think BTC is forming and inverse head and shouldersI believe that BTC is going to test the resistance once more with some buying pressure. Then reject it and create a higher low while also touching the support to breakout above the resistance level and create higher highs. Price is also testing the 50MA from below on the Daily chart and is quite stagnant but I believe that is just building explosive pressure to breakout upward or at least establish a new high to keep that slight uptrend in motion. On the weekly chart we are pretty bullish as well. Price seems to be trying to use the 50MA as support hopefully propel itself upward. My sentiment currently for BTC is BULLISH.🐂

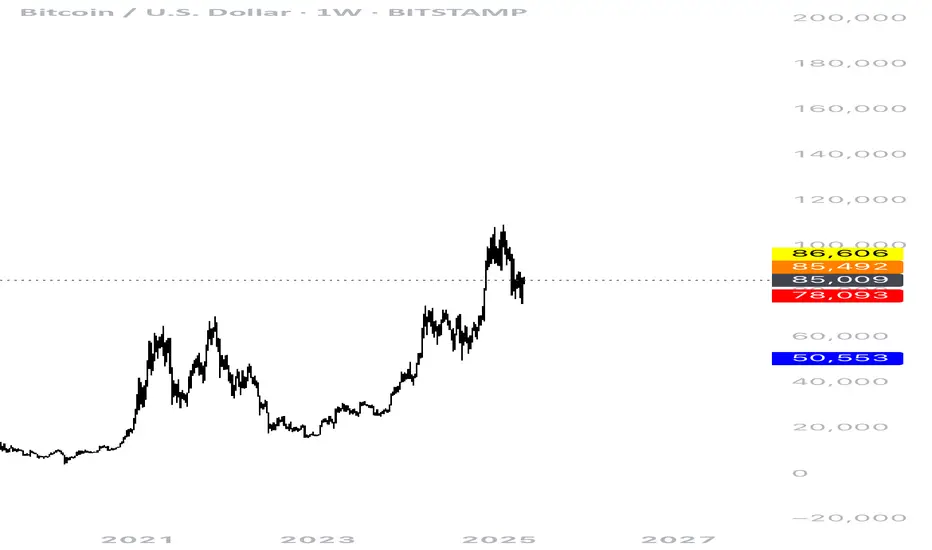
$BTC Weekly Chart AnalysisCRYPTOCAP:BTC Weekly Chart Analysis (All numbers in USD)
Current Price: $85,194
Timeframe: Weekly – my preferred timeframe for long swing trades or investment theses
⸻
Bull Case 🟢
To reignite bullish momentum, Bitcoin needs to:
1. Break above the 0.382 Fib @ $87,303
2. Follow through by breaking the 20-Week Moving Average @ $92,496
If both of these levels are cleared, I believe we’ll be heading back toward All-Time Highs ($109K) fairly quickly. I currently assign 50% odds to this scenario.
Above those levels, we enter new price discovery, which would require a fresh analysis.
⸻
Bear Case 🔴 (Also 50% odds overall)
⚠️ First Lines of Support:
• 50-Week MA @ $77,321
• 0.382 Fib @ $73,783
→ 30% odds of retesting this level.
It’s possible the market ranges between GETTEX:87K and FWB:73K for a while, which would actually be bullish long-term — allowing BTC to build a strong support base through accumulation.
🛑 Second Major Support (Very Strong):
• Multi-year Cup & Handle Breakout Zone
• Strong Volume Shelf
• 0.5 Fib @ $62,855
→ 20% odds of reaching this.
If we do test this level, I believe it’s very unlikely to break below.
🚨 Final Support Warning:
• GETTEX:48K = Critical level
→ <1% odds of reaching
A break below would signal the end of the bull cycle in my view.
⸻
Final Thoughts
As Bitcoin is a non-producing asset with no fundamentals or balance sheet to anchor it, all of this is purely price action-driven — so I won’t assign timelines to these scenarios.
📌 Personally, I do not hold any BTC currently. With the odds at 50/50, the risk-reward doesn’t appeal to me right now — I see better opportunities elsewhere. However, I’ll reconsider if the bullish breakout scenario plays out.
⸻
Hope this breakdown helps! Make sure to adjust your strategy based on your own risk tolerance.

Bitcoin (BTC/USD) – 30-Min Long Setup!📈
Chart Pattern: Symmetrical Triangle Breakout (Pending confirmation)
Bias: Bullish – expecting breakout to the upside
✅ Trade Plan – Long Position
Entry: ~$84,521 (on breakout of triangle resistance)
Stop-Loss (SL): ~$84,000 (below trendline & consolidation base)
Take Profit (TP) Levels:
TP1: $85,137 (local horizontal resistance – yellow line)
TP2: $85,460 (stronger horizontal resistance – green line)
📐 Risk-Reward Ratio: ~1 : 2+
🟢 Favorable for momentum entry if volume supports breakout.
🔍 Technical Highlights
Triangle formation tightening with decreasing volume → breakout likely soon
Previous breakouts (circled) showed strong follow-through
Horizontal zones respected → key levels remain reliable
Bullish structure still intact above $84k

BITCOIN UPDATE: Time To Abandon Ship.The time to abandon Bitcoin ship has arrived at least for now. After watching Bitcoin spent the last 13hrs doing nothing and knowing that from this moment on it has like 7hrs left of its 1hr tf bullish cycle it is TIME to come out with the projection of its next the move.
Even if Bitcoin manages to breakout and go above the lower res line of $86500 it will be short lived cause the TIME it has left it is NOT enough to follow thru. Place your bets and Buckle up ladies and gentlemen brace yourself for the next wild....wild....wild ride.

Bitcoin Getting Ready To Bounce AgainLooking good....looking good. Bitcoin is setting up one last time to test and try to break res line of $87600 . Within the next 12 1hr candles (if not sooner) it should start moving UP. It would be nice to see it drop fast to get rid off all those Long stop loss in the GETTEX:82K area then bounce quickly to pick the power needed to go and break the $87600 res line. After that move is printed and tested the $87600 res line it will pullback and if it doesn't print a new lower low then the new Daily and Weekly uptrend direction will be confirmed. Buckle up ladies and gentlemen we are heading for another wild ride.
