BTC Bears about to get liquidA continuation of distribution is still in play for bitcoin and the alt market.
Maybe a few more days of bleeding but not much lower from here.
Currently in SOW Phase B (Sign of Weakness in Phase B) v
d.stockcharts.com
Looking to see a quick turn around from this zone to the upside.
Target : $130,000
BULLUSD trade ideas

Bull TIMEThe image is a Bitcoin (BTC/USD) price chart from TradingView, dated April 7, 2025. It shows the price movement of Bitcoin over several months, with key levels and potential trends indicated. Here's a breakdown:
Current Price: $77,837
Timeframe: November 2024 to May 2025
Key Levels:
Resistance around $109,356
Support around $77,385

BTC/USD Long Setup – Bullish Reversal PlayAfter a sharp drop, BTC is testing a key liquidity zone around 78.2k. The market structure suggests a potential bullish reversal, with a fakeout and recovery in sight.
📌 Trade Idea:
Entry: After confirmation of a reclaim and bullish structure break (above ~79.3k)
SL: Below recent low ~77.6k
TP: 82.8k zone
RRR: ~3.2
📅 Timeframe: 30min
📈 Bias: Counter-trend long
🔁 Watch for: Price reaction at current support and market structure shift
🚨 Wait for confirmation – patience is key in volatile conditions!

Bitcon On Track For 73.3K - Daily BreakdownBy now it's fairly obvious we've entered a bearish market. From a peak of 109k to now 82k this is hard to argue. We can view our earning moving average data with the red(10day), blue(20day), and yellow(50day) to see the candles are well below all levels. The most important level on the bearish confirmation is the 50 day EMA cross. This is known as a 'death cross'. When price crosses below the 50 day EMA price historically will continue to decline.
Our second major confirmation to enter short is by looking at lower Support zones for price. Looking at price to the left there are long periods from 73.3k to 87k where price action took off very rapidly with zero consolidation.(side ways market action). This means when price comes back down as it is there are zero support levels(as in the orange box) until 73.3k.
73.3k was previously a resistance level(where price did not go above) four times as in circled. These levels will now become a support zone for buying liquidity.
I do believe this bearish market will be much different than previous years. It will be a much more drawn out process with less typical overall volatility. This is due to the increase in the market cap is much higher than before. That being said the major confirmations based upon EMA data and zero support levels make this overall trend very clear.
Don't be stupid NEVER trade against the trend! Do not except price to snap to target over night either. This is a daily view on the overall direction of BTC and is not a short term trade. We should except price to decrease overall, but remember the market increase and decrease in 'waves'.

Mooooooooooon! This capitulation period could be the end of a bearish butterfly / failed break of the range low.
If it is, then it'll be uppy from here.
Very tight tolerance for stops here. If this fails it could be absolutely horrific. But markets have what I suspect to be wash out low properties.
I'll try one more batch of longs and if they don't work write that off as misadventure.
Best chance of a bigger rally to date so far in BTC now I think.

Bitcoin Grafico 1-Hora.📌 *Disclaimer:*
Trading and investing in cryptocurrencies carries risks. This channel is for educational purposes only and does not offer financial advice. Any decisions you make are at your own risk.

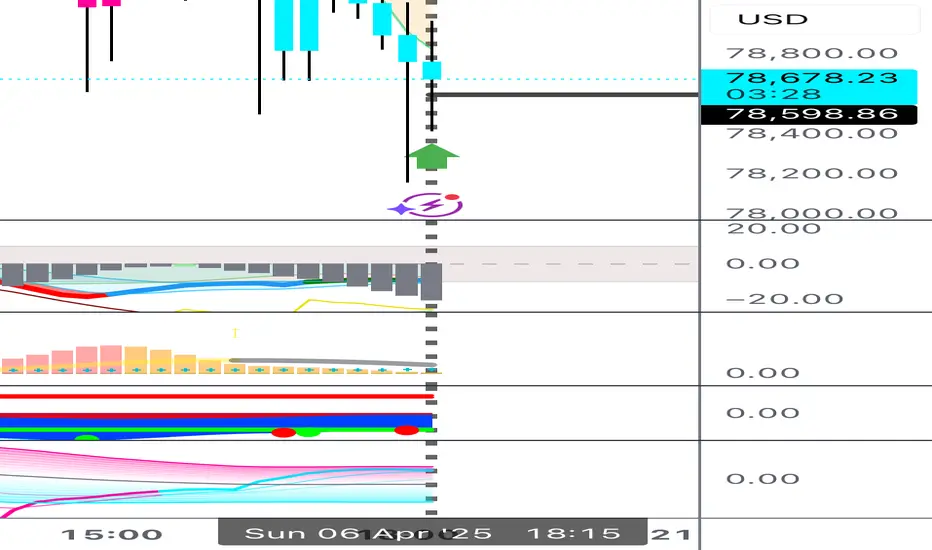
Bitcoin buy 78630Bitcoin declined to test support around 78500 on daily time frames
On 15 min at the same time long tail and indicators swing up
Buy 78500 with tp 79800 and 81200
Stop loss below 78100
Bitcoin Outlook Amid Uncertainty and Mempool Congestion
This chart captures the current critical juncture for Bitcoin as it tests the 0.618 Fibonacci retracement level (~$74,277), a zone historically associated with trend reversals. The bounce or breakdown from this region may shape the mid-term trajectory.
The recent drawdown is not happening in a vacuum. Global macroeconomic turbulence including increasing U.S. tariffs, rising bond yields, and parallels to the 1985 Plaza Accord suggests deeper structural fragility. If history rhymes, we may be staring at the early tremors of a broader economic reset, possibly invoking a modern black swan event.
Technically, if support holds, Bitcoin may attempt a retracement back to the 0.5 or 0.382 levels (~$81,000–$87,000), but failure to defend this zone could open the door to the 0.786 retracement at $64,753 or worse, the full retrace to $52,622.
Compounding the uncertainty, network congestion continues to pressure transaction times and fees, especially during volatility spikes. Traders and institutions seeking faster confirmation may benefit from acceleration services to avoid critical delays during times of stress.
To help mitigate transaction bottlenecks during peak periods, a BTC accelerator Like fujn.com offers a Bitcoin transaction accelerator service for users who need faster confirmation times. This becomes especially valuable during mempool congestion, which often spikes alongside macro-driven volatility and sell-offs.
As technicals and fundamentals intertwine, keep an eye on both the chart and the mempool.

btc short everytime a rally comes before mayafter May this year shorts will become more risky as btc might make a comeback due to global liquidity and quantitative easing. until then april is boring, pointing more to the downside


#202514 - priceactiontds - weekly update - bitcoinGood Evening and I hope you are well.
#btcusd - bitcoin
comment: The move I was writing and have been expecting for multiple weeks started today and 75k is the target. I won’t repeat all of it. Chart is clear and now it’s on bears to make meaningful lower lows. Below 70k you will likely see some panic.
current market cycle: bear trend
key levels: 70k - 90k
bull case: Bulls tried and failed under 90000. Now their last hope is to keep it above 75000 or risk going down to 70000 or below. I absolutely have nothing for them besides praying that 75000 holds.
Invalidation is below 70k.
bear case: Bears have all the arguments now and the chart is clear as day. Would not be the first time a market would do the opposite of what’s expected but you will not make money in the long run if you only bet on the low probability things happen. Maybe you can but you have to be S-Tier trader amongst traders. Much easier to follow the trend here. 75000 was my big target and I hope we crash to 69000.
Invalidation is above 90k.
short term: Full bear for 75000 or lower.
medium-long term - Update from 2025-02-23: 75000 is still my biggest target for 2025. It’s happening. 70k/75k and then I expect a bigger bounce first. Then we will see if we can go lower or not. For now it’s very low probability that the big bull trend line from 2023-10 breaks anytime soon.
current swing trade: Short since 85000. Stop is 89000 no matter where you go short.
chart update: Removed one minor broken bear trend line.

BTC Weekly & Daily Support/ResistanceThis is the BTC weekly & daily charts showing support & resistance levels using pivots, moving averages, & Fibonacci Retracement levels.

Bitcoin: 76K Test Watch For Reversal.Bitcoin has broken the 81,500 minor support and is now in the process of testing the recent swing low 78K to 76K AREA. With the lower high structure at the 88K area (see arrow) in place, a lower low is likely to follow in the coming week. The question is how much lower? One reasonable estimate is a test of 73K (the previous all time high before November). The current area between 79 and 76K does present a buying opportunity on multiple time horizons (investment, swing trades, day trades) but the key to timing this WAITING for confirmation.
From the investing perspective, this is an attractive low because this may establish a reversal formation (double bottom) which may be the bottom of Wave 4. IF this turns out to be true, Wave 5 can potentially begin here. Price can probe as far as 64K before overlapping with Wave 1 of this impulse. Stepping into this our placing a limit order at a lower price is reasonable, but managing risk on this time horizon has a lot to do with your sizing strategy (I have explained this on many streams). Keep in mind price can BREAK and test 73K or lower and you must consider that possibility into your sizing strategy.
As far as swing trades, its the same idea except this is where a defined risk (stop) and profit objective has to be assigned (Trade Scanner Pro shines here). While the level is ideal for a double bottom or failed low (see illustration), there is NO confirmation. So it is still highly risky to step into this, especially in light of the stock market situation, etc. Wait for a bullish pin bar, engulfing candle, etc. You can define risk from there and utilize at least a 2:1 or greater profit objective.
For day trades, its the same process just on smaller time frames, (1 min to 15 min). Just on the day trade time frame, at this time, SHORTS can still be attractive on minor retracements because momentum on these time frames is CLEARLY bearish. If 79K breaks, there is a greater chance momentum continues toward the 76K AREA low.
I realize there must be some news catalyst in play to spark such a move. DO NOT react to the news, this is often a mistake. It doesn't matter what it is because this is a game of recognizing herd mentality behavior and identifying potential opportunities in this context. You want to anticipate an inflection point, WAIT for price behavior to confirm. At that point you can identify risk, and profit expectations. THIS is a MORE objective process compared to "thinking" you know how the news will affect a market. Keep decision making as simple as the "IF this, then that" framework which gives you a more accurate view of market intent since it encourages a more passive view rather than asserting your own irrelevant opinions.
Thank you for considering my analysis and perspective.

Up again, or will preload tomorrow morning's dump?Right at support in this downward channel; will we break thru before tomorrow morning's planned dump or is this another little bear trap?
Can't wait to hear what my followers have to say.

#BTC/USD ANALYSIS. (BULLISH)Bitcoin Price Action Analysis. The Next Big Move?
Bitcoin is moving within an ascending channel, showing strong bullish momentum! However, a key decision point is approaching as the price nears a critical support zone (highlighted in blue). If BTC holds above this level, we could see a strong push towards the $91,500 resistance and potentially break into the $94,700 range.
A well structured risk-to-reward setup is in play, with a potential bullish breakout targeting new highs. Will BTC sustain its momentum, or will we see a retracement before the next leg up? Stay sharp and trade wisely! We will execute our trades only after receiving bullish confirmation.
Use proper stoploss and proper money management.
This is just my analysis. Observe the behavior of price how it will react.
#BTCUSD 2H Technical Analysis Expected Move.

Bitcoin Bullish Idea I'll be buying for that point of interest 78544.71 if I see confirmation for reversal. Though H8 zone 79100.20 looks valid too as the price has triggered it and rejects it awesomely.
My projection is this new week is going to be Bullish not just for Bitcoin but some other. Crypto pairs too.
I'm bullish on Eth as well.
Kindly boost if you find this insightful 🫴

Bitcoin's Fork in the Road: Key Levels to WatchBitcoin is currently in a short-term downtrend, showing some weakness. Last week, the price traded within a tight range, sparking hope for an upward shift. However, Bitcoin remains below the 200-day moving average (200MA), which is still a significant hurdle for any bullish momentum to gain strength.
Key support levels to watch are at $77K and $74K. If Bitcoin drops below $77K and breaks through the $74K level, it could signal a deeper decline, possibly testing the 46K mark. Until Bitcoin can reclaim the 200MA and hold above key support levels, the market sentiment will likely stay cautious.

Bitcoin Fibonacci levels from the 2022 low.This is what I am seeing. 68,500 is the bottom of channel support. The Fib retracements are a pretty big deal if you want to know where support lies.


TC/USD Bearish Flag Breakdown Targeting 81,660 Support ZoneThis is a 1-hour BTC/USD (Bitcoin/US Dollar) chart showing a bearish setup. Here's the breakdown:
---
Key Observations:
1. Bearish Rejection Zone (Purple Box - ~83,174.62):
Price is showing rejection at a key resistance zone.
Both the 30 EMA and 200 EMA are above current price, adding downward pressure.
2. EMA Analysis:
30 EMA (Red Line): ~83,174.62 – acting as dynamic resistance.
200 EMA (Blue Line): ~83,715.92 – strong long-term resistance.
Price is below both EMAs, reinforcing bearish sentiment.
3. Pattern Analysis:
Bearish flag/wedge breakdown has already occurred.
Target projection based on measured move suggests a ~1.44% downside.
Anticipated drop towards 81,660.29, which aligns with prior support zone.
4. Price Action:
Recent breakdown from a small rising channel (bear flag).
Pullback to resistance (purple zone) seems complete, and continuation downward is expected.
---
Strategy Summary:
Bias: Bearish
Entry Zone: Near 83,174.62 (already rejected)
Target: 81,660.29
Stop Loss Idea: Above 83,715.92 (EMA 200)

69K incoming for BTC, XRP around 1.5-1.55usd69K working like a magnet, Buy there, After that, are we in a bear market or will we get one more cycle up? for BTC i expect a maximum of 120K by October 2025, XRP could, if alt season starts land between 5 and 10usd! to be determined on the next low,

BTC looking for liquidity in 69,000Here’s the translation to English:
Next week, a sell-off is expected if we follow our continuous pattern analysis and candlestick reading.
From what we can see, the next candle that will form next week is likely to be bearish, and it will help us identify our entry point for a buy position.
The fourth candle will give us more confirmation and confidence to take the trade, as it is expected that this fourth candle may close with indecision (Doji Candle).
