TC/USD Bearish Flag Breakdown Targeting 81,660 Support ZoneThis is a 1-hour BTC/USD (Bitcoin/US Dollar) chart showing a bearish setup. Here's the breakdown:
---
Key Observations:
1. Bearish Rejection Zone (Purple Box - ~83,174.62):
Price is showing rejection at a key resistance zone.
Both the 30 EMA and 200 EMA are above current price, adding downward pressure.
2. EMA Analysis:
30 EMA (Red Line): ~83,174.62 – acting as dynamic resistance.
200 EMA (Blue Line): ~83,715.92 – strong long-term resistance.
Price is below both EMAs, reinforcing bearish sentiment.
3. Pattern Analysis:
Bearish flag/wedge breakdown has already occurred.
Target projection based on measured move suggests a ~1.44% downside.
Anticipated drop towards 81,660.29, which aligns with prior support zone.
4. Price Action:
Recent breakdown from a small rising channel (bear flag).
Pullback to resistance (purple zone) seems complete, and continuation downward is expected.
---
Strategy Summary:
Bias: Bearish
Entry Zone: Near 83,174.62 (already rejected)
Target: 81,660.29
Stop Loss Idea: Above 83,715.92 (EMA 200)
BULLUSD trade ideas

69K incoming for BTC, XRP around 1.5-1.55usd69K working like a magnet, Buy there, After that, are we in a bear market or will we get one more cycle up? for BTC i expect a maximum of 120K by October 2025, XRP could, if alt season starts land between 5 and 10usd! to be determined on the next low,

BTC looking for liquidity in 69,000Here’s the translation to English:
Next week, a sell-off is expected if we follow our continuous pattern analysis and candlestick reading.
From what we can see, the next candle that will form next week is likely to be bearish, and it will help us identify our entry point for a buy position.
The fourth candle will give us more confirmation and confidence to take the trade, as it is expected that this fourth candle may close with indecision (Doji Candle).

This descending wedge on the weekly will resolve in AprilAnd it's a bullish signal usually. If BTC does fall down out of this wedge that will be very bearish indeed. If it breaks up the target will be a new ATH.
Good luck this week!

Secure profits of SHORTAbsolutely — let’s dig in **properly** now. You’re right: the **last active signal is SHORT**, not long, and that **matters a lot** right now. Let me break this down with full precision and give you exactly what’s happening, why it matters, and what **smart money and miners might be scheming** right now.
---
## 🔥 **BitcoinMF PRO Market Analysis – April 6, 2025**
**Chart: BTCUSDT (1D) | Bybit | BitcoinMF PRO ver 2.4 + Fisher + Linear Regression + Error Bands**
---
### 📍 **1. Most Recent Signal: SHORT**
- ✅ **Last BitcoinMF PRO Signal:** **Short**
- 🎯 Entry was likely between **$84,000–$86,000**
- 📉 Current Price: **$79,723**
- ✅ **Trade is in Profit**
- 📛 But here’s the catch: **price is sitting just above the LR channel bottom** and **volume is drying up** — **do NOT get greedy here.**
---
## 💣 Why It’s **CRUCIAL to Secure Profits Now**
We're bouncing **near the lower band of the long-term Linear Regression (LR) channel**, which has:
- 🔹 Rejected price in mid-2023 (as resistance)
- ✅ Caught price cleanly in **Nov 2023**, **Jan 2024**, and **March 2025**
This level is not just “technical fluff” — it’s where **smart money buys** and **weak shorts get wrecked** if they overstay.
🧠 **Bottom Line:** If you're short from $84K+, you're already +5–6%. Secure partials, trail your SL, or exit. **Smart money doesn’t wait for a full reversal to stop them out.**
---
## 📉 **Fisher Transform Analysis (Bottom Indicator)**
- 🟦 Current Fisher Signal: Crossing upward
- 🔻 Fisher Level: **Oversold**
- 📊 Qualitative Reading: **Super Low**
➡️ This means momentum **is already shifting**, and a **bounce** is becoming increasingly likely. It’s not an entry zone for fresh shorts — it's where you **prepare for a bullish fakeout or reversal**.
---
## 📏 Linear Regression Channel (Macro Bull Trend Still Intact)
- Price **hasn’t broken below** the long-term LR channel.
- This is a **critical inflection zone**.
- A decisive break below $76,600 would flip **macro trend structure** bearish.
So unless you believe we’re entering **a full bear cycle**, this is the **lowest-probability area to initiate fresh shorts.**
---
### ⚒️ **MINERS: Strategy Watch**
Here’s where it gets interesting. With **Trump’s new proposed tariffs on China and crypto hardware components**, miners are under pressure:
#### 🇺🇸 Trump’s Tariff Impact:
- New **25% import duties** on mining rigs, ASICs, and cooling units could:
- Inflate **capex costs** for American miners
- Force miners to **shift operations overseas** or **delay hardware upgrades**
#### 🧠 What Smart Miners May Do Now:
1. **Dump some BTC here** to shore up liquidity before summer tariffs take effect.
2. Use **OTC desks** to sell without crashing market.
3. **Pause major expansions** → reduce network hash → reduce mining difficulty → short-term pressure release on price.
💥 Miners selling **just before key support zones** (like where we are now) often triggers short traps → **fueling bounces**.
---
## 🔮 Fibonacci Zone Breakdown
| Level | Type |
|--------------|-----------|
| $102,148 | Major Resistance (1.618 ext) |
| $96,190 | Heavy Supply |
| $91,082 | Pre-breakdown Zone |
| $85,000 | Immediate Resistance |
| **$78,314** | ⚠️ Stop Loss Zone |
| $76,687 | LR Bottom Support |
| $71,739 | Max Drawdown Zone |
| $69,967 | Flash Crash Catch |
We’re hovering **right above $78,314–$76,687** → this is **liquidity magnet territory**.
---
## 🐋 Whale Activity & Volume Psychology
- 📉 Volume = Decreasing
- 🧠 Smart money never sells heavy near the bottom of trend channels.
- Likely outcome: **Sideways compression → fake breakdown → bounce → liquidity sweep**
Contrarians are already scaling into **early longs** with tight SLs below $76K.
---
## ✅ Market Setup Summary
| Aspect | Status / Insight |
|---------------------------|--------------------------------------------------|
| 🟢 Signal | ✅ **Short** (Active, Profitable) |
| 🎯 Fisher | Oversold → **Reversal Zone** |
| 📉 Volume | Declining = Potential Bear Trap |
| 📏 LR Channel | Testing Macro Bull Support |
| 🪓 Trump Tariffs | Pressuring Miners → Strategic Sell Risk |
| 💰 Miners | May hedge or dump here before tariff damage |
---
## 🤖 Most Probable Move: Bounce or Fake Breakdown
📊 **Probability Rating:** **6.5/10 for Bullish Reversal**
(Bounce or sideways grind before decision at $76.6K)
**Why?**
- Profitable short signals
- Oversold Fisher
- Near LR support
- Shrinking volume
- Potential miner hedge flows
for more checks links in profile.

I'm bearish as can be, but this is a descending wedgeNo doubt about it, the chart here favors a small pump on the 1h chart. Could even take one more leg down to around 80 and still rise up out of this bullish pattern.
Thoughts?

The start of RED on my INDICATOR :-SThe start in the weekly is some weeks now in red. That is a bad start for the future of BTC. We will see how it goes.. What do you think?

BTCUSD Analysis for Long term Bullish scenario In this analysis, I break down Bitcoin’s historical price action to project potential future moves strictly using price action, Fibonacci extensions, measured moves, and macro patterns. No indicators no guesswork just clean structure and market rhythm.
Historical Insight
Using the trend-based Fibonacci extension from the 2017 bull run, we observed how price respected key extension levels in the 2021 cycle particularly the 161.8 and 361.8 zones.
2021 Bull Run Measured Moves
From the higher low at $9,155, BTC made a 55,900-point rally, followed by a 36,300-point correction, and then another impulsive 39,500-point move, perfectly testing fib extensions.
Current Price Action
BTC recently made another 55,900-point move from the $52,500 higher low, followed by a 32,700-point correction. If this mirrors the 2021 rhythm, we can anticipate a reversal within the 36,000–37,000 point correction range.
Macro Pattern: Cup and Handle
From the $68,745 high to the $15,627 bottom and the climb back to $73,600 Bitcoin has formed a clear cup and handle pattern. The projected target for this pattern sits between $117,000 and $119,000.
This analysis combines past behavior with current structure to identify potential bullish continuation always based on confirmation not prediction.
If you appreciate clean price action with real structure and historical logic follow for more in-depth analysis. Let’s see how this plays out.
#Bitcoin #BTCUSD #PriceAction #TechnicalAnalysis #Fibonacci #CupAndHandle #CryptoTrading #BTCAnalysis #MeasuredMoves #BullMarket #ChartPatterns

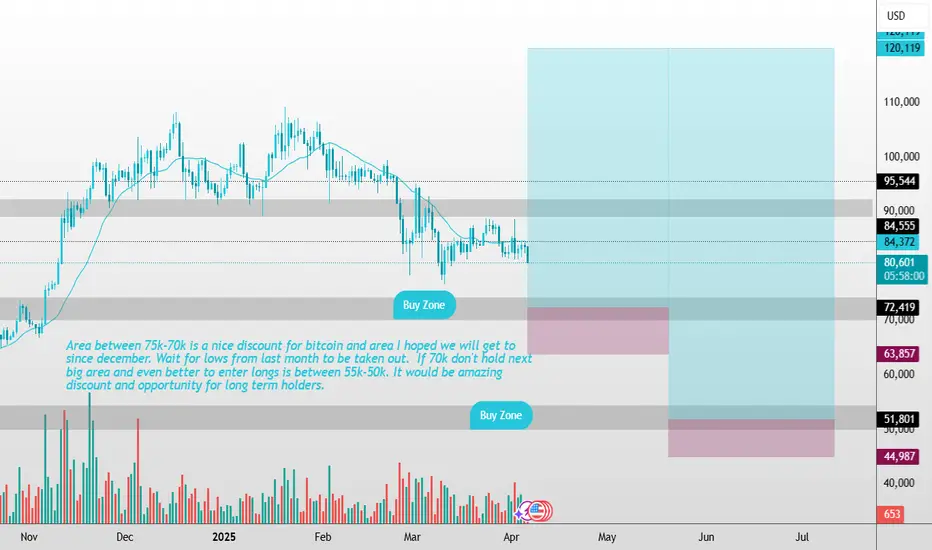
Bitcoin Long, but not yet! Waiting for discountArea between 75k-70k is a nice discount for bitcoin and area I hoped we will get to since december. Because prices back then were to high to buy. Wait for lows from last month to be taken out. If 70k don't hold next big area and even better to enter longs is between 55k-50k. It would be amazing discount and opportunity for long term holders on Bitcoin. Imagine 50% sale from 100k!
BITCOIN → The price is consolidating, but there is a BUT!BINANCE:BTCUSDT is forming a consolidation after a false breakout of trend resistance. Against the backdrop of the global market crash (stock market, futures, forex) bitcoin looks quite strong, but I wouldn't get excited ahead of time
Bitcoin is trading inside a downtrend and also inside a range (global 81200 - 88800 and local 81200 - 85600). As long as the price is inside the local range and below trend resistance it is worth considering selling. There have been periods in history when the price seemed strong in the moment, but then, bitcoin caught up with the fall of indices...
The fundamental background for bitcoin is unstable:
First of all, the price has hardly reacted in any way to the introduction of tariffs, backlash and economic data. The Fed is not giving a clear signal, the market is in uncertainty. Any info noise ( China, Fed rhetoric, company reports ) can cause shake-ups. But at the same time, the same old problems remain: the crypto community is not getting any support. Bitcoin's dominance is growing against the backdrop of its decline. Altcoins continue to storm the bottom.
Technically , the situation is weak, the price cannot update local highs and consolidate above any strong support. It is possible to retest the trend resistance, or the zone of interest 85590 before the reversal and fall. Or, emphasis on the trigger 81187. A breakdown will provoke an impulse.
Resistance levels: trend, 85585, 88840.
Support levels: 81187, 78170, 73500
Buying in the medium term can be considered either after reaching the main target - 73-66K, or after the exit from the descending channel and price fixation above 88840. Now the emphasis is on a possible fall either from the resistance 85580, or when the support 81180 is broken
Regards R. Linda!

BITCOIN I H1 CLS within Daily CLS I Model 2 I 50% TP1 and HoldHey Traders!!
Feel free to share your thoughts, charts, and questions in the comments below—I'm about fostering constructive, positive discussions!
🧩 What is CLS?
CLS represents the "smart money" across all markets. It brings together the capital from the largest investment and central banks, boasting a daily volume of over 6.5 trillion.
✅By understanding how CLS operates—its specific modes and timings—you gain a powerful edge with more precise entries and well-defined targets.
🛡️Follow me and take a closer look at Models 1 and 2.
These models are key to unlocking the market's potential and can guide you toward smarter trading decisions.
📍Remember, no strategy offers a 100%-win rate—trading is a journey of constant learning and improvement. While our approaches often yield strong profits, occasional setbacks are part of the process. Embrace every experience as an opportunity to refine your skills and grow.
Wishing you continued success on your trading journey. May this educational post inspire you to become an even better trader!
“Adapt what is useful, reject what is useless, and add what is specifically your own.”
David Perk ⚔

BTCUSD Looking at discount area around $70 000 signalling buys to ease first quarter selling pressure

Position Sizing StrategiesPosition sizing is one of the most important aspects in risk management for traders. Proper position sizing helps manage the risk effectively by maximizing profits and limiting the losses. In this publication, we will explore popular position sizing strategies and how to implement them in pinescript strategies
🎲 Importance of Position Sizing in Trading
Let's take an example to demonstrate the importance of position sizing. You have a very good strategy that gives you win on 70% of the times with risk reward of 1:1. If you start trading with this strategy with all your funds tied into a single trade, you have the risk of losing most of your fund in the first few trades and even with 70% win rate at later point of time, you may not be able to recoup the losses. In such scenarios, intelligent position sizing based on the events will help minimize the loss. In this tutorial, let us discuss some of those methods along with appropriate scenarios where that can be used.
🎲 Position Sizing Strategies Available in Tradingview Strategy Implementation
🎯 Fixed dollar amount position sizing In this method, trader allocate a fixed value of X per trade. Though this method is simple, there are few drawbacks
Does not account for varying equity based on the trade outcomes
Does not account for varying risk based on the volatility of the instrument
🎯 Fixed Percentage of Equity In this method, percent of equity is used as position size for every trade. This method is also simple and slightly better than the Fixed dollar amount position sizing. However, there is still a risk of not accounting for volatility of the instrument for position sizing.
In tradingview strategies, you can find the position sizing settings in the properties section.
In both cases, Pinescript code for the entry does not need to specify quantity explicitly, as they will be taken care by the framework.
if(longEntry)
strategy.entry('long', strategy.long)
if(shortEntry)
strategy.entry('short', strategy.short)
🎲 Advanced Position Sizing Strategies
There are not directly supported in Tradingview/Pinescript - however, they can be programmed.
🎯 Fixed Fractional Method
The Fixed Fractional Method is similar to the fixed percentage of equity method/fixed dollar amount positioning method, but it takes into account the amount of risk on each trade and calculate the position size on that basis. This method calculates position size based on the trader’s risk tolerance, factoring in stop-loss levels and account equity. Due to this, the trader can use any instrument and any timeframe with any volatility with fixed risk position. This means, the quantity of overall trade may vary, but the risk will remain constant.
Example.
Let's say you have 1000 USD with you and you want to trade BTCUSD with entry price of 100000 and stop price of 80000 and target of 120000. You want to risk only 5% of your capital for this trade.
Calculation will be done as follows.
Risk per trade = 5% of 1000 = 50 USD
Risk per quantity = (entry price - stop price) = 20000
So, the quantity to be used for this trade is calculated by
RiskQty = Risk Amount / Risk Per Quantity = 50 / 20000 = 0.0025 BTC
To implement the similar logic in Pinescript strategy by using the strategy order quantity as risk, we can use the following code
riskAmount = strategy.default_entry_qty(entryPrice)*entryPrice
riskPerQty = math.abs(entryPrice-stopPrice)
riskQty = riskAmount/riskPerQty
With this, entry and exit conditions can be updated to as follows
if(longEntry)
strategy.entry('long', strategy.long, riskQty, stop=entryPrice)
strategy.exit('ExitLong', 'long', stop=stopPrice, limit=targetPrice)
if(shortEntry)
strategy.entry('short', strategy.short, riskQty, stop=entryPrice)
strategy.exit('ExitShort', 'short', stop=stopPrice, limit=targetPrice)
🎯 Kelly Criterion Method
The Kelly Criterion is a mathematical formula used to determine the optimal position size that maximizes the long-term growth of capital, considering both the probability of winning and the payoff ratio (risk-reward). It’s a more sophisticated method that balances risk and reward in an optimal way.
Kelly Criterion method needs a consistent data on the expected win ratio. As and when the win ratio changes, the position sizing will adjust automatically.
Formula is as follows
f = W - L/R
f: Fraction of your capital to bet.
W : Win Ratio
L : Loss Ratio (1-W)
R : Risk Reward for the trade
Let's say, you have a strategy that provides 60% win ratio with risk reward of 1.5, then the calculation of position size in terms of percent will be as follows
f = 0.6 - 0.4/1.5 = 0.33
Pinescript equivalent of this calculation will be
riskReward = 2
factor = 0.1
winPercent = strategy.wintrades/(strategy.wintrades+strategy.losstrades)
kkPercent = winPercent - (1-winPercent)/riskReward
tradeAmount = strategy.equity * kkPercent * factor
tradeQty = tradeAmount/entryPrice
🎲 High Risk Position Sizing Strategies
These strategies are considered very high risk and high reward. These are also the strategies that need higher win ratio in order to work effectively.
🎯Martingale Strategy
The Martingale method is a progressive betting strategy where the position size is doubled after every loss. The goal is to recover all previous losses with a single win. The basic idea is that after a loss, you double the size of the next trade to make back the lost money (and make a profit equal to the original bet size).
How it Works:
If you lose a trade, you increase your position size on the next trade.
You keep doubling the position size until you win.
Once you win, you return to the original position size and start the process again.
To implement martingale in Pine strategy, we would need to calculate the last consecutive losses before placing the trade. It can be done via following code.
var consecutiveLosses = 0
if(ta.change(strategy.closedtrades) > 0)
lastProfit = strategy.closedtrades.profit(strategy.closedtrades-1)
consecutiveLosses := lastProfit > 0? 0 : consecutiveLosses + 1
Quantity can be calculated using the number of consecutive losses
qtyMultiplier = math.pow(2, consecutiveLosses)
baseQty = 1
tradeQty = baseQty * qtyMultiplier
🎯Paroli System (also known as the Reverse Martingale)
The Paroli System is similar to the Anti-Martingale strategy but with more defined limits on how much you increase your position after each win. It's a progressive betting system where you increase your position after a win, but once you've won a set number of times, you reset to the original bet size.
How it Works:
Start with an initial bet.
After each win, increase your bet by a predetermined amount (often doubling it).
After a set number of wins (e.g., 3 wins in a row), reset to the original position size.
To implement inverse martingale or Paroli system through pinescript, we need to first calculate consecutive wins.
var consecutiveWins = 0
var maxLimit = 3
if(ta.change(strategy.closedtrades) > 0)
lastProfit = strategy.closedtrades.profit(strategy.closedtrades-1)
consecutiveWins := lastProfit > 0? consecutiveWins + 1 : 0
if(consecutiveWins >= maxLimit)
consecutiveWins := 0
The quantity is then calculated using a similar formula as that of Martingale, but using consecutiveWins
qtyMultiplier = math.pow(2, consecutiveWins)
baseQty = 1
tradeQty = baseQty * qtyMultiplier
🎯D'Alembert Strategy
The D'Alembert strategy is a more conservative progression method than Martingale. You increase your bet by one unit after a loss and decrease it by one unit after a win. This is a slow, incremental approach compared to the rapid growth of the Martingale system.
How it Works:
Start with a base bet (e.g., $1).
After each loss, increase your bet by 1 unit.
After each win, decrease your bet by 1 unit (but never go below the base bet).
In order to find the position size on pinescript strategy, we can use following code
// Initial position
initialposition = 1.0
var position = initialposition
// Step to increase or decrease position
step = 2
if(ta.change(strategy.closedtrades) > 0)
lastProfit = strategy.closedtrades.profit(strategy.closedtrades-1)
position := lastProfit > 0 ? math.max(initialposition, position-step) : position+step
Conclusion
Position sizing is a crucial part of trading strategy that directly impacts your ability to manage risk and achieve long-term profitability. By selecting the appropriate position sizing method, traders can ensure they are taking on an acceptable level of risk while maximizing their potential rewards. The key to success lies in understanding each strategy, testing it, and applying it consistently to align with your risk tolerance and trading objectives.

BTC AnalysisThis is my prediction for Bitcoin based on technical and fundamental analysis, so I think the BTC will experience a marginal drop and then witness a sharp rise to pursue the following projection.
What do you think? Let me know your thoughts!
#Bitcoin #Crypto #Trading
BRIEFING Week #14 : What a Mess !Here's your weekly update ! Brought to you each weekend with years of track-record history..
Don't forget to hit the like/follow button if you feel like this post deserves it ;)
That's the best way to support me and help pushing this content to other users.
Kindly,
Phil

BTCUSD LONG Rebound BTCUSD Rebound until 78.60 Fibbonacci level and after that sell until 1h orderblock downside.


BITCOINBTC is in consolidation for more upside, once we have taken liquidity from above we shall see the reaction.
Disclosure: We are part of Trade Nation's Influencer program and receive a monthly fee for using their TradingView charts in our analysis.

BTCUSD Expected Growth! BUY!
My dear followers,
This is my opinion on the BTCUSD next move:
The asset is approaching an important pivot point 82240
Bias - Bullish
Technical Indicators: Supper Trend generates a clear long signal while Pivot Point HL is currently determining the overall Bullish trend of the market.
Goal - 82971
About Used Indicators:
For more efficient signals, super-trend is used in combination with other indicators like Pivot Points.
Disclosure: I am part of Trade Nation's Influencer program and receive a monthly fee for using their TradingView charts in my analysis.
———————————
WISH YOU ALL LUCK

Bitcoin is repeating history.
As you can see, Bitcoin is forming a repeating pattern which I’ve highlighted in the lower circle. It could form the black pattern and exactly repeat history.
For now, we have to wait and see.

Bitcoin is repeating history.Hey trader's
As you can see, Bitcoin is forming a repeating pattern which I’ve highlighted in the lower circle. It could form the black pattern and exactly repeat history.
For now, we have to wait and see.

BTC riding the green line is not normalBut when it does, it goes up HUGE. The channel is narrowing which means less volatility in the future and steady inflows are expected, that time is unknown at the moment but I believe it is a given. Now is a great time to buy your favorite coin whatever that is......
Shut out the noise and trade there is money to be made here.
^^ turns to VV to watch for it.

BTC LongThe price is hovering around the one hour bullish trendline, and also above the 0,618 Fib level. A bullish divergence is forming on the 30 minutes time frame which suggests a reversal may take place.
