Institutional smart money concept trading. Execution of institutional traders. Identify liquidity or become liquidity.
BULLUSD trade ideas

BTC/USD update on the drop!Good day traders, yesterday I posted the same set up on bitcoin and now I’ve decided I’m gonna update this setup till we hit our Daily lowest low.
1H TF yesterday before end of trading day we show price bounce off the the horizontal lines and that is used as my support area, going into the New York session we can expect price to retest the break after it breaks below the support which will than become my resistance.
Hopefully today we can see price run our liquidity resting below(equal lows).
My name is Teboho Matla but you don’t know me yet..#Salute

BTC short term tradeTrading inside a Monthly Bisi aroud the CE
Bearish trend on the daily chart
Target low end of the Bisi

BTCUSD - Messy range, upside more probableBitcoin continues to navigate a messy consolidation range between $80,000 and $89,000, with the current price hovering around $84,002. This choppy price action reflects market indecision following the significant decline from the $100,000 area in late January. Despite the lack of clear direction in the short term, the higher probability move appears to be to the upside, with potential targets near the orange resistance level at $88,786. Supporting this bullish bias is the strong bounce from the March lows around $76,500 (highlighted by the blue support zone), suggesting buyers remain active at lower levels. The recent series of higher lows also indicates strengthening bullish momentum within the range. Traders should watch for a decisive break above the current congestion area, which could accelerate the move toward the upper resistance and potentially open the path for a retest of the psychological $90,000 level.
Disclosure: I am part of Trade Nation's Influencer program and receive a monthly fee for using their TradingView charts in my analysis.

Bitcoin Holding prz support line its coming upward read captionIt sounds like you're analyzing Bitcoin's price action and think it's approaching or holding a support line, which could mean an upward move is likely soon. Support zones can definitely act as a springboard for price bounces, especially if volume confirms the strength.
Do you have a chart you're looking at or a specific PRZ (Potential Reversal Zone) or support level in mind? I can help break it down further if you want to share more details or an image.

BTC Range PredictionBTC Scenario #1- If don’t hold the 7 and 9 EMA and push up then I expect a flip to bullish and retest a Low volume node indicated as a blue trendline which indicates a resistance and Supply Zone. Either we push through this resistance / Supply Zone and test blue dotted line which is POC (Point of Control) or we push past POC and retest the VAH (Volume Area High).
BTC Scenario #2- If continue dropping from the 7 and 9 EMA. I expect a drop to VAL (Volume Area Low) then retest the Low Volume node / Resistance Level ( blue trendline) then possibly drop below the High Volume Node also know as the Ledge. Seeing that price reversed and began pushing up when we swept the High Volume Node. If do reverse at this same area after retesting the Low Volume Node then I can assume we will test the POC (blue dotted line) or past through the POC to test VAH

BTCUSD Technical analysis after breakout we expect this move.BTCUSD Forecast and technical analysis H1 Time Frame next move possible. Not financial advice


Bitcoin + Major altcoins requests! (write your altcoin)I am here to help the TradingView crypto community with decisions on altcoins. Write a comment with your altcoin + hit the like button, and I will make an analysis for you in response.
While Bitcoin is heading towards 69,000 USDT, please take a look at my newest technical analysis. The price of Bitcoin is inside this falling wedge pattern, and I expect a drop!
I will analyze all your altcoins. Trading is not hard if you have a good coach! This is not a trade setup, as there is no stop-loss or profit target. I share my trades privately. Thank you, and I wish you successful trades!

Bitcoin: luckily, left behindThis was one of extremely rare weeks when traders could say that the move of BTC toward the downside was not at all bad. They just need to see developments on other financial markets as of the end of the previous week. Despite the general sale off, it could be noted that BTC strongly holded its grounds, and most importantly, was not affected too much with news regarding the trade war. The price of BTC was relatively calm, compared with other financial assets, which was relatively good news. The price was moving within a relatively short range, between $85K and $82K. There was a short move toward the $88,1K, but it was just one short occasion.
The RSI continues to be in a silent mood, moving around the level of 45, for the last two weeks, implying that BTC currently has no trade direction. Very important development is occurring with MA lines. Namely, for the second week in a row they are highly converging toward each other, implying that the potential cross is just right around the corner. This is going to be a so-called dead-cross, implying on potential trend change.
Evidently, at this moment markets are not at all concerned about the crypto currencies, as they have some significant developments on the other side. The volatility would certainly continue in the coming period, but to what extent BTC will be affected, is hard to estimate. Is BTC going to be an asset to be sold by some investors in order to cover margin calls from other markets? Is there a leg in the reflection of major developments from traditional markets on the crypto market? Those are questions which will seek the answer in the week to come. Based on charts, there are equal opportunities for BTC to shortly reach the $85K, but the charts are also pointing toward the $78K in the coming period. The fundamentals from other markets will decide the course of BTC in the week ahead. Trading precaution is highly advisable.

BTC/USD Weekly Analysis – Cup and Handle Breakout Toward Target🔍 Overview
The chart displays a classic Cup and Handle pattern on the weekly timeframe, a well-established bullish continuation formation often found in long-term uptrends. This pattern, combined with major technical confluences such as trendline support and strong horizontal levels, provides a high-conviction long setup with defined risk and reward.
☕ 1. The Cup Formation
Timeframe: Mid-2021 to early 2024
Shape: Rounded bottom, a hallmark of slow accumulation.
After reaching an all-time high in late 2021, BTC entered a bear market, dropping sharply and eventually bottoming out between $15,000–$20,000.
A gradual recovery followed, forming a wide and symmetrical base—indicating accumulation by institutional and long-term holders.
This phase represents a shift in market sentiment, from bearish to neutral, and eventually bullish, as buyers stepped in around key demand zones.
🔧 2. The Handle Formation
Timeframe: Early 2024 to late 2024
After reclaiming its previous high resistance area near $69,000–$75,000, BTC formed a short-term consolidation or pullback, creating the "handle" portion of the pattern.
The handle appeared as a descending channel, a healthy correction that typically precedes a breakout in this pattern.
This correction also aligned with a trendline retest, offering dynamic support and further strengthening the pattern's reliability.
💥 3. Breakout Confirmation
The breakout from the handle occurred above the descending resistance of the handle pattern.
Weekly candles showed strong bullish momentum, backed by rising volume and rejection from lower trendline levels.
BTC is now trading near $83,000, just above the trendline, confirming both pattern validation and support holding.
🎯 4. Target & Projection
The measured move of the Cup and Handle pattern is calculated by measuring the depth of the cup and projecting that from the breakout point.
Cup Depth: Approximately $60,000
Breakout Point: ~$75,000–$80,000
Target Price: ~$123,000–$125,000
This target aligns with historical Fibonacci extensions and psychological round-number resistance.
🔐 5. Key Levels
Support Zone: $20,000–$30,000 (multi-year accumulation base)
Trendline Support: Drawn from 2022 lows, holding well through handle correction
Resistance Zone: $100,000 psychological barrier
Stop Loss: Placed just below trendline and swing low at $76,340 to protect against downside volatility
🧠 Why This Setup is Strong
Multi-year Base Formation (2.5+ years of consolidation)
Pattern Reliability: Cup and Handle is a well-tested bullish continuation pattern
Confluence of Support: Both horizontal and dynamic trendline support levels
Momentum Structure: BTC has resumed higher highs and higher lows
Volume: Breakout occurred with a noticeable spike in volume, a key validation point
🏁 Conclusion
Bitcoin is displaying strong bullish potential through a large-scale Cup and Handle pattern. This technical setup is supported by:
Long-term accumulation
Structural breakout
Strong support levels
A clear roadmap toward $120K+ targets
As long as BTC maintains above the trendline and doesn't invalidate the handle's structure, the bulls remain firmly in control.

Short The price is consolidating between 89,000 and 76,500 zone. But I can see another downward move to 76,500 is developing.
Where I drew blue rectangular blocks and red vertical lines in the chart (Feb and March 2025) are the very similar set up as the current situation as follows:
1) The market creates the set up where it looks like the price is slowly recovering and pushes above EMA200.
2) The reverses aggressively to the downside (liquidity sweep).
3) The price consolidates in the very tight range.
4) Momentum indicators move into the bear zone.
I already have one small short position, but once RSI and MACD enter the bear zone and the price stays below VWAP (purple line drawn from the August 24 low) and also closes below the buy order block (green box), I will open another short position.
Stop loss - above EMA 200 in 4H chart.
Target - 76,540

Bitcoin back to 4 Digits.In the worst case scenario Bitcoin can go back to 8k, making a huge collapse after the insane boom.
Something similar to the dot com boom, mega reverse.
Trump administration is killing the econoomy with trade war that can get much worse then we are seeing.
In my view or trump leaves office or we are going to the biggest recession ever, literally all bankrupt

Bitcoin Triangle Breakout Signals Bullish Momentum!A long trade was initiated following a bullish breakout from the symmetrical triangle pattern. Price action confirms support holding, with upward targets aligned to previous resistance zones.

Bitcoin Elliott Waves Analysis: Short opportunityIn this lengthy video, I discussed the details of labelling and counting of waves for Bitcoin from daily to the 5 mins timeframes. I drilled down to the minuette waves (in orange) on the 5 mins timeframe. Take note that I made a mistake in the actual config of one of the orange waves (setting it as minute instead of minuette). The mistake happened on the 9:15 where I changed the color of the corrective wave A-B-C but did not change the degree.
In this video, I also discussed the alternate counts (in blue) in details.
But while both the primary and alternate counts are both short bias, the target entries (and thus risks) are different. if you are an aggressive trader, and want to trade on the alternate count, your stop will be set above the blue line where the alternate count is invalidated. If you are trading on my primary count, you will want to see reversal pattern (e.g. candlestick reversal) or see rejection at the red line.
In any case, good luck in your trading and remember to keep your risk tight!

other possible ideaThis Analysis Can Change At Anytime Without Notice And It Is Only For educational Purpose to Traders To Make Independent Investments Decisions.
Disclaimer
The information and publications are not meant to be, and do not constitute, financial, investment, trading, or other types of advice or recommendations supplied or endorsed by TradingView

ideaThis Analysis Can Change At Anytime Without Notice And It Is Only For educational Purpose to Traders To Make Independent Investments Decisions.
Disclaimer
The information and publications are not meant to be, and do not constitute, financial, investment, trading, or other types of advice or recommendations supplied or endorsed by TradingView

btcusdThe Move For The Future
Basic trend analysis for bitcoin.
Weekly bullish Uptrend
Looking for an entry between 80k as low as 76k

Buy Bitcoin📈 BTC/USD – Liquidity Recovered, Price Reacting
This chart shows BTC (candles) vs. M2 Global Liquidity (yellow, 77-day delay).
M2 dropped ~4% in late 2024, then fully recovered that drop in early 2025.
BTC is now reacting to that move with a delay of ~77 days, showing strength off ~$80K support.
If M2 breaks out from here, BTC could trend toward $90K–100K, possibly ATH by mid-June.
To hold above $80K, M2 likely needs ~4–6% YoY growth or clear upward momentum.
If M2 double-tops, BTC may peak within 60–77 days.
Liquidity leads, Bitcoin follows — and M2 just reclaimed 4%.

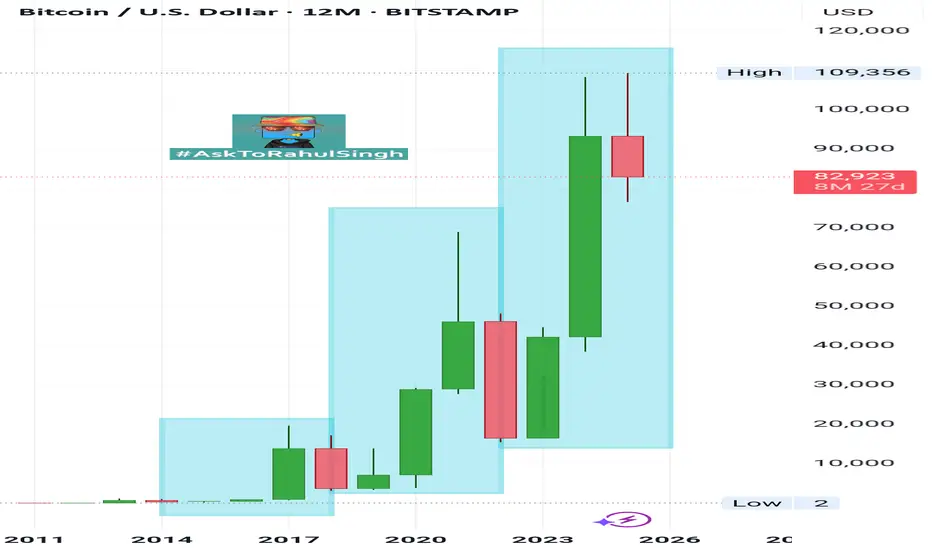
#Bitcoin Yearly Analysis #Bitcoin Trading around $83.6k
Now, As per Weekly Chart Analysis-
If you go for Bitcoin 4 years of Cycle of #Halving to #Halving, it includes always #Bullish #Bearish & Stable Zones of Bitcoin & #Altcoins tradings..
Now, as per yearly cycle..
Bitcoin moved always as per 3 Green & 1 Red Cycle, as per that scenario 2023, 2024 & 2025 is Green Candles year & 2026 will be Red Candle year of #BearishZone.
So, this seasons #BullRun last phase will be starts around August onwards to Dec-Jan. 2026 and after that market will be go under deep #BearishZone.
So, don't be panic at hard, that's the last opportunity time frame of 120/150 days, in which you will be make your again entry points on hard max. time around june-July 2025 at last for #Bitcoin Last time Lower-Low of approx. FWB:65K -67k.
Anyways,
Always #DYOR and Trade Wisely by using of #StopLoss strategy... 🙏
Bitcoin Super RecessionI beleive Bitcoin will face a totally 53% drop from its all time high after US Recession will start during this year.
Mark my words last time we had a collapse on crypto in 2022 i predicted this time is easier due to financial incertenity

BTC ROADMAP IN 2025**BTC Analysis 2025 Roadmap**
As we embark on 2025, Bitcoin remains a pivotal player in the cryptocurrency landscape. This detailed analysis highlights crucial milestones, technical indicators, and market sentiment for traders to focus on throughout the year.
**1. Market Sentiment and Adoption:**
- The projected increase in institutional investment and broader mainstream adoption is likely to significantly impact Bitcoin's trajectory. Stay alert to developments in regulations and corporate endorsements of cryptocurrency.
**2. Technical Indicators:**
- Scrutinize moving averages (50-day and 200-day) for potential signals to buy or sell. A bullish crossover could suggest a robust uptrend is underway.
- Utilize Relative Strength Index (RSI) and Moving Average Convergence Divergence (MACD) to assess market conditions for overbought or oversold scenarios.
**3. Key Support and Resistance Levels:**
- Pinpoint critical support levels around $30,000 and $25,000, which may present buying opportunities if Bitcoin experiences price corrections.
- Watch for resistance levels at $40,000 and $50,000; a breakout beyond these levels could signify the commencement of a new bullish phase.
**4. Halving Event Impact:**
- With the next Bitcoin halving anticipated in 2024, historically, this event has precipitated price increases. Pay close attention to market movements following the halving for potential bullish trends.
**5. Market Correlation:**
- Observe the correlation between Bitcoin and traditional financial markets, particularly during times of economic volatility. A strong relationship with gold may indicate shifts in investor behavior.
**6. Macro-Economic Factors:**
- Remain vigilant regarding inflation rates, interest rate changes, and overall economic conditions, as these elements profoundly influence Bitcoin's price dynamics.
**Conclusion:**
In 2025, the path of Bitcoin will be shaped by a confluence of technological advancements, regulatory changes, and evolving market dynamics. Active traders should leverage technical analysis and stay updated on global economic influences to make strategic decisions. Remember, effective risk management is essential in navigating the inherent volatility of this market.

BTCUSD Trade AnalysisLong at 82,520
Target 1 (Primary):91,195 (Early exit if strong rejection forms)
Target 2 (Secondary):99,200 (If bullish momentum sustains)
Stop Loss:77,000 (Below key support).
Expecting a bullish continuation toward 99,200 before a potential sell-off resumes. Will monitor price action near 91,195 for signs of rejection. Stop loss placed below 77,000 to protect against a breakdown.
