Theme: Distribution Phase with Sentiment OverhangSetup Overview
Bitcoin is exhibiting classical post-euphoria distribution behavior. Following the ETF-driven rally, price has failed to follow through. Structure is weakening under persistent denial from retail participants. Crowd remains heavily long and emotionally invested in the prior bullish narrative, while the market structure continues to deteriorate.
COT & Sentiment Snapshot
Leveraged long interest remains high
Crowd anchored to ETF news cycle
Positioning shows no substantial unwind yet
Structural failure evident with compression under resistance
Market Structure & Technical Breakdown
Post-rally failure to continue trend
Distribution pattern forming with lower highs
Compression and weakening momentum under key supply
Lack of bullish response to positive news suggests exhaustion
Behavioral Finance Layer (Watts + Livermore)
“The crowd believes what it wants to believe, even when the structure says otherwise.”
Anchoring bias to bullish ETF narrative
Denial and overconfidence prevalent in sentiment
Herd behavior preventing repositioning
Emotional fragility building toward reflexive flush
Reflexivity Risk Model
Phase 1: Failed follow-through post-ETF optimism
Phase 2: Breakdown below structural demand
Phase 3: Crowding into late long entries
Phase 4: Emotional flush and positioning reset expected
Strategic Bias: Bearish (Short Bias)
The setup favors downside continuation until behavioral and structural washout occurs. Patience is key — the true opportunity lies in timing the emotional capitulation and reassessing risk post-reset.
BULLUSD trade ideas

btcusd buy tradeThe Relative Strength Index (RSI) is showing an upward trend, indicating increasing momentum. Additionally, the Moving Average Convergence Divergence (MACD) is showing a bullish crossover, further supporting the potential for an upward move.

btcThis Analysis Can Change At Anytime Without Notice And It Is Only For educational Purpose to Traders To Make Independent Investments Decisions.
Disclaimer
The information and publications are not meant to be, and do not constitute, financial, investment, trading, or other types of advice or recommendations supplied or endorsed by TradingView

BTC - Cryptos look bullish?Based on the action the last 2 days, I'm actually feeling bullish on cryptos, lol. Cryptos have been tracking the market lately, especially on selloffs, so the dissociation with the market drop is bullish.
People will notice, several followers have already commented on it. As more people notice, they'll flock to crypto as the "safe haven" that crypto nerds always wanted them to be. Plus Trump is a crypto nerd too.
Personally, I think cryptos are just a bunch of worthless numbers, but then again I'll trade Pet Rocks and Beanie Babies if I thought I could make money on them. (Yeah, I'm old, lol) People don't seem to understand that you don't own any part of the technology, just a set of numbers generated by an algorithm. Regardless, still bullish short term.
Also, 3hr indicators sort of work on BTC, you can see 3hr MFI went oversold and BTC bounced.

Bitcoin vs. Global M2 | 10-Week Lead Correlation This chart highlights the strong correlation between Bitcoin’s price (RHS, blue) and Global M2 Money Supply (10-week lead, orange), suggesting that Bitcoin’s price action lags behind global liquidity trends by approximately 10 weeks. Historically, increases in M2 have led to bullish Bitcoin movements, making M2 a leading indicator for BTC’s price action.
Bitcoin has closely followed M2’s trajectory, and the chart marks April 9 as a key turning point, with a critical support level around $79,470. Given M2’s prior surge, Bitcoin is expected to initiate a strong upward move post-April 9, potentially pushing toward six figures ($100K+) in Q2 2024 if the correlation holds.
While short-term consolidation or a retest of $79,470 remains possible, the medium-term outlook remains bullish. If M2 continues to rise, Bitcoin is likely to follow, with projected targets in the $95K - $110K+ range. However, macroeconomic risks, such as a slowdown in M2 growth or liquidity tightening, could delay the expected breakout.
Key Takeaways:
April 9 marks a potential breakout point for Bitcoin, following M2’s lead.
Key support: $79,470 (a potential bounce zone before the rally).
Medium-term targets: $95K - $110K+ by mid-2024.
Watch Global M2 trends—continued liquidity growth supports a Bitcoin bull run.
If Bitcoin maintains its correlation with M2, this liquidity-driven cycle could propel BTC to new all-time highs in the coming months. 🚀

Bitcoin vs. Nasdaq: BTC Shows Signs of Decoupling Amid US Stock
For years, the narrative surrounding Bitcoin’s price action has been inextricably linked to the performance of traditional financial markets, particularly the tech-heavy Nasdaq Composite. Often moving in lockstep, Bitcoin was viewed by many as a high-beta asset, amplifying the gains during bullish periods and suffering even steeper losses when risk sentiment soured in equities. However, recent market movements have sparked a crucial question among investors and analysts alike: is Bitcoin finally beginning to forge its own path, decoupling from the gravitational pull of U.S. stocks as they face mounting headwinds?
The past few weeks have witnessed a notable divergence. While U.S. stock markets, reeling from a confluence of factors including escalating geopolitical tensions stemming from a potential “Trump tariff war,” persistent inflation concerns highlighted by Federal Reserve Chair Jerome Powell’s hawkish warnings of “higher inflation and slower growth,” and broader macroeconomic anxieties, have experienced a significant downturn – shedding a staggering $3.5 trillion in value – Bitcoin has demonstrated a surprising degree of resilience, even posting gains in some instances. This nascent divergence has ignited a wave of optimism among Bitcoin proponents who have long yearned for the digital asset to be recognized and traded based on its own fundamental merits, rather than as a mere proxy for risk-on sentiment in the equity markets.
The concept of Bitcoin decoupling from traditional assets has been a recurring theme in the cryptocurrency space. The original thesis for Bitcoin, after all, positioned it as a decentralized, censorship-resistant store of value and a hedge against traditional financial system vulnerabilities. Its finite supply, its independence from central banks and government policies, and its inherent scarcity were touted as key differentiators that would eventually lead it to trade independently. However, the reality of the past few years has often painted a different picture, with institutional adoption bringing increased correlation with established asset classes.
The current shift, however tentative, offers a glimmer of hope for those who believe in Bitcoin’s unique value proposition. The factors contributing to the stock market slump – trade war anxieties, inflation fears, and the prospect of tighter monetary policy – arguably strengthen the case for Bitcoin as an alternative asset. In times of economic uncertainty and currency debasement concerns, the fixed supply and decentralized nature of Bitcoin could become increasingly attractive to investors seeking a safe haven outside the traditional financial system.
Furthermore, the increasing maturity of the Bitcoin market, with the development of more sophisticated trading instruments, greater institutional participation, and a deeper understanding of its underlying technology, may be contributing to its growing independence. As Bitcoin gains broader acceptance as a legitimate asset class, its price discovery mechanisms may become less reliant on the sentiment driving traditional equity markets.
However, it is crucial to approach this apparent decoupling with a degree of caution. While the recent divergence is encouraging for Bitcoin bulls, it is too early to definitively declare the long-awaited break has finally arrived. Market correlations can be fluid and influenced by a multitude of factors. A sudden shift in global risk sentiment or a significant negative event specific to the cryptocurrency space could easily re-establish the link between Bitcoin and traditional assets.
Adding a layer of complexity to the current narrative is the warning from some analysts regarding a potential Bitcoin price correction. Despite the recent resilience, multiple BTC price forecasting models have pointed towards a scenario where Bitcoin could fall back to its 2021 all-time high of around $70,000 in a relatively short timeframe – some even suggesting this could occur within the next ten days. This potential “crash risk,” as one analyst termed it, is attributed to various technical and market cycle indicators.
The notion that $70,000 could represent Bitcoin’s “practical bottom,” as suggested by some, highlights the inherent volatility and speculative nature of the cryptocurrency market. Even if Bitcoin is beginning to decouple from traditional equities, it remains susceptible to its own unique set of risks and price swings. Factors such as regulatory developments, network security concerns, and shifts in investor sentiment within the crypto space can still exert significant influence on its price.
Therefore, while the current divergence between Bitcoin and the struggling U.S. stock market offers a compelling narrative and fuels the hopes of long-term Bitcoin holders, it is essential to maintain a balanced perspective. The confluence of factors driving the stock market decline could indeed be creating an environment where Bitcoin’s unique characteristics become more appealing, leading to a sustained period of independent price action. However, the inherent volatility of the cryptocurrency market and the potential for a significant correction remind investors that the journey towards true decoupling is likely to be a complex and potentially bumpy one.
In conclusion, the recent market dynamics present a fascinating juncture for Bitcoin. The initial signs of decoupling from the crumbling U.S. stock market, driven by a confluence of macroeconomic anxieties and the potential for Bitcoin to act as an alternative store of value, are undeniably encouraging for those who believe in its long-term potential. However, the warnings of a potential price correction underscore the inherent risks within the cryptocurrency space. Whether this nascent decoupling marks a definitive shift in Bitcoin's market behavior or proves to be a temporary divergence remains to be seen. Investors would be wise to monitor these trends closely, remaining cognizant of both the potential for independent growth and the ever-present risks associated with this dynamic and evolving asset class. The coming weeks and months will be crucial in determining whether Bitcoin can truly forge its own path in the face of traditional market turmoil.

BTC/USD 1W chartHello everyone, I invite you to review the BTC chart to USD at 1W interval. As we can see long -term despite the current correction, the price lasts above the main line of upward trend. Going further we can see how the current correction stopped at strong support at 79221 $, however, if the support is broken, then you can see the second very strong support at $ 72085, which is close to the upward trend line.
In a situation where the trend is reversed, we have visible resistance at $ 89147, then a significant level of $ 96784 and very strong support at the level of the previous ATH. Looking at the RSI, you can see how he begins to change the direction that can change the direction of the price.

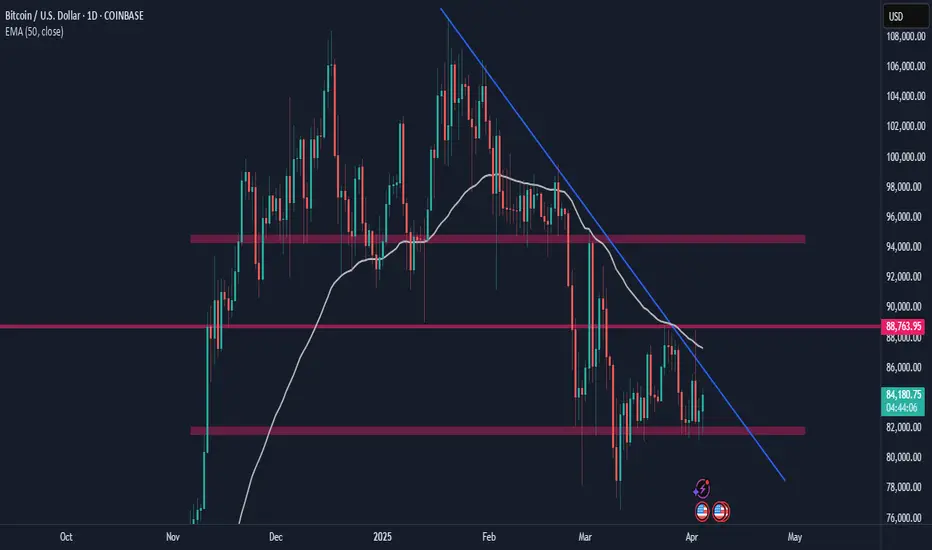
Bitcoin (BTC/USD) – Bearish Breakdown & Key Levels to WatchMarket Overview:
Bitcoin is trading at $84,185, showing a +1.63% increase. The price action suggests a potential breakout towards the upside.
🔹 Chart Structure:
BTC has been consolidating in a range-bound structure after a sharp upward move.
Previous rising wedge patterns led to corrections, but the price is holding key support levels.
A breakout setup is forming with a target towards $88,500 – $90,000.
🔹 Key Levels to Watch:
✅ Resistance: $85,249, $86,934, $88,500, $90,000
✅ Support: $82,000, $81,400
🔹 Potential Trade Setup:
📈 Bullish Scenario:
If BTC holds above $84,000, a push towards $86,500 – $88,500 is likely.
A breakout above $88,500 could lead to $90,000+.
📉 Bearish Scenario:
If BTC rejects $85,000, a pullback to $82,000 – $81,400 may occur before another move up.
🔹 Conclusion:
Bias: Bullish above $84,000
Target: $88,500 – $90,000
Invalidation: Below $81,400
Would you like a more detailed trade plan with stop-loss and entry points? 🚀

#BTC #BTCUSD #BTCUSDT #BITCOIN #LONG #SWING #Analysis #Eddy#BTC #BTCUSD #BTCUSDT #BITCOIN #LONG #SWING #Analysis #Eddy
BTCUSDT.P Swing Long Analysis With Entry Point
This is my first possible scenario and analysis of Bitcoin's future trend.
This Analysis is based on a combination of different styles, including the volume,ict & Price Action Classic. (( Head & Shoulder Pattern ))
Based on your strategy and style, get the necessary confirmations for this Swing long to enter the trade.
Don't forget risk and capital management.
Entry point already touched : 🟢 79285.50
The responsibility for the transaction is yours and I have no responsibility for not observing your risk and capital management.
🗒 Note: The price can go much higher than the first target, and there is a possibility of a 500% pump on this currency. By observing risk and capital management, obtaining the necessary approvals, and saving profits in the targets, you can keep it for the pump.
Spot Investing : ((long 'buy' position)) :
🟢 Entry 1 : 79285.50
🟢 Entry 2 : 61845.77 (( This Entry is for secound scenario ))
First entry point calculations :
⚪️ SL : Behind the last shadow created.
⚫️ TP1 : 250000 ((215.32%))
⚫️ TP2 : 500000 ((530.63%))
⚫️ TP3 : 999000 ((1160.00%))
‼️ Futures Trading Suggested Leverages : 3-5-7
The World Let it be Remembered...
Dr. #Eddy Sunshine
4/4/2025
Be successful and profitable.
Do you remember my first Bitcoin swing long signal entry & targets?
My first swing long signal was provided on BTC, which was spot pumped by more than 150% and was profitable :


BTC DOWNTREND BTC Downtrend may be over this may be a perfect time to buy
Weekly retest maybe over by now
Bitcoin vs S&P 500This is almost too simple to publish but my point is that the period of acceleration for BTC vs S&P500 hasn't happened yet. In past cycles the rapid outperformance lasted 5-7 months. We either stated that phase or are about to. Of course it probably won't be the same as prior cycles but it will likely be something similar.
Basically if we repeat the pattern then phase 2 should begin. The market will likely be getting crazier. I've held through the downturn so I'm going to continue to hold now.


BTCUSD: Conservative September Target $150kBitcoin remains neutral on its 1W technical outlook (RSI = 46.307, MACD = 1999.100, ADX = 44.501), firmly supported on top of the 1W MA50. On this analysis you see the Channel Up that dictated the price action of the last three Cycles. Since December 2023 BTC has traded solely inside the 0.382 - 0.618 Fibonacci Zone, the median zone of the Channel Up. The Theory of pre-Halving / post-Halving symmetry implies that the time range from the Cycle Bottom to the Halving is almost the same as the time from the Halving to the Cycle Top. Since on the current Cycle, the time from the Bottom to the Halving has been 76 weeks, in theory the Top should be another 76 weeks from the Halving. We take the worst case estimate of 74 weeks like the 2017 Top. That's the end of September. And with regards to the target, a conservative estimate is just over the 0.5 Fib at 150k, like the highs of December 2024 and March 2024.
## If you like our free content follow our profile to get more daily ideas. ##
## Comments and likes are greatly appreciated. ##

Analysis with node and timeAccording to my personal analysis, I expect Bitcoin's growth to begin from April 10-15, and this time it will take the other altcoins with it and reach their final targets.

BTCUSD sideways consolidation Recent price action in Bitcoin (BTCUSD) suggests an oversold bounce, with resistance capping gains at the 88,000 level. The continuation of selling pressure could extend the downside move, with key support levels at 79,000, followed by 76,278 and 74,222.
Alternatively, a confirmed breakout above 91,900, accompanied by a daily close higher, would invalidate the bearish outlook. In this scenario, Bitcoin could target 95,126, with further resistance at 96,415.
Conclusion:
The price remains below pivotal level, with 88,000 acting as a key resistance. Failure to break above this level could reinforce downside risks, while a breakout could shift momentum back in favor of bulls. Traders should watch for confirmation signals before positioning for the next move.
This communication is for informational purposes only and should not be viewed as any form of recommendation as to a particular course of action or as investment advice. It is not intended as an offer or solicitation for the purchase or sale of any financial instrument or as an official confirmation of any transaction. Opinions, estimates and assumptions expressed herein are made as of the date of this communication and are subject to change without notice. This communication has been prepared based upon information, including market prices, data and other information, believed to be reliable; however, Trade Nation does not warrant its completeness or accuracy. All market prices and market data contained in or attached to this communication are indicative and subject to change without notice.

* BTC bullish and bearish scenarios explained! *Hello Degenerates,
In this video, I tried to explain my bull and bear scenarios while highlighting that EVEN MY BEAR SCENARIO IS BULLISH!
Take some time to watch it if you want, and share your thoughts!
Thank you!


BTC - short if the accelerated trendline breaks and confirms. This has been a very screwy time in markets, lol.
I was stopped out of my first BTC short after at least some profits were taken.
I still think that we are going to face a correction before heading higher, granted that we haven't seen the top of this cycle.
If this accelerated trendline breaks and confirms, enter a short position. That is the safest entry for now at least.
I would target the big picture trendline, which will probably be close to the .50 fib on this particular break-out structure. So, close to 76K.
We may even get a scare-tactic wick down to 68K-70K. That coincides with this structure's .618 pocket.
Anyway, that's it for now for me.
Thank you!

BTC still bullish to 90k-100k?BTC: My views have not changed and I am still extremely bullish to 90k-100k
On the monthly chart, we have been consolidating for months on declining volume. It looks like a symmetrical triangle getting read for 90k-100k This pattern looks very good and falls within our break out time frame range in the coming weeks/months
All we've been doing is grinding side ways squeezing out weak hands. Making people bored. Make people lose interest. The breakout is coming. THe most recent candle being bought up looks good as well.
With the political situation in the USA, it may very well be the case Trump gets re-elected. If so, it's important to note he's becoming very pro crypto, his VP is very pro-crypto, and he tapped Jamie Dimon(Unconfirmed if he said yes) for his cabinet which is extremely pro-Crypto. It all seems to be lining up for a nice bull market

Gravestone Doji Weekly CandleClassive fake-out before the break-out. Printing in a Gravestone doji that ends higher shows who is in charge the Bulls or the Bears. My prediction after watching candlesticks for the past 12 years is we have a massive break-out to the upside next week.

BTC - SHORTPrice respected the higher time frame trend line and tariffs helped out as well. Ultimately see price still pushing down to 73k before buyers start coming back into play.
