1 Month Bitcoin Consolidation, and Back to $100,000Following the global liquidity with a 109-day delay, the price of BTC should consolidate between the upper 70s and low 80s until the first week of May before increasing back to over $100,000 and eventually to new ATHs. This will coincide with the Strategic Bitcoin Reserve purchase in the US.
P.S - incredibly impressed with how Bitcoin is holding up whilst the stock market is crashing.
BULLUSD trade ideas

BITCOINS BIG MOVE IS COMING! I hope you guys did enjoy this trade idea; feel free to comment down below if you have any questions or comments.

BTC, Daily, Long, 1:8BTC, 1D
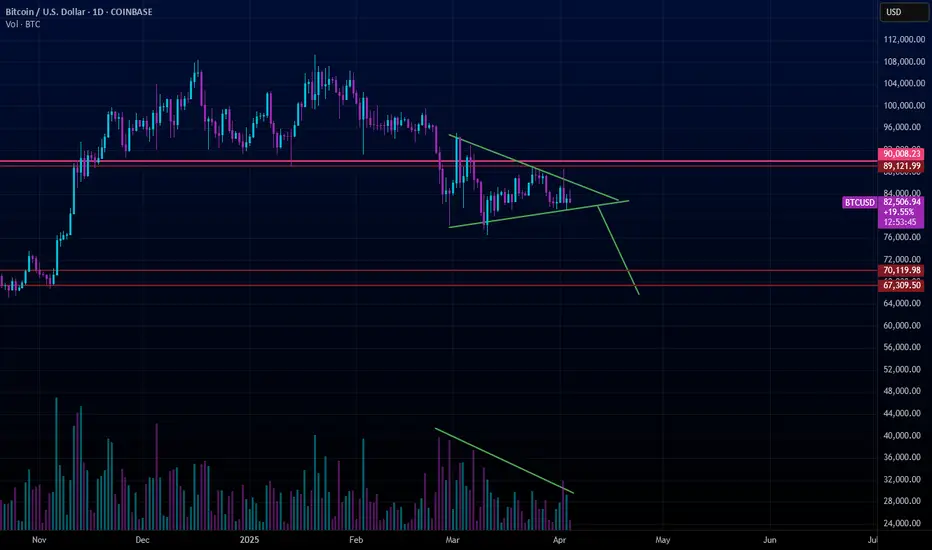
DIvergence on Daily Timeframe
Due to Fundamentals, liquidity sweep is expected around last LL and Possible reversal

Downward channel on the 4hIt's been breached with a bear trap and a bull trap, but it's there. Watch this channel to build more structure over the weekend.

BTCUSD Weekly Log ChartOften preceding the general market movement, bitcoin currently holds its support pretty well.

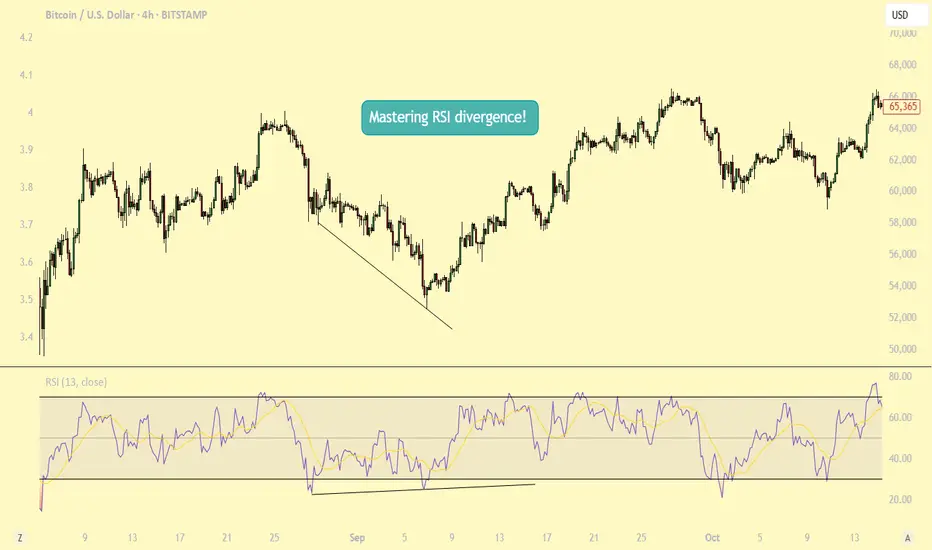
Mastering RSI Divergence: A Complete Guide to Trend ReversalsWhat Are Divergences?
In this guide, we will explore the concept of divergence and how it can be effectively utilized alongside the Relative Strength Index (RSI), one of the most popular momentum indicators in technical analysis. Divergence occurs when the price of an asset moves in the opposite direction of an indicator, such as the RSI. Understanding RSI divergence can be a powerful tool for identifying potential trend reversals or continuations. In this guide, we'll delve into the various types of divergence that can occur with the RSI and how to incorporate them into your trading strategy.
Types of Divergences?
There are three primary types of divergence: bullish, bearish, and hidden divergence. Each signals a distinct market condition and potential outcome, and understanding these nuances is key to using divergence effectively in your trading.
1. Bullish Divergence Bullish divergence happens when the price of an asset makes a lower low, while the RSI forms a higher low. This indicates that although the price is declining, momentum is weakening. The failure of the RSI to confirm the new low in price suggests that selling pressure is diminishing, potentially signaling that a reversal to the upside could occur. Essentially, the market is losing its downward momentum, setting the stage for a potential bullish move.
2. Bearish Divergence Bearish divergence occurs when the price forms a higher high, but the RSI forms a lower high. This indicates that although the price is rising, momentum is weakening. It suggests that the uptrend may be losing steam, signaling that a potential reversal to the downside could be on the horizon. As the price continues higher, but the RSI fails to confirm the new highs, it may indicate that the market is becoming overextended and ready for a correction.
3. Hidden Divergence Hidden divergence differs from regular divergence in that it signals a continuation of the existing trend, rather than a reversal. It typically occurs during pullbacks or retracements in a strong trend. Hidden divergence can appear in both uptrends and downtrends, providing traders with an indication that the prevailing trend is likely to continue after the short-term retracement is over. This type of divergence serves as a confirmation of trend strength and helps traders stay in profitable positions during market pullbacks.
Why Are RSI Divergences a Powerful Tool?
RSI divergence is a powerful tool in trading because it offers early insights into potential trend reversals or shifts in momentum before these changes are fully reflected in price movements. By recognizing divergence, traders can anticipate shifts in market sentiment and make timely decisions. One of the main reasons RSI divergence is so effective is that it serves as an early warning system. It signals when the momentum behind a price trend, whether up or down, is starting to weaken.
For example, in a strong uptrend, if prices continue to make new highs, but the RSI fails to reach new highs, this could signal that the buying momentum is losing strength, even though the price is still rising. This divergence indicates that a reversal or pullback might be imminent, allowing traders to exit their positions or prepare for a potential shift in market direction. Understanding this early warning can provide traders with an edge, helping them avoid being caught in the late stages of a trend and positioning themselves ahead of a change.
How to Trade RSI Divergences?
When the price makes a higher high but the RSI fails to confirm with a higher high, this is known as bearish divergence. While this situation suggests weakening momentum, it doesn’t necessarily mean a correction is imminent. The price may continue to rise for some time, and eventually, the RSI could catch up and make a higher high in line with the price action. Essentially, the market could remain in an uptrend, and the RSI could still align with the price over time.
This highlights the importance of not jumping to conclusions solely based on RSI divergence. Divergence can act as a useful warning, but it should not be relied upon as a definitive signal of a trend reversal. To increase the reliability of the signal, traders should wait for additional confirmation, such as a candlestick pattern indicating a potential trend reversal. Candlestick patterns like engulfing patterns, doji candles, or shooting stars at key support or resistance levels can provide stronger evidence that the trend may be about to change.
Therefore, it’s wise to wait for a more comprehensive confirmation from price action before making a move, rather than acting on divergence alone. Combining RSI divergence with other technical tools, such as candlestick patterns or chart patterns, can help increase the accuracy of your trade decisions.
Conclusion:
Divergence is a powerful tool that provides valuable insights into potential trend reversals or continuations. By understanding the different types of divergence and knowing how to identify them, traders can make more informed decisions. However, divergence should always be used in conjunction with other technical analysis tools to enhance the accuracy of your strategy. With practice, patience, and proper risk management, divergence trading can become a profitable strategy for identifying key market turning points. Whether you are seeking trend reversals or confirming ongoing trends, RSI divergence can be an essential component of your trading toolkit.
Thanks for your support.
- Make sure to follow me so you don't miss out on the next analysis!
- Drop a like and leave a comment!
“BTC Fails Breakout and Slips Into Bearish Trap”Bitcoin couldn’t hold above key resistance and broke down from its rising structure. Sellers are stepping in—watch this zone closely as momentum shifts bearish.

BITCOIN Outlook: Watch for a Drop Toward $85100COINBASE:BTCUSD has reached a key resistance level, an area that has been a key point of interest where sellers have regained control, leading to notable reversals in the past. Given this, there is potential for a bearish reaction if price action confirms rejection, such as a bearish engulfing candle, long upper wicks or increased selling volume.
If the resistance level holds, I anticipate a downward move toward 85,100$, which represents a logical target based on previous price behavior and market structure.
However, if the price breaks above this zone and sustains above it, the bearish outlook may be invalidated, leading to further upside.
Just my take on support and resistance zones, not financial advice. Always confirm your setups and trade with solid risk management.

btc in wave y of a long term expansionWaiting for this triangle to break. going to take some time. hope x there, but might go abit lower. safe until a lower high tho. good trading!

Bitcoin Eyeing a Breakout After Consolidation!BTC is forming a potential bullish setup after a period of tight consolidation within a falling wedge. Price is attempting to reclaim structure above key resistance, with the wedge breakout suggesting momentum could shift upward. If volume supports the move, bulls may regain control, making this zone critical for confirmation.

Is BTC ready to move to 66k?I honestly hate to say it but BTC looks like its about to breakdown to 66k. Looks like a symmetrical triangle on declining volume almost ready to move.
The Trump Tariffs are the culprit of course and tomorrow 10 percent tariffs will hit across the board. On the 9th, heavier tariffs will hit. Price action will be determined by these regulations. I hope that a lot of countries renegotiate them and actually turn these things into bullish news but I'm very doubtful. I think its more likely that these hit and take us lower. Stay vigilant
[BTCUSD] 2025/04/04 Next trend for BTCUSDThis figure show you next trend of BTCUSD.
The price action will be sideway around 76k-84k in 4-8 week. After that the price action go up.

Bitcoin (BTC/USD) Trade Setup & Analysis🔹 Trend Analysis:
📉 The chart shows a downtrend followed by a reversal attempt.
📈 The price bounced off a support zone and is moving upwards.
🔹 Indicators:
📊 The 9-period DEMA (83,805.38) is slightly above the current price, acting as a resistance level.
🔹 Trade Setup:
🟢 Entry Zone: Around 82,943 (Current Price)
🔴 Stop-Loss: 81,183.22 ❌ (Below support level)
🎯 Target Point: 85,563.52 ✅ (Upper resistance level)
🔵 Strategy: The trade anticipates a price dip before

BTC SHOWING DIVERGENT STRENGTHStocks had their worst one day drop in 4 years - and Bitcoin actually printed a green candle, showing incredible relative strength. On a day where tech dropped over 5%, you would have expected a 10%+ drop from Bitcoin, but it did not happen. Is Bitcoin finally decoupling?
As for the technicals…
Bitcoin continues to coil tightly inside a large symmetrical triangle on the daily chart, printing higher lows and lower highs as volatility compresses. After a strong rejection from both the 50-day and 200-day moving averages earlier this week, price found support once again on the ascending trendline – buyers are clearly defending that level.
Volume has remained muted during this consolidation, which is typical for a pattern like this. But remember: triangles are neutral until they break. This setup is approaching its apex, meaning a decisive move is likely coming soon.
Watch for a break above $88,000 to signal a potential bullish breakout – or a drop below the rising trendline to flip the script. Until then, it’s all about patience.

BTC/USD 30Min PairMY looking at a potential short-term trade setup for Bitcoin:
Buy Entry: $84,500
Target: $87,000
Potential Gain: $2,500 per BTC (~2.96%)
Make sure to consider:
Stop Loss: Important to define—perhaps around $83,000 to manage risk?
Volume/Trend Confirmation: Is price action supporting upward momentum?
News/Events: Check if any macro or crypto-specific events could impact price soon.
Want help with chart analysis or setting up a full trade plan?

KEEP TRADING SIMPLE - BTCGood Morning,
Hope all is well. BTC also running the bullish pattern that the rest of the crypto market is. Trend change is in site on the daily which is what I use to plan my swing trades. I use the hourly for entries and exits.
Again waiting for confirmation on the hourly support to place my next swing trade.
Thanks!
