How to Build a Super Pitchfork with Reaction & Trigger LinesIn this educational video tutorial, I guide you through the process of setting up a Super Pitchfork using the Bitcoin daily chart. This method is inspired by Patrick Mikula’s work in " The Best Trendline Methods of Alan Andrews. "
I demonstrate how to:
- Create and project reaction lines
- Generate bullish and bearish trigger lines
- Apply a personal timing technique for pitchforks based on Michael Jenkins’ methods by squaring significant pivots to the median line, reaction lines, and upper parallel to produce time-based reaction points anticipating potential market turns.
This walkthrough is for traders who already have a foundational understanding of pitchforks.
Inspired by the work of Patrick Mikula, this is how I personally apply and expand on the Super Pitchfork method in my own charting.
BULLUSD trade ideas

It is in a sideways oscillation trend. Sell @ 85500Currently, the BTC market is clearly in a sideways trend 😶, with the price fluctuating between 83,000 and 86,000, offering trading opportunities 🤝. Here’s the analysis: 👉
Market data shows that the BTC price has been repeatedly supported around 83,000 recently 😏. Last week, when it hit this level, trading volume spiked, signaling strong buying. The KDJ indicator shows oversold conditions, hinting at a potential short - term rebound 🚀. However, 86,000 is a tough resistance. Multiple breakout attempts failed, and selling pressure grows near this level 😣. Per the Bollinger Bands, 86,000 is close to the upper band, likely triggering a pullback⬇️
Moving Average System: The 5-day moving average and the 10-day moving average are intertwined, just like an entangled rope 🧵, unable to clearly indicate the trend direction. Their repeated crossovers fully demonstrate that the market is in a state of disorderly fluctuations. 👉
💰💰💰 BTCUSD💰💰💰
🎯 Sell@85500 - 85000
🎯 TP 84000 - 83000
Traders, if you're fond of this perspective or have your own insights regarding it, feel free to share in the comments. I'm really looking forward to reading your thoughts! 🤗
👇The accuracy rate of our daily signals has remained above 98% within a month! 📈 We sincerely welcome you to join our channel and share in the success with us! 🌟

U scared, I'm eyeing $100k by May.What beautiful price action.
We are going higher.
disagree if you want.
But you should probably hedge that viewpoint, with a bullish bet.
BALLA JI!
WE WILL WIN.

Bullish bounce off pullback support?The Bitcoin (BTC/USD) has bounced off the pivot and could potentially rise to the pullback resistance.
Pivot: 83,260.07
1st Support: 80,469.31
1st Resistance: 88,484.86
Risk Warning:
Trading Forex and CFDs carries a high level of risk to your capital and you should only trade with money you can afford to lose. Trading Forex and CFDs may not be suitable for all investors, so please ensure that you fully understand the risks involved and seek independent advice if necessary.
Disclaimer:
The above opinions given constitute general market commentary, and do not constitute the opinion or advice of IC Markets or any form of personal or investment advice.
Any opinions, news, research, analyses, prices, other information, or links to third-party sites contained on this website are provided on an "as-is" basis, are intended only to be informative, is not an advice nor a recommendation, nor research, or a record of our trading prices, or an offer of, or solicitation for a transaction in any financial instrument and thus should not be treated as such. The information provided does not involve any specific investment objectives, financial situation and needs of any specific person who may receive it. Please be aware, that past performance is not a reliable indicator of future performance and/or results. Past Performance or Forward-looking scenarios based upon the reasonable beliefs of the third-party provider are not a guarantee of future performance. Actual results may differ materially from those anticipated in forward-looking or past performance statements. IC Markets makes no representation or warranty and assumes no liability as to the accuracy or completeness of the information provided, nor any loss arising from any investment based on a recommendation, forecast or any information supplied by any third-party.

88.5KHappy Easter,
So, our bullish trade is started well. But for now we wouldn't consider too extended targets. Based on AB=CD that we have on 4H chart , next extension is around 93K.
But here is a tricky moment exists and it relates to the H&S shape and strong 87-89K daily resistance. The point is that the right arm is yet to be formed, and it could be started right around 88.5K 1H chart targets.
That's why we're focused on just near standing targets. If Somehow, BTC will jump above 90K, then, the different scenario could appear. But for now we think it would be better to not take more risk and try to extract as much as good result from current positive position.

BITCOIN BULLISH TO $114,000 - $116,000In Q1 2025 I said I expect a retracement back towards $86,000 - $78,000 as Wave IV retracement.
BTC has now hit our Wave IV target. So according to my report & analysis, our next target is Wave V. Priced around the $114,000 region.
Market Structure Invalidation: $74,450❌

Bitcoin Getting Ready To Bounce AgainLooking good....looking good. Bitcoin is setting up one last time to test and try to break res line of $87600 . Within the next 12 1hr candles (if not sooner) it should start moving UP. It would be nice to see it drop fast to get rid off all those Long stop loss in the GETTEX:82K area then bounce quickly to pick the power needed to go and break the $87600 res line. After that move is printed and tested the $87600 res line it will pullback and if it doesn't print a new lower low then the new Daily and Weekly uptrend direction will be confirmed. Buckle up ladies and gentlemen we are heading for another wild ride.

BTCUSDbuying btcusd
sl 84035
tp 109000
1% risk each trade
like an follow
long on btcusd
breakout trade

Analysis of the BTC Market Situation and Trading RecommendationsIn terms of the daily K-line of BTC at present, the highest price has reached 85,800, and the lowest price is 83,600. The price is still suppressed by the strong EMA60 trend line, with the resistance level at 86,300. The support provided by the EMA30 below is also very strong, and the support level is at 83,700. The overall trend shows a contracting trend. Given that the price has remained at a similar position on the trend line for several consecutive days, this situation is not common in the market. Therefore, there is a possibility that the main funds will take this opportunity to launch an upward impact. If the price fails to successfully break through the resistance level of 86,300, there is a high probability of a reverse plunge in the market. From the perspective of technical indicators, the MACD indicator has continuously increased in volume, indicating signs of capital inflow. However, the K-line shows a divergent state due to facing strong pressure. The Bollinger Bands are in a sideways state. Currently, the K-line is at the middle band at 82,850 but has been unable to make an upward impact on the upper band's resistance level of 88,200. In this situation, whether it can effectively break through the box resistance level of 86,250 has become the key to the market trend.
On the four-hour K-line chart, the characteristics of the top structure are remarkable. The K-line continues to move sideways above the trend line. At the same time, the trend indicators show an upward alternating diffusion trend. This kind of top divergence structure has frequently appeared in past market conditions. At this time, the MACD indicator has decreased in volume and is moving downward. The DIF and DEA indicators are also diffusing downward at a high level. However, the K-line is moving upward in divergence from them. The Bollinger Bands are in a contracting state. Pay attention to the upper band's resistance level at 85,700, and the lower band's support level is at 82,700. The current contracting market is still continuing, and the top divergence situation is becoming more and more serious. Based on this market situation, before the box is broken, investors can consider conducting swing trading. Once the box is broken, determine the subsequent investment direction according to the new market pattern.
BTC Trading Suggestion:
buy@83000-83500 tp:84500-85500
sell@86500-87000 tp:85500-84500
Investment itself doesn't carry risks; it's only when investment is out of control that risks arise. When trading, always remember not to act on impulse. I will share trading signals every day. All the signals have been accurate without any mistakes for a whole month. No matter what gains or losses you've had in the past, with my help, you have the hope of achieving a breakthrough in your investment.

What factors could drive Bitcoin(BTC/USD) to reach the $68KGiven the current market conditions, Bitcoin has not managed to establish a new high in its recent upward movement. Various factors, including uncertainty regarding upcoming economic changes, reduced liquidity, the focus of financial institutions on the decline of stock markets, and the market's inability to react to sudden shifts, have contributed to the lack of a clear directional trend.
However, based on the presented analysis and chart review, it is anticipated that Bitcoin will reach the level of $68,000 in the coming weeks, paving the way for the initiation of a strong bullish trend. This upward movement is expected to first drive Bitcoin's price to approximately $130,000, and after a brief correction, the upward momentum may continue, potentially pushing the price to levels as high as $179,000.


BTC has upside chances until it holds above 81K areaMorning folks,
So, picture barely has changes since our last discussion. Right now we do not see any ready-to-trade setups. But suggest some bullish support to the market. After major XOP target has been reached - BTC has not dropped but remains in tight consolidation. This is more a bullish sign.
In general, we could suggest here a kind of reverse H&S shape. It makes us think that until BTC price is above ~ 81K area, it keeps chances on upside breakout. Drop below 81K will lead BTC back to the previous lows.
So, if you would like to buy - try to do this as closer to the lows of consolidation as possible. We consider no shorts by far.

Bitcoin: Shooting Star Breaks Wedge, Bearish Bias BuildsDownside risks appear to be growing for bitcoin with Tuesday’s shooting star candle triggering a bearish break of the rising wedge it had been sitting in over the past week.
Shorts could be established on the break with a stop above Tuesday’s high for protection. Some may opt for the 200DMA as a trade target, but the preference would be to look for a return to the lows beneath $75,000 hit last week.
The neutral momentum picture is also showing signs of turning bearish, with RSI (14) breaking its uptrend as a result of the latest pullback. While RSI is trending higher, it remains in negative territory, indicating downside momentum is only lessening—not reversing entirely.
Good luck!
DS

BITCOIN (BTCUSD): More Growth is Coming
Bitcoin is positioned very bullish after a confirmed breakout
of a minor daily horizontal resistance.
We see a positive reaction after its retest.
I think that the price may reach 87450 level soon.
❤️Please, support my work with like, thank you!❤️

Long trade
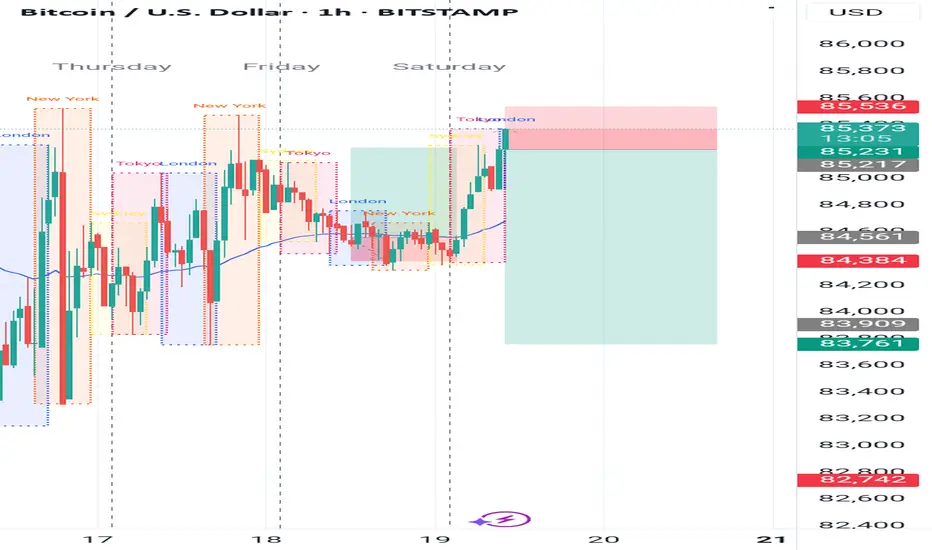
🚀 Trade Breakdown – Buyside (BTC/USD)
📅 Date: Saturday, April 19, 2025
⏰ Time Observed: 9:26 AM (NY Time)
Pair: BTC/USD
📈 Trade Direction: Buy (Long)
🕒 Entry TF: 2-Minute
📊 Strategy: Supply & Demand Narrative
Trade Parameters:
Entry: 85,412.16
Take Profit (TP): 85,853.24 (+0.52%)
Stop Loss (SL): 85,288.58 (–0.15%)
Risk-Reward Ratio (RR): 3.59
Reason: This trade buyside trade is based on range-based logic, taking advantage of short-term volatility and liquidity pockets.
2min TF entry observation

BTC: Climbed High, Took a Breather, and Said ‘Let’s Keep Going’BTC 3D Technical Outlook
By SpicyPips
Upon analyzing the 3-day chart, we observe that BTC is trading within a well-respected ascending channel, which has held as dynamic support and resistance multiple times.
After reaching its all-time high of $109,637.53, price retraced into the Golden Zone (Fibonacci 61.8%–50%), a key area where buyers stepped in. BTC has since bounced back within the channel, indicating strength and continuation of the bullish cycle.
The current structure suggests a potential move toward our second target aligned with the 127.20% Fibonacci extension at $125,868.39, as long as the channel remains intact.
Capital protection should always come before profit — let risk management be your trading foundation.
Happy Trading,
SpicyPips

Bitcoin Getting Ready to DropNow that Bitcoin has entered the top area of the last stage of the 1hr UP move is time to analyze the chart again and the read is as follow. Within the next six 1hr candles price will start to drop to go and test the $83465 area then pause or make a failed little bounce to then continue lower to the 2nd stage which is the $82645 once it gets there we'll take another look .

BTC/USD Operation Strategy AnalysisCurrently, the market is approaching the previous high (84994), favoring a “false breakout” pattern.
84200 although reasonable support, but the volatility is limited should be segmented take profit, such as to 84550 when the first flat 50%, the remaining single capital preservation tracking.

Bitcoin Elliott Wave AnalysisHello friends
On the Bitcoin chart, we see the formation of a complete Elliott wave pattern. These waves from 1 to 3 or C are quite clear and we can even count its sub-waves.
Now a 3-wave ABC has formed. We cannot be exactly sure that this is a complete zigzag because wave C can be extended and the price will fall further.
But we consider it wave 4 assuming that this zigzag is completed.
So we will wait for the formation of an upward wave in the form of wave 5.
The target is first $86,500 and then $88,000.
Good luck and be profitable.

April 17 Bitcoin Bybit chart analysisHello
It's a Bitcoinguide.
If you have a "follower"
You can receive comment notifications on real-time travel routes and major sections.
If my analysis is helpful,
Please would like one booster button at the bottom.
This is the Bitcoin 30-minute chart.
Nasdaq indicators will be announced at 9:30 in a little while.
The purple finger section on the left
is connected to the short->long switching section that was performed on the 16th.
* When the blue finger moves,
Bidirectional neutral
Short->long switching strategy or long waiting if it goes down right away.
1. 85,728.6 dollars short position switching / cut-off price when orange resistance line is broken
2. 84,595.8 dollars long position switching / cut-off price when green support line is broken
3. 86,871.5 dollars long position 1st target -> Good 2nd target
Today's 12-hour chart MACD dead cross is an ignoring strategy. Check if the purple support line deviates from the current position,
and from the 1st section of the green support line deviates,
even those who have been holding long positions since yesterday can operate at the same stop loss price.
If the short position entry section at the top comes down without touching,
the 2nd section at the bottom is the final long waiting section (6+12 pattern),
and if the rebound is not good in this section and it is pushed,
it may continue to fall to the 3rd section at the bottom due to the pressure of the 12-hour chart MACD dead cross.
Up to this point, please use my analysis article only for reference and use,
and I hope you operate safely with the principle trading and stop loss price.
Thank you.

Bitcoin short Elliott waves counts update Nothing much to say over here as I've already given analysis previously for Bitcoin. Just wave counts update.

BTC: The Decline in Early 2025#Bitcoin has been in a bearish trend since late Jan 2025. The structure of this decline appears corrective rather than motive, suggesting targeting ATH after this correction.
Below is the updated macro count along with the structure of the current corrective wave.
