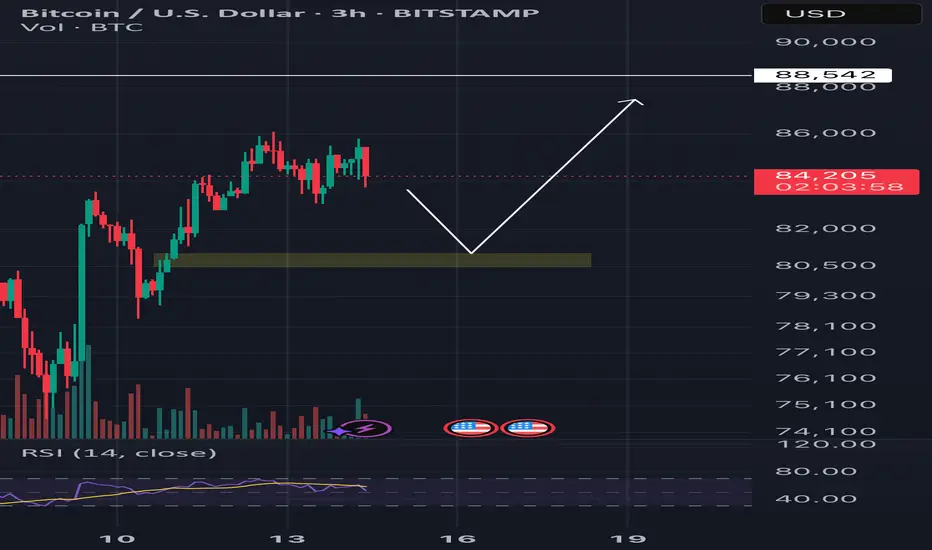
BITCOIN - Bullish Double BottomHello Traders !
The BTC price formed a double bottom pattern.
Currently, The neckline is broken !
So, I expect a bullish move🚀
______________
TARGET: 88700🎯
BULLUSD trade ideas

BTC WITH 1400+ BULLISH PIPSI missed the FALL but will not miss the RISE,
Let it btc rise after all christ has risen


BTCUSD 4H FORECAST PREDICTION Hello Guys I Hope you're all well
Hey there our Global forex community charts on btcusd on 4hTF looking for vertical zone on Monday our prediction was buy side and now seems going on top to bottom still running on our prediction as we say and we hope we can hit our target to this weekend
Hope you guys all well thanks

BTC BREAKING OUT!Bitcoin just printed a textbook breakout on the daily chart – pushing cleanly through descending resistance from the all-time high. The move came on increasing volume, which adds credibility to the breakout and shows buyers are finally stepping in with conviction. We need to see it hold and close the day like this for confirmation.
Price is now well above the 50-day moving average, which is curling upward, offering short-term support. This is the healthiest the chart has looked in weeks.
That said, we’re not out of the woods yet. The 200-day moving average is still looming just above, along with the key horizontal level at $88,804. A close above that level would break market structure and confirm a higher high – a bullish shift worth watching.
For now, momentum is clearly with the bulls, but the next 24–48 hours will be critical to see if they can seal the deal.

CHECK BTCUSD ANALYSIS SIGNAL UPDATE > GO AND READ THE CAPTAINEntry Point:👇🏼
Around $87,700 (marked by the blue zone just below the current price level of $87,576)
Take Profit 👇🏼
1. Take Profit 1: $87,200
2. Take Profit 2: $86,800
3. Last Target: $86,600
TECHNICALLY ANALYSIS SATUP ✅
FALLOW RISK MANAGEMENT ❤️

BITCOIN Will Go Higher From Support! Buy!
Please, check our technical outlook for BITCOIN.
Time Frame: 9h
Current Trend: Bullish
Sentiment: Oversold (based on 7-period RSI)
Forecast: Bullish
The market is approaching a key horizontal level 84,703.50.
Considering the today's price action, probabilities will be high to see a movement to 88,907.42.
P.S
Please, note that an oversold/overbought condition can last for a long time, and therefore being oversold/overbought doesn't mean a price rally will come soon, or at all.
Disclosure: I am part of Trade Nation's Influencer program and receive a monthly fee for using their TradingView charts in my analysis.
Like and subscribe and comment my ideas if you enjoy them!

Long trade opportunity is coming Bitcoin price is starting to look interesting for a long trade opportunity.
Currently Bitcoin is in the range bound between 75,000 approx and 89,500 aprox (blue rectangular box in the chart).
EMA 200 is horizontally running through in the middle of the range and EMA 21, 55 and 200 are starting to get bunched up together. I really like this set up because when this happens, it is often followed by a strong directional move. All you need for now is patience, which is the hardest thing to do.
I will open a long position if the following conditions are met:
1) Daily MACD and RSI will move into the bull zone and they are clearly pointing to the upside.
2)The price will move and close above the descending trendline.
3) EMAs are going to start to spread out and line up properly (EMA 21>55>200 for long)
For whatever reasons, if I feel I need to be more cautious, I might wait for the price to move and close above 93,000 (above orange rectangular box area) because it is a high liquidity area and I think a lot of price manipulation might happen.

Shorting Analysis on Bitcoin - Fxdollars- {15/04/2025}Educational Analysis says that BTCUSD may give countertrend opportunities from this range, according to my technical analysis.
Broker - BITSTAMP
So, my analysis is based on a top-down approach from weekly to trend range to internal trend range.
So my analysis comprises of two structures: 1) Break of structure on weekly range and 2) External pushback to fill the remaining fair value gap
Let's see what this pair brings to the table for us in the future.
Please check the comment section to see how this turned out.
DISCLAIMER:-
This is not an entry signal. THIS IS ONLY EDUCATIONAL PURPOSE ANALYSIS.
I have no concerns with your profit and loss from this analysis.
I HAVE NO CONCERNS WITH YOUR PROFIT OR LOSS,
Happy Trading, Fx Dollars.

THOUGHTS ON BTC/USDBTC/USD 1D - As you can see price has traded us down and into a level of Demand and has shown some signs of potentially reversing back to the upside. In order for us to have confirmation of this we need to see a relevant break in structure.
I have gone ahead and marked out the last protected high on the 1H timeframes within this bearish corrective wave, once we see a break in that we have the confluence we need.
As we all know a break in the last high would confirm to us that the bearish structure we are seeing at the moment within this corrective wave has finished an a new trend to the upside is ready to take place.
It confirms that enough Demand has been introduced into the market to flip the S&D balance. Giving us enough confirmation to look to take this market long once again, as we know there are big prospects for BTC and the prevailing trend backs that.

BTC Followed Our Plan As UsualBTC as usual followed our plan so perfectly. In MINDS also i reminded everyone about this move. Now can book nice profits here and stay tuned for our next Update

Bitcoin may see $67k - Monthly timeframeHere is the monthly chart of the bitcoin. Based on price action analysis, we have a broad bull channel. We can see 2 price action signs here:
1- Second leg in the bull channel, we call it second leg trap
2- A climactic move to the top of the channel (biggest bull bar late in the trend)
Given the context, there is 60% chance that we see the bottom of the climactic move, which is $67,000.
The pessimistic perspective is that the bitcoin may see and test the bottom of the channel, around $50k.

A Bear Cycle has been started. BTC is now entering in it's bearish cycle. So avoid buying and start shorting/selling it.

BTCUSD ORDER BLOCK 19042025This is just for my own reference.
Wait for possible BOS, COCH for confimation. No Confirmation No Entry.

BTC technical forecast It will drop unit 82.000Next target don't miss it
Not financial advice trade and menege your owner risk

BTCUSD - Buy Trade CallOn daily TF, since 20 Jan 2025 BTC was in downtrend following regression channel.
MACD also was mostly indicating short trade. However, now MACD is showing likely upward movement. Moreover, Williams Alligator also suggesting a likely change of trend to bullish.
Coupling that with USA falling stocks, BTC is a gaining attraction of US investors.
Therefore, one may take a BUY trade now or technically very correct entry would be after price crosses the resistance level ($ 88,950) which is also previous Lower High.

Bitcoin is heading into its final low before bull market?Bitcoin got rejected at the 1-Day Cycle top and is now pulling back toward the 1-Day Cycle lows.
While most investors are getting bored and slowly shifting their attention elsewhere, crypto is quietly consolidating and gearing up for a BIG move...
Will we break above $100K, or are we heading into a recession and full-on bear market mode?
Next week will be a decisive one for the entire crypto market this year.
If Bitcoin manages to hold above $77,000 as the 1-Day Cycle hits Day 20, we could be on the verge of a run toward $100K. But if we drop below the previous 1-Day Cycle low, trouble’s coming.
Confused? Just check out this chart.
It’s easy to lay out both the bullish and bearish cases—but it’s a whole different game to quantify, commit to a position, and wait for the more probable outcome to play out.
Which scenario is more likely?
In short: the green one . Here’s why:
The 2-Week Cycle has spent over 4 weeks below 20, completely crushing bullish sentiment.
The 1-Week Cycle has been below 20 for over 2 months—the longest stretch in the past 5 years.
The 3-Day Cycle hasn’t fully reset, but reversed to the upside last week due to positive price action.
We’re on Day 46 of the 60-Day Cycle, and price has been holding up well. We’ve tested the $80K zone a couple of times, and Bitcoin still seems eager to push higher.
For the first time in a while, there are more bears than bulls (according to Polymarket).
On that note—check the Polymarket predictions

Bitcoin’s Bullish Path: Eyeing the Order Block ZoneIn my personal technical analysis, Bitcoin appears poised to revisit the order block zone between $73,000 and $69,000. If price reacts strongly from this area, following the blue trendlines I've drawn, it could resume its upward trajectory toward the top of the channel. This bullish momentum has the potential to play out through the end of 2025.

Global Market Overview. Part 4: BITCOINPreliminary Context — See Above
Bitcoin: Euphoria, Fear, and a Foundation That Withstood It All
If we were to describe the mood of the crypto market over the past few months in a single phrase, it wouldn't be just a roller coaster — it’s been a full-blown thrill ride, driven by geopolitics, news hype, and emotional burnout among participants. Public sentiment toward Bitcoin this year has swung across the entire spectrum — from wild excitement and $200K price forecasts after Trump’s projected victory, to total pessimism with claims like: “That’s it, Bitcoin’s going back to $20K — crypto is a scam.”
And, as is so often the case, both camps were wrong.
The market survived — not on hype, but on fundamentals.
I make no secret of the fact that I remain a Bitcoin optimist. Not because I want to believe — but because when you mute the media noise, one thing remains: the strongest macroeconomic foundation the crypto market has ever had.
Let’s be honest: it’s getting harder and harder to find a solid reason why Bitcoin should collapse back to $50K — let alone $20K. Strip away the emotion, and here’s what we’re left with:
What do we have, in fact?
1. Regulators are no longer suffocating the market — they’re participating.
The SEC has dropped major investigations into crypto projects, including Ethereum and leading DeFi platforms.
The U.S. Senate has approved legislation to create a national crypto reserve — for now, it’s based on confiscated assets, but it marks the first precedent of crypto being recognized as part of state strategy.
Meanwhile, the European Union has officially launched the MiCA regulatory framework, making crypto a fully legal asset class in the EU with clear compliance norms, a tax model, and open access to institutional clients.
2. Institutions are playing big.
Crypto ETFs have launched not only in the U.S., but also in Europe. This means one thing:
Pension funds, insurance companies, and hedge funds are entering the market.
The capital is not speculative — it’s strategic.
These are not "hot" retail dollars chasing tweets — they’re building portfolios for the long haul.
3. Exchanges are drying up. Whales are accumulating.
Bitcoin reserves on centralized exchanges are at historic lows.
This tells us:
Long-term holders aren’t selling.
Large players are moving assets to cold wallets.
Retail hype hasn’t kicked in yet — which, frankly, makes it a perfect entry point.
When the crowd starts buying, it’ll be too late.
4. Even a trade war couldn’t break the market.
The tariff escalation between the U.S. and China has hit global trade hard, triggering corrections across traditional markets. Yet despite that:
Bitcoin held strong above $70K, rising from the $110 levels.
This zone has become ironclad support — a sign that the market has matured.
There’s panic in the headlines, but not in the charts.
Even Wall Street veterans are cautiously suggesting Bitcoin may be a necessary hedge against fiat devaluation.
5. China is silent — for now. But if that changes...
Any positive signal from Beijing — even a hint at easing restrictions or partial legalization of crypto ownership — would cause an immediate surge. Because:
Chinese capital is waiting.
The tech infrastructure is already in place.
And if the government gives the green light, the market will relaunch overnight.
What do I think?
The current Bitcoin price range is a prime entry zone for medium-term positions.
The 70K–85K range is a fundamental accumulation corridor, where:
Strong hands are already in.
Weak hands have been shaken out.
FOMO and retail hype haven’t even started.
By Fall 2025, even modest optimism in geopolitics or trade could push the market to new all-time highs — not on hype, but on dry institutional demand.
Final thoughts
I’m not a fan of conspiracy theories.
But this setup is too clean to be a coincidence.
The crypto market has survived it all: bans, lawsuits, regulatory crackdowns, exchange collapses, hacks, FTX, LUNA, and every form of digital black magic.
But it's still here.
More than that — it’s quietly becoming a legitimate part of the global financial system. Without noise. Without asking permission.
While everyone else is talking panic — the market is already in an accumulation phase.
And those who understand the cycles don’t look to the news for validation.
They look at the fundamentals — and act accordingly.

Daily Price Action: Bitcoin BTC Thursday 4/17/2025In this video, we will be looking into the potential price action of BTC.

BTC STILL STRUGGLINGBitcoin continues to struggle with the 50-day moving average, currently acting as dynamic resistance. Price is hovering just below it, unable to break through cleanly, and the 200 MA remains overhead, adding additional pressure from above.
Market structure remains bearish for now – we’re still printing lower highs and lower lows. That structure won’t flip until Bitcoin can break decisively above $88,804, the last significant swing high from late March. A close above that level would mark a higher high and potentially signal a trend reversal.
Until then, it’s just a relief rally within a broader downtrend. The bulls need to reclaim key levels with conviction – otherwise, this could be a pause before another leg lower.

Triangle Breakdown & Entry After Rejection🔍 Trade Idea – Entry Plan:
Breakout Below the Triangle Support Line:
Wait for a strong bearish candle to break below the lower trendline of the triangle (support).
Ideally, the candle should close below the trendline with increased volume to confirm the breakout.
Pullback & Rejection:
After the breakout, expect a pullback to retest the broken support line (now acting as resistance).
Look for rejection signals at this level (e.g., bearish engulfing candle, pin bar, etc.) to confirm that the price is respecting the new resistance.
Entry:
Enter a short position after confirmation of the rejection.
Stop Loss: Just above the rejection wick or the retested resistance zone.
Take Profit: Based on previous support levels or measured move (height of the triangle projected downward).

BTC Bullish But Needs to RetestThe market had a selloff and is about to break highs in the upcoming months!
The current coming phase will be the mania phase, most people think the bull run is over, but it is not over just yet 🙂 #trustmebro
Bitcoin has a level at 81,100 to retest and will fly until June 2025.
This will sound absurd, but BTC to 854,000! There are big institutions sell orders at that level.
XRP - $54
HBAR - $50.26
LTC - $1800
DOT - $240
ETH - $8000