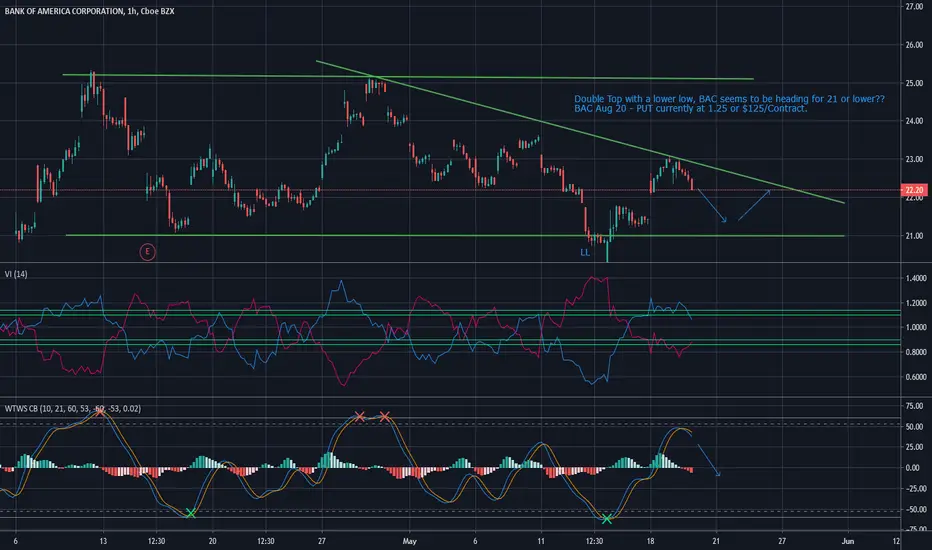
$BAC Possible PUT OptionIt looks like $BAC (and the banks) are set for a lower session, and we could see $BAC move towards $21.....lets see what happens!!
.....Current BAC Aug 20 - 20 PUT are trading at 1.25 and are up 12%......#FranklinCap.....If you would like to see more of this from Franklin Capital hit the LIKE button and Follow Us!...Thanks!
(PS for those that looked at the Air Canada BUY yesterday....a cool 23% came your way!)
BAC trade ideas

BAC - Update - Channel BottomedTargets above - Channel formed similar to many stocks in the market. Banks have had good volume past few days. Let’s see how long until we get to the top of the channel...

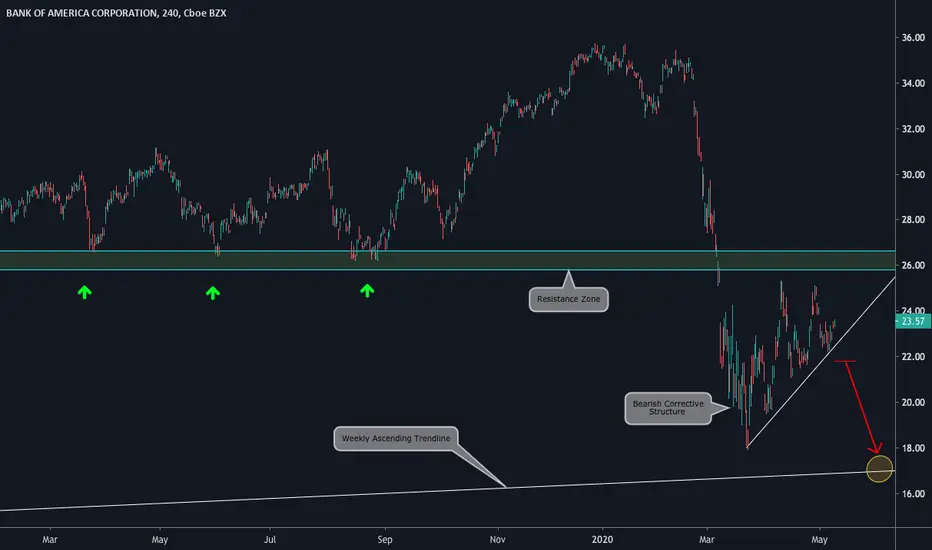
Bank of America: short vision4H Chart Explanation:
- Price broke the Support Zone (now Resistance).
- Price was on a Bearish Corrective Structure.
- It broke it and, now, it has potential to move down towards the Support Zone.
Weekly Vision:
Daily Vision:
Updates coming soon!

BACK FROM THE RISE!!!Hello everyone after a big correction of the BANK OF AMERICA started in January 2020 we can see that it has reached several important supports the first is the basic trend starting from 1983 we can see that it has just bounced on it in March 2020 which is not to be neglected then we can see that it corresponds with the support of the upward trend line starting from the last lowest (February 2009 and finally the Fibonaacci line of 50% which is a good sign of increase when the market bounced off this one.The geometry of this graph shows us an ascending triangle so i thin that the action of the BANK OF AMERICA should resume its rise over th next few months. In the event that the market breaks these supports the fall could be similar to that of 2009. Don't hesitate to give me your opinions and ideas. thank you all


Bank of America - BAC Technical AnalysisHold.
Wait the right signal to go long. Based on technical analysis there are not a lot of buy/selling signal so the best option is to Hold.
Fundamental Analysis (I did not find a lot of "good" news)
Might it be impacted by the 3 Trillion Bill??

BAC Can Drop Further Than Anyone Thinks & a Generational BuyThis name BAC may become the best DEEP VALUE BUY of the decade - Time will tell and we'll be updating as we go along. #stocks #trading

‘Bank of America my account got 6 figures’ 🎶So one price gap has been filled. One more to go. Let’s see how this goes.
The stock market is still not in the clear. I did long at the dip a few weeks back. If it goes lower I will purchase more. Airlines are important for the USA. They will not let China or other nations take over the aviation industry. The government has to bailout or create some new financial tool. The USA is king of financials.
In my perspective they will buy every share from the airline to prevent China from taking over.

Bank of America D1. Good perspectiveBank of America stocks collapsed, as did the entire stock market. But in the near future, the banking sector will be of great relevance. The quarantine period stopped most of the business, creating a crisis situation. Banks also suffered from this, having lost a large cash turnover. At present, the economy is beginning to slowly revive and business is restoring its activity, which will lead to increased activity of the banking system. Also, many businessmen will be forced to take loans, because not every business has been able to withstand the quarantine period financially, and it needs a financial incentive. This situation will increase the profitability of banks and will stimulate bank shares to grow. Bank of America is one of the largest US banks and one that sets the trends in the banking system of the whole world. He has great prospects in the near future.


Bank of America: short view4H Chart Explanation:
- Price broke an important Support Zone.
- It is currently on a Bearish Corrective Structure.
- If price breaks it, potential to move down towards the Support Zone.
Weekly Vision:
Daily Vision:
PERFECT BULLISH CONFIGURATIONEverything suggests on this BanK of America graph that a nice rise is preparing indeed all the concorde signal volume , breakout candles, pivot point as well as the breakage of the last fibonacci line found below the pivot point and which the first green candles took support. it is therefore possible to see a nice increase at the breal of the green line.


BAC - Ascending TriangleKeep an eye to see if we will get a breakdown or breakout. Don’t enter too early!! Could get caught in the wrong side. Green cloud support on the right will form slowly but can turn into overhead resistance if the price moves below. Ascending triangles are normally bullish, and take a few weeks to start forming. Can easily see the formation here.


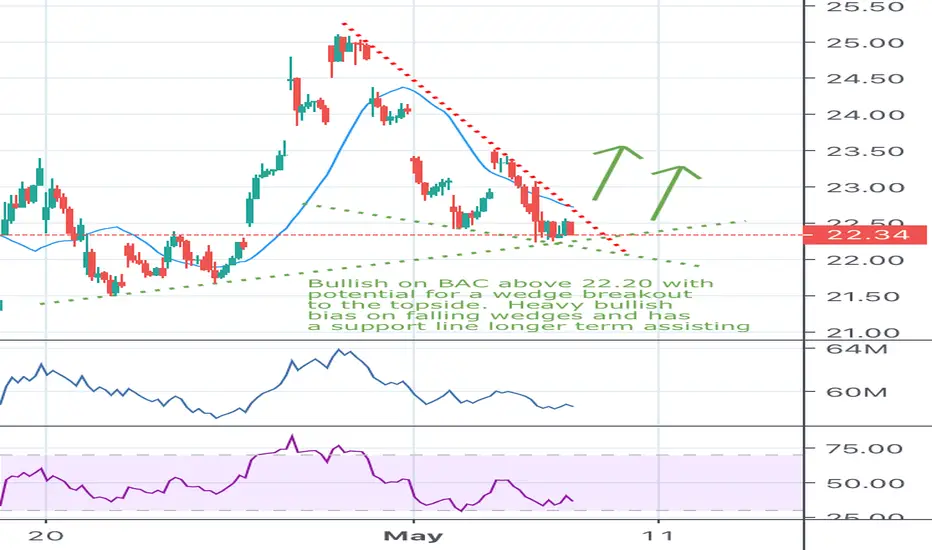
BAC near term bullishBAC is in a falling wedge but has been consolidating and building bullishness towards the bottom and I expect a breakout to the topside to occur - bullish above 22.20

#BankOfAmerica - One more low? #bac #BofA Maybe the low is in since 23.03.2020 but I think an other low should come.
The $19.59 must fall for a new low.
Greetings from Hannover
Stefan Bode

BAC 04.05.20 LongAsset and Time frame -BAC, 1H
Entry Price -22.6385
Exit(Stop Loss) -21.59
Exit(Take Profit) -24.94
RRR is 2.25
Technical Analysis -1H chart is bouncing off the confirmed trend line for the 4th time, price is also "sitting" on the -27.2 level, the price hasn't reached oversold on the 1H chart, and the 4H RSI is bullish.
What can be improved -
Conclusion & End of Trade -
