CitygroupCity has put a local or long term top. The move down will tell whether this is a short term or longterm top.
C trade ideas

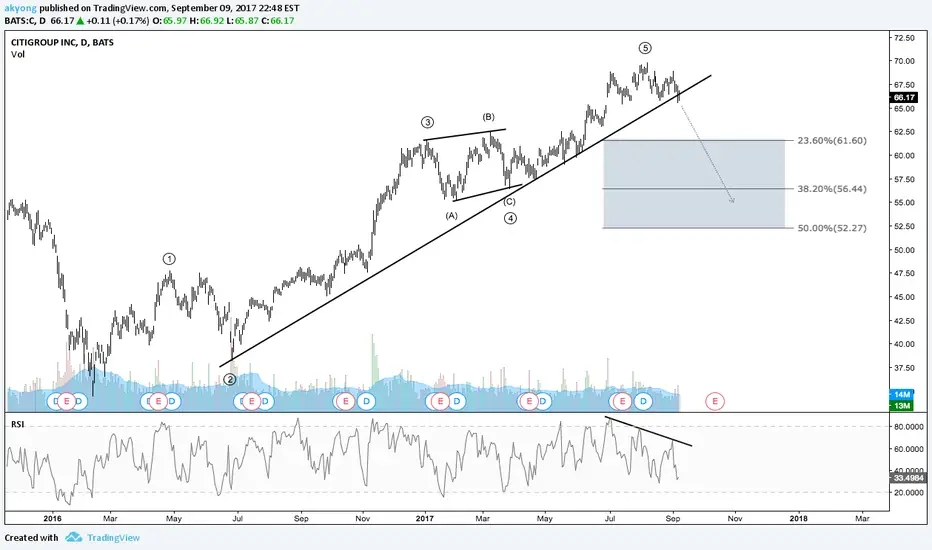
Citigroup - Expecting a short term correction to the downsideSince the start of 2016, price has been rallying in a 5-wave structure to the recent high at 69.81 earlier this year in August.
RSI has formed a divergence as well, giving us another confluence of a potential retracement lower from here.
We are expecting price to correct to the downside towards 61.60 or even lower towards 56.44 area in the short term before another move higher.
*Disclaimer - ensure that you have analysed the fundamental of this company and do your own due diligence before trading.
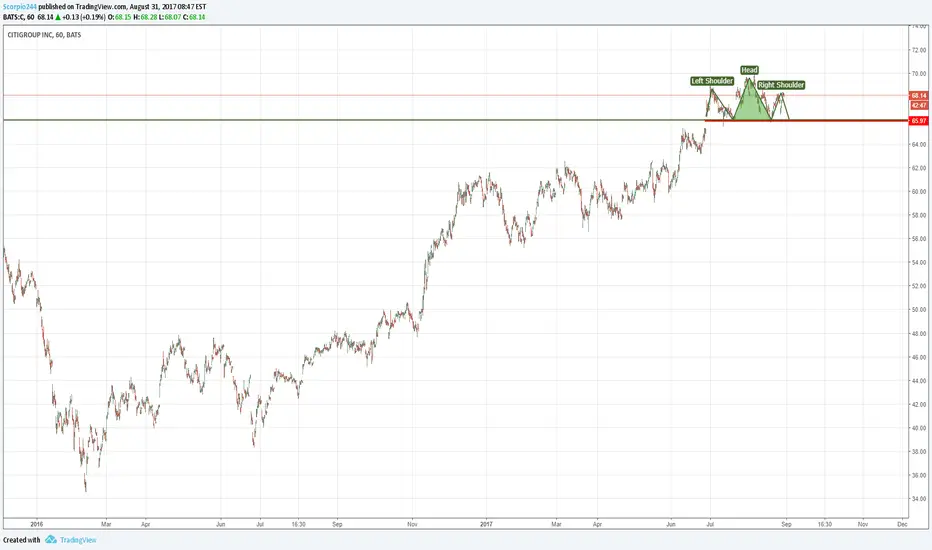
Citi bank analysisHere I will follow C using chart pattern and Elliott wave analysis.
H&S would be confirmed if neckline resistance broke. Lets see what will happen next.

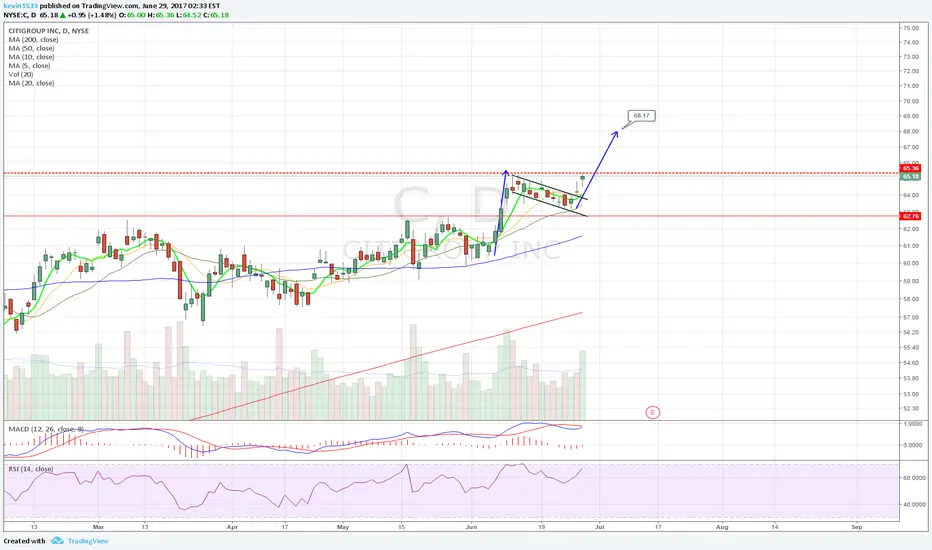
Long Position CitiGroupIt looks like we have a channel forming here. I entered in to a long term position @ 68.14. I like financials long term and I chose to play that using C.
If you like to trade it looks like you could get 8-10%+to the upside in the next 6-8 weeks.
I hold long term positions for 1+ years and re-evaluate actively.
Happy Investing!


Citigroup (C) still has a ways to runI'm simply posting this chart as a reminder how far Citigroup (C) has fallen since its 2008 highs. Rising long rates will benefit the banking sector as banks borrow short and lend long, keeping the spread. Even though the stock has doubled off the lows, it's still priced at 1.0x book (cheapest in the sector, JPM is 1.7x book) and Barron's thinks the shares could appreciate another 50%: www.barrons.com

ARBITRAGE SELL CITIGROUP BUY WELLS FARGOIN 12 MONTH HORIZONT THE BIGGEST PERCENTAGE GAP BETWEEN BIGGEST US BANKS.
ASSUMING BIG DOWN MOVE IN BANKING SECTOR ON DISAPPOINTING RESULTS AND FADING TRUMP TRADE MAY LEAD TO SELL OFF WITHIN BANKS WHICH SHOULD LEAD TO NARROWING THE GAP.
TIME HORIZONT OF THE BET 4-6 MONTHS


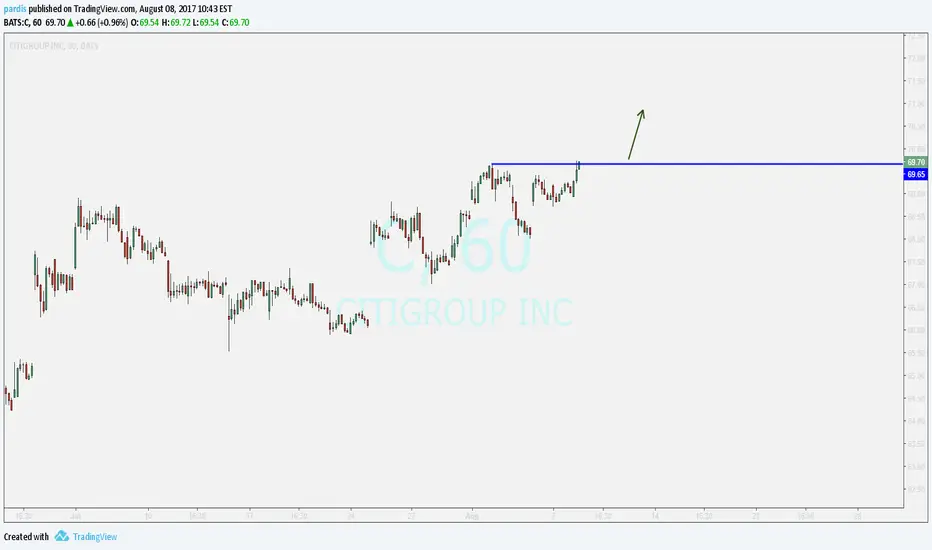
Citigroup Inc. $C - Channel Up Citigroup Inc. $C - Possible bullish price movement towards the resistance $68.70


FIrst TP is 84, this stock might ended the downtrend since 2006,FIrst TP is 84, this stock might ended the downtrend since 2006,
time to buy
missed the best entry though, first tp is 84. I am 95% sure this target will be hit.

CITIGROUP TEXTBOOK LONG SIGNALI really like this setup. Fundamentals are in favour of a long position.
I believe we are starting the next leg higher, it could take us in to 68-70$ area.
Blessings to you all.


C- Can You Real Trade This?Big companies which have taken a very large price action DUMP, last 8 years are hard to trade. Only way that I would consider trading them, would be on a day trading or weekly basis only. Just because a company has huge volume of trading per day, over 20,000,000 and market cap of 178.97B does not tell much. Only, tells me is that they are to big to fail. I stick with companies for longer trades, with track record of stability and positive news. Good luck with this. If you want to take a long approach, with short trading, it might work for you. They do have a dividend and option possibilities, if you like this company.

$C longterm breakout to the upsidegreat multi year breakout for Citi bank. It appears the entire sector bear trapped this week of 6/5 and is now moving to higher prices. These stocks are known to chop so I ease into the position as price confirms my long bias


C:Potential Gartley Pattern and the Vegas ChannelThe potential Gartley pattern will complete at 51.5-52.0 levels and the D of the AB=CD pattern also locates at this zone.
Meanwhile the market is moving in the Vegas channel.
So it may be good to sell short at 51.5-52.0 levels when bearish candles appear.
SL:above 57
TP1:47
TP2:40 and further more

