forecasting FORD MTR in 1D Hello to all investors, according to my previous studies and according to my experience as a trader, I see a good investment opportunity with a high probability of success, the details are reflected in the graph
F trade ideas

$F - Ford vs. Fourier$F - is no way trading according to it's fundamentals and looks like it is being manipulated by the big guys.
In the past, my script was able to predict short squeeze (SQ), but there are no BUY or SELL labels for the last five years, which is an indicator of fishiness.
But Fourier is drawing a clearly bad path for the Ford, though they both start with F, looks like $F the one that is about to be F@#ked.

F swing short ideaHey all, I've posted before on F and the fact that it is repeating a pattern it has made post-2008. The pattern would suggest it is about to fall. Moreover, if you simply look to the blow-off top it had in January of this year, you'd see a similar look as well. Moreover, the stock is stuck in a strong downtrend with bearish context, and I believe the market is due to move lower. I'm currently short on this name with a cost basis just above $16/share, but I think it is still a solid short here; I am in full size on this position. If anything, watch how fall this name can fast when it confirms below $15.15/share- basically the only level holding this stock from freefall.

Ford breaking out on earnings.Ford posted some good earnings last week and you can see its had a nice bump in the price. Looks a bit too hot at the moment looking at the RSI but could be worth adding to your watchlist. Bit of upside if it continues to rally.

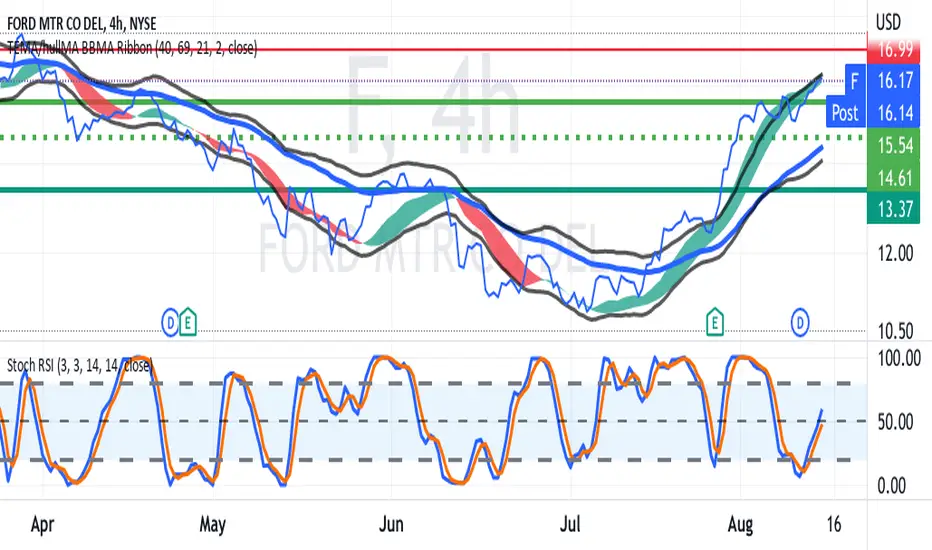
F AnalysisPrice has mitigated the bearish POI at 16.28, and took liquidity at 16.57 without closing above. We see volume decreasing on the up move. From here, I'm expecting price to drop to the bullish POI at 13.14.

Ford - next support levelBeautiful support level for short term investors.
Target : Previous high
Exit at first reversal signs.

FHello everyone, the price has run out, which is 16.21
It is expected that it will drop to the level of 15.83 to make a retest and Maha to rise again to the level of 17.59, and from here it finds a strong resistance area.
For more details, link to the previous idea below

F LONGI wanted to show an updated chart for Ford. I do see it pushing up some more and staying on the yellow trend line I drew. If it closes above 16.59, on the daily chart, it will most likely will go to $19.12. It it closes under $16.59, we can see a little downtrend back to $15.50. Im neutral for now. I'll be watching to see where this closes today.

ford channelThe company maintained its outlook for the balance of 2022, implying an increase in operating income of between 15% and 25% over 2021 levels.

FORD Swing Trade after REVERSAL in JulyNYSE:F
F is trending up while TSLA heads down
US Legislation to support EV purchases with tax credits is helpful
GM's financial troubles are helpful.
Chart shows upgoing BB/EMA channels
and mid-range RSI with recent K/D crossover.
Both suggest a potential swing entry. Depend on unforeseen
changes in the automotive market or the market at large
and a recession versus continued uncertainty, F could
the uptrend for several months also made for the
opportunity to trade call options.
Trade often. Trade well !
#ford powerful twisted continuedHere and there markets are showing up positive signals of what near future will bring.
big markets are ready to suck in more money now.
Here we have a nice burst of price increase for Ford , that we expect to follow up to 18,45 USD by this cycle, with safenets that would suggest 17,90 target for us.

F:Not out of woods yetFord
Short Term - We look to Sell a break of 15.43 (stop at 16.33)
We are trading at overbought extremes. A lower correction is expected. A break of 15.50 is needed to confirm follow through negative momentum. A break of support at 15.50 should lead to a more aggressive move lower towards 13.00. Further downside is expected.
Our profit targets will be 13.04 and 12.00
Resistance: 16.00 / 18.00 / 21.00
Support: 15.50 / 13.00 / 11.00
Please be advised that the information presented on TradingView is provided to Vantage (‘Vantage Global Limited’, ‘we’) by a third-party provider (‘Signal Centre’). Please be reminded that you are solely responsible for the trading decisions on your account. There is a very high degree of risk involved in trading. Any information and/or content is intended entirely for research, educational and informational purposes only and does not constitute investment or consultation advice or investment strategy. The information is not tailored to the investment needs of any specific person and therefore does not involve a consideration of any of the investment objectives, financial situation or needs of any viewer that may receive it. Kindly also note that past performance is not a reliable indicator of future results. Actual results may differ materially from those anticipated in forward-looking or past performance statements. We assume no liability as to the accuracy or completeness of any of the information and/or content provided herein and the Company cannot be held responsible for any omission, mistake nor for any loss or damage including without limitation to any loss of profit which may arise from reliance on any information supplied by Signal Centre.

FORDContinue to our analysis for Ford
Price cross 16$
Waiting for the Retest on the channel to buy again

FORD F SWING TRADE SETUP DOUBLE BOTTOMNYSE:F
From the 2H chart, F had a double bottom on June 17th and July 6, with the former being the day SPY bottomed.
Now in a solid uptrend buying volume through the recent earnings.
Fundamentally earnings were favorable.
F has run up 30% in the past month.
I am thinking of a long trade once resistance at 16.11 is broken.

FAfter the price has implemented what I expected, I will leave the previous idea below
I find that the price is trying to descend to make a retest of the new trend so
I expect the price to drop to reach the level of 14.64
And then it rises to reach the level of 16.21 after retesting 15.83
Until it reaches the strong resistance area (17.59:17.90)

Ford Uptrend off 100 MAWatching how price finds support off the 100 MA. Often times uptrend needs to bounce off support and continue the move higher.

Is Ford ticker following the uptrend of the Pitch Fork?Let’s see if the current uptrend follows the support / resistance predicted by the pitch fork.

Ford's stock NOT YET
Today's market reaction to the first-quarter report gives long-term investors a better opportunity to buy Ford's stock to help diversify a portfolio of EV investments. The company maintained its outlook for the balance of 2022, implying an increase in operating income of between 15% and 25% over 2021 levels.

Ford market manipulation?This thing looks EXACTLY like it did in 2011. Why? I have no clue. I suspect market manipulation, but I'm definitely keeping an eye peeled on this. I do believe this current rally gets faded on Ford, as its 2011 pattern would suggest, but eager to see how this plays out. Something is definitely up here.

Long. Closing above 13.75Ford should see some upside to around $15-16, according to the support and resistances

FThe bullish movement came as a result of the positive news that was issued on the 27th of July. Wait for the price to break the neckline of the head and shoulders pattern.
And this is after the formation of the right shoulder. As the price has already broken the descending rand line
So I expect it to reach the next levels
15.83
17.96
This is as a retest of the previous resistance area

F - Breakaway Gap (Time to hop on?)F's downtrend started to flatten out from mid June (trading between 10:65 - 12.45), eventually breaking above the "neckline" @ 12.45 on 19 July. It retested this neckline a week later and held, giving conviction that this previous "resistence" is now a new "support".
Today it gapped up on strong volume as earnings had surprised to the upside. It is likely that some people had been betting on a good set of results since recently. The uptrend is likely firmer now.
Nibbling @ current price and looking to add if there is any dip over the next few days. However, the gap @ 13.20 might not fill anytime soon (breakaway gaps usually signify the start of a new trend and do not get filled in the near term).
Disclaimer: Just my 2 cents and not a trade advice. Kindly do your own due diligence and trade according to your own risk tolerance and don't forget that money management is important! Take care and Good Luck!

7/27/22 FFord Motor Co ( NYSE:F )
Sector: Consumer Durables (Motor Vehicles)
Market Capitalization: 53.023B
Current Price: $13.19
Breakout price: $13.55
Buy Zone (Top/Bottom Range): $12.60-$10.90
Price Target: $14.80-$15.40 (1st), $17.90-$18.30 (2nd)
Estimated Duration to Target: 28-30d (1st), 70-74d (2nd)
Contract of Interest: $F 8/19/22 14c, $F 12/16/22 15c
Trade price as of publish date: $0.32/contract, $0.75/contract
