"Ford Stock: Indicators of Pullback and Points to Watch""Ford stock is currently experiencing a pullback; the level I marked with red, 11.77, and also a retreat down to the lower band of the channel could occur. I indicated areas for potential pullbacks in the two-day closings below the channel with green horizontal lines. It is advisable to be cautious."
"WARNING: THIS ANALYSIS IS NOT INVESTMENT ADVICE. CONSIDER YOUR RISK TOLERANCE AND FINANCIAL SITUATION BEFORE MAKING DECISIONS. FUTURE PERFORMANCE IS NOT GUARANTEED; THIS IS MERELY AN OPINION. INVEST PRUDENTLY AND CONDUCT THOROUGH RESEARCH."
F trade ideas

Ford - Daily Analysis and Why I love my job.. and this communityThank you to everyone who has followed, shown support of any kind with a boost or a message - I love doing this day in/day out and there's nothing I love more than people gaining from my experience and knowledge. So just a massive thank you to all who gain anything from my videos (and live streams) and I am excited to continue to build this community together with you all!
As for Ford, we could see our necessary buying algorithms being activated right now but will initially need to see orange more tapered acting as support and from there green stronger continuation holding price to break us out of yellow and magenta.
First things first, we need to break out of our current strong selling algorithm, Orange, in order to attempt a retest of yellow and magenta.
Please join me tomorrow at market open (9:30 AM EST) where I will be trading live on stream here on TradingView and taking trades, analyzing charts, and having fun with our awesome community.
As always, feel free to comment or DM me with any questions, thoughts, or requests of charts to analyze.
And most importantly (even though it's the weekend),
Happy Trading :)

Ford - At a key level that will determine: Breakout or DumpVideo explains it all! Hope this is helpful for any Ford bag holders (like myself) to reconsider upon its' next move.
Happy Trading :)

FORD long trade activated FORD has been showing strong bullish momentum in the last few weeks. and it is likely to continue.

IS THE AUTO INDUSTRY ABOUT TO CRASH? FORD TRENDS Uh, okay, so I have zero clue what is going to happen and I didn't see this until now, but if I was trading per my style, I'd be loaded up on puts where I circled. I WOULD THEN ABOSLUTELY LOAD THE BOAT on the retouch. Potentially down to $8 and then probably calls for a short term bounce, which would have me realizing profits quickly in order to keep risk down. I would then be waiting for the next signal.
It's getting so close to crash time per multiple indicators, potentially, according to short term trend alignment which is far from an exact science, however, it shows a small pump of pretty much up to maybe $11, but wow! There is a LOT of downside showing.
Any thoughts on this?
The crash projections say Late Feb/Early March
But this market is moving faster every day, which is outpacing a lot of older traders that aren't able to adapt.
I mean, there is no question it bounces back, but.. how long, and how much, and how fast?
I think there is room to return to nearly $20.
In other words, if it's March, and the price is at 3.83, and you are hearing doom and gloom on the news. BUY CALLS. I wouldn't cover shares, I think the pace will be quite fast on the return for a lot of these stocks.
All in all, if you're still with me, the whole point I'm trying to make is this next crash is a trap, leading into a pump, which will cause "THE BIG ONE"
Trends point to next year early, but the market is fast, and you need to reanalyze in real time, meaning, it could literally happen in the next few weeks. I don't know, you don't know. We can't predict the future of stock prices, but we can use the information we see to swing the statistics in our favor for a successful trade, even if that means being patient and waiting for the right entry.

F Ford Options Ahead of EarningsIf you haven`t sold F Ford before the previous earnings:
Then analyzing the options chain and the chart patterns of F Ford prior to the earnings report this week,
I would consider purchasing the 12usd strike price at the money Calls with
an expiration date of 2024-2-9,
for a premium of approximately $0.46.
If these options prove to be profitable prior to the earnings release, I would sell at least half of them.

Ford's Shift to Electric Vehicles Sparks Job Cuts in GermanyFord Motor Company (NYSE: NYSE:F ) has announced plans to streamline its operations, leaving a wake of job losses in its German plant. The decision, prompted by the company's strategic pivot towards electric vehicles, signals a seismic shift in the traditional automotive landscape.
Amidst burgeoning demand for electric vehicles, Ford ( NYSE:F ) has inked a deal with union representatives to slash approximately 2,700 jobs from its Saarlouis plant in Germany. This restructuring comes as Ford prepares to transition its electric vehicle production to Spain, leaving the Saarlouis facility grappling with an uncertain future.
The announcement, which follows Ford's earlier decision to assemble its next-generation electric vehicle in Valencia, underscores the profound challenges facing traditional automakers in adapting to the burgeoning electric vehicle market. With consumer preferences veering towards eco-friendly alternatives, automakers are compelled to realign their manufacturing strategies to remain competitive in an evolving industry landscape.
The ramifications of Ford's decision reverberate through the Saarlouis community, casting a shadow of uncertainty over the livelihoods of thousands of workers. The impending job cuts, slated to coincide with the cessation of Ford Focus production at the plant next year, signal a pivotal juncture for the region's industrial landscape.
Union officials, while acknowledging the inevitability of job reductions, have negotiated fiercely to mitigate the impact on workers. Under the agreement, around 1,000 jobs are slated for retention post-2025, with assurances against forced redundancies until 2032. This concerted effort aims to cushion the blow of the workforce transition and uphold the dignity of affected employees amidst the tumult of change.
Joerg Koehlinger, the district manager of IG Metall Mitte union, articulated the union's stance, stating, "After the best solution could not be realized, we opted for the second-best solution: to make job cuts as expensive as possible for Ford (NYSE: NYSE:F ). The result is impressive. Employees have the opportunity to leave the company through a very attractive program."
However, the fate of the negotiated agreement hangs in the balance as union members prepare to cast their votes in a pivotal referendum on February 22nd. Their decision will shape the trajectory of Ford's restructuring efforts and determine the contours of the social compact between management and labor.
In response to inquiries, a Ford spokesperson emphasized the company's commitment to navigating the restructuring process with sensitivity and transparency. "Subject to the formal steps for implementation, this marks an important milestone in the negotiations with the social partners on the social collective agreement, reconciliation of interests, and social plan that have been ongoing since last year," the spokesperson remarked. "A key component of these agreements is the planned gradual reduction of around 2,700 jobs through socially responsible, voluntary redundancy programs."
As Ford (NYSE: NYSE:F ) embarks on this transformative journey towards electrification, the repercussions of its decisions ripple far beyond the confines of corporate boardrooms, profoundly impacting communities, livelihoods, and the very fabric of industrial societies. The intersection of technological innovation and labor dynamics underscores the imperative for stakeholders to navigate this transition with empathy, foresight, and a steadfast commitment to safeguarding the welfare of workers amidst the winds of change.

Possible bullish exit in F ($F) after a long accumulationWe can see a medium-term accumulation marked in a large rectangle, a completely lateral zone. At the end you can see a False Breakout Down (FBD) and then a breakout up. I consider that we are going to experience an interesting bullish trade of approximately 30% until the zone of the smallest rectangle (14 - 15usd)
Your question does not bother.
---------------------------------------------
Spanish
Posible salida alcista en F ( NYSE:F ) después de una larga acumulación
Podemos ver una acumulación de mediano plazo marcada en un gran rectángulo, una zona completamente lateral. Al final se puede ver una falsa ruptura hacia abajo (FBD) y luego una ruptura hacia arriba. Considero que vamos a vivir una interesante operación alcista de aproximadamente el 30% hasta la zona del rectángulo más pequeño (14 - 15usd)
Preguntar no molesta.

Long Ticker Symbol FBounce of the 200ema. Price cross above 50 ema. Will trend continue? Will 20 ema cross above 50ema?

RiskMastery's Breakout Stocks - F EditionWelcome to RiskMastery's Breakout Stocks - Stocks with breakout potential.
In this edition, we'll be looking at NYSE:F ...
I believe this code is at a point of potential volatility.
If price can hold above $3.50 ... Bullish potential may be unlocked.
My key upside targets include:
- $5.70 (Conservative)
- $6.80 (Medium)
- $9.95 (Aggressive)
If however price falls below $2.70 ... Bearish risk potential may be unlocked.
(My key risk targets - C, M,& A - are as noted on the chart)
Enjoy, and I look forward to being of further service into the future.
If you'd like to connect, feel free to reach out and comment below.
Mr RM | Risk Mastery
Disclaimer:
This post is intended for educational purposes only - Publicly available RiskMastery information & content is not intended to be financial advice in any shape or form. Please do your own research and seek advice from a licensed professional before acting on any of the information contained within this post. This post is not a solicitation or recommendation to buy, sell or hold any positions in any financial instrument. All demonstrated trades are merely incidental to the educational training RiskMastery aims to provide. You are solely responsible for your own investment and trading decisions, of which should be made only according to your own opinion, knowledge and experience. You should not rely on any of the information contained on this site or contained in any RiskMastery material on any website or platform. You assume the sole risk of any trade or investment you elect to make. RiskMastery and affiliates shall not be liable to you for any monetary losses or any other damages incurred directly or indirectly, from your use, reliance or reference of RiskMastery materials, content and educational information. Thank you for your understanding and cooperation - We look forward to working with you into the future to navigate the fine line of trading and investment success.

Ford Motor (F, $11.72) (MACD) positive turned , January 31, 2024Ford Motor (F, $11.72) Moving Average Convergence Divergence (MACD) Histogram turned positive on January 31, 2024
This is a Bullish indicator signaling F's price could rise from here. Traders may explore going long the stock or buying call options. A.I. dvisor identified 44 similar cases where F's MACD histogram became positive, and 32 of them led to successful outcomes. Odds of Success: 73%.
F in upward trend: 10-day moving average moved above 50-day moving average on January 31, 2024
The 10-day moving average for F crossed bullishly above the 50-day moving average on January 31, 2024. This indicates that the trend has shifted higher and could be considered a buy signal. In 10 of 13 past instances when the 10-day crossed above the 50-day, the stock continued to move higher over the following month. The odds of a continued upward trend are 77%.
Technical Analysis (Indicators)
Bullish Trend Analysis
The RSI Oscillator points to a transition from a downward trend to an upward trend -- in cases where F's RSI Indicator exited the oversold zone, 20 of 30 resulted in an increase in price. Tickeron's analysis proposes that the odds of a continued upward trend are 67%.
The Momentum Indicator moved above the 0 level on January 29, 2024. You may want to consider a long position or call options on F as a result. In 55 of 82 past instances where the momentum indicator moved above 0, the stock continued to climb. The odds of a continued upward trend are 67%.
The Moving Average Convergence Divergence (MACD) for F just turned positive on January 31, 2024. Looking at past instances where F's MACD turned positive, the stock continued to rise in 31 of 44 cases over the following month. The odds of a continued upward trend are 70%.
F moved above its 50-day moving average on January 25, 2024 date and that indicates a change from a downward trend to an upward trend.
Following a +3.42% 3-day Advance, the price is estimated to grow further. Considering data from situations where F advanced for three days, in 205 of 297 cases, the price rose further within the following month. The odds of a continued upward trend are 69%.
Bearish Trend Analysis
The Stochastic Oscillator demonstrated that the ticker has stayed in the overbought zone for 3 days. The longer the ticker stays in the overbought zone, the sooner a price pull-back is expected.
Following a 3-day decline, the stock is projected to fall further. Considering past instances where F declined for three days, the price rose further in 50 of 62 cases within the following month. The odds of a continued downward trend are 68%.
F broke above its upper Bollinger Band on February 01, 2024. This could be a sign that the stock is set to drop as the stock moves back below the upper band and toward the middle band. You may want to consider selling the stock or exploring put options.
The Aroon Indicator for F entered a downward trend on January 30, 2024. This could indicate a strong downward move is ahead for the stock. Traders may want to consider selling the stock or buying put options.

inverted head and shoulders? Ford back to $15Possible inverted head and shoulders formation on Ford stock.
Get in while you can ya'll

Ford at a Crossroads: Assessing the Road Ahead for Investors
In the ever-evolving landscape of the automotive industry, Ford (NYSE: NYSE:F ) stands at a crossroads, grappling with challenges that have impacted its stock performance. While the last two months of 2023 brought about a commendable surge of over 20%, Ford's overall annual gain of 5% pales in comparison to the S&P 500's impressive 24% climb. Investors, however, remain cautiously optimistic, raising questions about the viability of Ford as a smart buy in the current market.
Challenges and Setbacks:
Ford's journey in 2023 was fraught with challenges, most notably a labor strike that temporarily led to the withdrawal of guidance. The estimated $1.7 billion earnings impact and an additional $8.8 billion in expenses over the life of a new contract have certainly raised eyebrows. The third-quarter results, missing Wall Street estimates, further underscored the difficulties faced by the automaker. Macro headwinds, such as higher interest rates, added to the complexity of an already tough environment for the industry.
EV Ambitions and Setbacks:
In the face of adversity, Ford pinned hopes on its electric vehicle (EV) ambitions, exemplified by the Model e. Despite a 26% revenue climb in the last quarter, weaker-than-anticipated demand prompted a delay in approximately $12 billion of EV-related investments. This strategic move, however, raises concerns about Ford potentially lagging behind competitors in the rapidly evolving EV market.
Evaluating the Bigger Picture:
Amidst these challenges, a critical analysis of Ford's long-term investment potential comes into focus. One prominent argument against including Ford in one's portfolio is the absence of an economic moat. Despite its household name status, Ford competes in a crowded market with numerous auto brands, limiting the influence of its brand name on financial performance.
The lack of scale advantages and consistently low operating margins present additional hurdles. Ford's mass-market approach, while ensuring widespread accessibility, requires continuous heavy capital investments in manufacturing capabilities, workforce maintenance, advertising, and research and development. Warren Buffett's disapproval of such capital-intensive requirements, especially in inflationary times, adds weight to concerns about Ford's investment appeal.
Shareholder Returns and Valuation:
Examining Ford's track record of shareholder returns over the past decade reveals a total return of 19%, inclusive of dividends. This figure, however, pales in comparison to the S&P 500 index, which would have more than tripled your investment with a 213% total return. While Ford's current price-to-earnings ratio of 7.6 might be alluring to some investors, skeptics argue that the cheap valuation alone is not reason enough to expect market-beating returns in the long term.
Conclusion:
Ford's journey in 2023 has been marked by both challenges and moments of optimism. As investors weigh the company's prospects, the absence of an economic moat, lack of scale advantages, and historical underperformance in shareholder returns raise valid concerns. While the stock's recent surge may inspire hope, the cautious investor may find themselves hesitating to embrace Ford as a compelling long-term investment in the dynamic landscape of the automotive industry. As the company navigates the road ahead, only time will reveal whether Ford can successfully address these challenges and emerge as a resilient player in the market.

Ford Motor's Resilience in 2023: Navigating Problems & Prospects
Ford Motor has emerged as a resilient force, reporting its best annual auto sales in the United States since 2020. The Detroit automaker's success in 2023 can be attributed to sustained demand for its crossover SUVs and pickup trucks, reflecting the prevailing trend of American consumers favoring larger vehicles for their safety and utility.
A Year of Triumph Despite Headwinds:
1. Robust Sales Performance:
Ford Motor's vehicle sales witnessed a notable uptick, rising by 7.1% to 1.99 million units in 2023. While this figure represents a slight dip from the 2 million units achieved in 2020, it signals a commendable rebound in the face of market challenges.
2. Consumer Shift to Larger Vehicles:
The American automotive landscape has seen a distinct shift towards larger vehicles, such as crossover SUVs and pickup trucks, at the expense of sedans and hatchbacks. Ford's strategic emphasis on these segments aligns seamlessly with consumer preferences, contributing to its robust sales performance.
3. Electrification Success:
Ford's foray into the electric vehicle (EV) market has proven successful, with sales of its EV models, including the F-150 Lightning pickup truck and Mustang Mach-E crossover, surging by nearly 18% to 72,608 units. The company's EV models now account for a noteworthy 3.6% of its total sales, showcasing a growing appetite for electrified options among consumers.
4. Hybrid Momentum:
In addition to its electric offerings, Ford's hybrid vehicle sales experienced a remarkable growth of more than 25%, reaching 133,743 units and constituting about 7% of its total sales. This signals an effective dual-strategy approach by the automaker, catering to both electric and hybrid preferences in the market.
Industry Dynamics and Challenges:
1. Market Trends:
The broader U.S. new vehicle sales market concluded the year at around 15.5 million units, with electrified vehicles, including hybrids, making up nearly 17%. This underscores the industry's gradual shift towards cleaner and more sustainable transportation options.
2. Consumer Caution Amidst Interest Rates:
Analysts have raised concerns about the potential impact of high-interest rates on consumer appetite for new vehicles in the future. Ford's ability to navigate this challenge will be critical, as economic factors continue to play a pivotal role in shaping the automotive landscape.
Ford's Market Position and Technical Analysis:
Market Standing:
Despite the challenges, Ford Motor solidified its position as the third-largest automaker by sales in the United States, trailing behind industry giants General Motors and Toyota. This underscores Ford's enduring presence and competitiveness in a dynamic market.
Technical Analysis
While the stock has faced challenges, breaking through support at $11.70, it is essential to note that Ford has broken the ceiling of the falling trend in the medium long term. This suggests a slower initial falling rate, and an established break predicts a further decline.
Conclusion:
In summary, Ford Motor's performance in 2023 showcases resilience, adaptability, and strategic foresight in navigating an ever-evolving automotive landscape. The success in the sales of larger vehicles, coupled with a strong showing in both electric and hybrid segments, positions Ford well for the future. However, the company must remain vigilant amidst economic uncertainties, particularly concerning interest rates, and continue to innovate to stay at the forefront of the rapidly changing automotive industry. As consumers increasingly embrace sustainable and technologically advanced options, Ford's commitment to electrification could be a key driver of its future success.

fordif we see the picture we will find a gap between 11.28 11.49 and a lot of support like ema 100with blue color and ema 50 with orange color
so can begun accumulate in this area zone
targets are
12.10$
12.50$
12.87$
13.20$

Ford Motors: Bearish Rejection of Previous .618 Support ZoneFord Motors in the face of continuously Rising Debts and Negative Free Cash Flows has been rejected from the 61.8% Fibonacci retrace, which previously acted as support and now seems likely to continue down significantly. If I were to target how low I think it could go, I'd say $8.65-$6.00 seem like likely targets.

Short in Ford
"I have recently initiated a short position on Ford stock as the price has reached a significant supply zone. Through comprehensive technical analysis and market observation, I have identified this zone as a key resistance level where selling pressure is expected to intensify, potentially leading to a downward price movement.
This trading decision is based on the belief that the price will decline as the supply exceeds demand within this zone. Furthermore, I have observed additional bearish indicators that support my decision to take a short position.
As a diligent trader, I will closely monitor the price action, market sentiment, and relevant fundamental factors to effectively manage my position and make necessary adjustments as the trade progresses. Implementing a robust risk management strategy is crucial to safeguard my capital and optimize potential profits.
Please note that trading stocks, including Ford, involves risks, and careful consideration is essential. I highly recommend conducting thorough research, developing a sound risk management plan, and, if necessary, seeking guidance from a qualified financial professional before making any investment decisions.
Kindly note that the above text is for informational purposes only and should not be considered as financial advice. It is always advisable to seek professional advice and conduct thorough analysis before making any financial transactions."

FORD stops building Electric CarsSaw this coming last year just by looking at the technical analysis. Remember that the "fundamentals" and bundled into the Technicals.

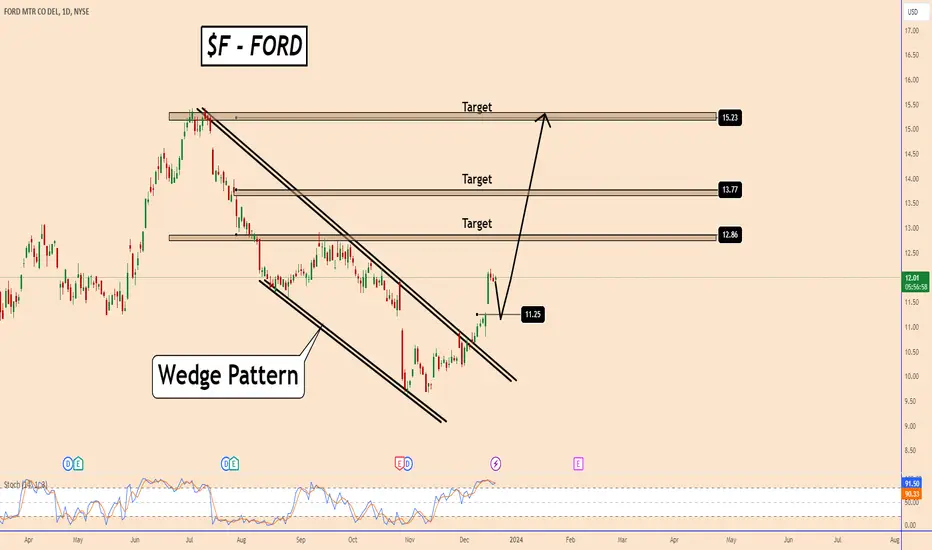
FORD: Time To Recover The Lost ValueFORD: Time To Recover The Lost Value
I will share with you only the technical outlook for NYSE:F -FORD.
The price reached $9.6 at the end of October 2023.
This area was very old and was last tested in January 2021 or almost 2 years ago.
The price broke out of a large daily wedge pattern and looks set to recover again.
Even if the price tests 11 - 11.50 the picture already changed and NASDAQ:FORD price should rise again.
The correction moment is supported also by the Stochastic indicator which is showing for overbought conditions.
However, the price may also continue to rise from the market price.
You may find more details in the chart!
Thank you and Good Luck!
Ticker symbol -F- up trend.Double bottom. Gap fill. trend brake out . What's next will ticker symbol -F- continue up or will it break down?

F LongFord has been respecting the pitchfork and is in a great buying zone. 15% stop but the R:R is around 8:1. Small size with the stop just outside of the previous low. Could very possibly be an edge of the market here and if it turns out to be so we will have caught the next trend at its earliest stage.

F - Is it going to be a good Christmas with Ford?
Is it time for a reversal for NYSE:F ?
Since early 2022, Ford's Price Performance has not been pretty good for their investor.
In the recent stages, the price has formed a consistent Downtrend Channel since July 2022.
Potential Bullish Divergence from its weekly chart MACD Oscillator might hint us at a reversal but surely need trend reversal confirmation from the daily chart.
If the price cannot break $10.64 as its neckline in an imaginary double bottom potential, then we need to at least see any bullish divergence potential in the daily chart from the oscillator.
For bullish divergence to appear, the price needs to go lower than $9.63 but the oscillator keeps making a higher low.
If the price can break $10.64, the nearest target is the double bottom pattern target at $11.61
You may also manage your risk for entry when the price breaks the minor downtrend as shown in the picture below:
Performance-wise, in the last 20 years, December only has a 40% rate of Positive Return with only a 20% winning rate in the last 10 years.
There are still 2 weeks in November, and it has 67% winning history since 20 years ago and 73% winning history in the last 10 years.
I'd probably go Long for this opportunity until the end of November 2023.

Ford gonna dump i thinkford stock not gonna do so great. sales are slumping, trucks are sitting on lots for longer than 300 days. union wages just went up. ev credit of $7,500 is gonna end going into Jan 2024. mustang is slated to be stopped in 2028. big f
