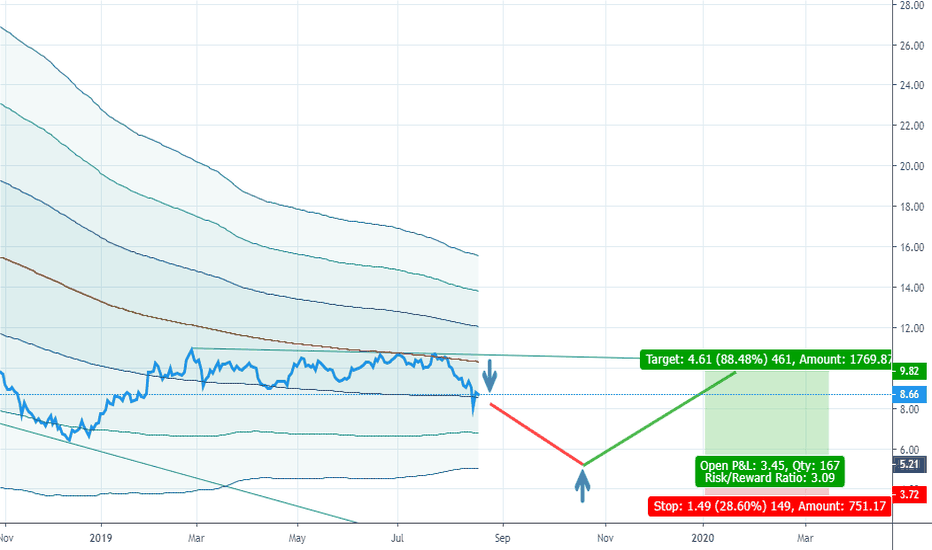
Fib If anyones interested in learning how we nailed GEs lows or crude lows and how weve rode gold up the last many months, im doing a free trading room to go into my work. Its all free. Theres no upell or get you guys to buy something. Its all free. Heres the link if your interested..https://t.co/jKmsptaYcI?amp=1 hope to see you guy there
GE trade ideas
First FDA clearance for AI X-ray systemGE's (GE +1%) health unit has won FDA approval for a new artificial intelligence-powered X-ray device that reduces the time to diagnose and treat a collapsed lung from eight hours to as little as 15 minutes.
The device, called the Critical Care Suite, uses AI algorithms to scan X-ray images and detect pneumothorax, which affects approximately 74K Americans each year.
GE is also working to enhance the technology to detect other health conditions.
source
For more analysis and articles visit our website.
GE - Share prices approaches 9.40 targetGE share prices have reversed the trend to the upside but still, need to maintain its trading activities above 8.75 to proceed to its next target at 9.40. A break above 9.40 could see share prices continue to 9.75 and 10.00. Share prices could head down to 8.40 if it drops below 8.75
GE ShortWe will enter a short position once the gap at $9.03 fills. Then the stop will be above an extremely important supply/demand zone and the target is about $0.67 Yep, we're looking for an Enron. If we get stopped out, we'll just look for another entry opportunity with price confirming our fundamental bias - most likely on a breakdown of the S/D zone. Imagine what GE collapse will do to S & P 500!
Lifetime opportunity, soon Bankruptcy, short with PUT options!!It's time to talk about the story of a decade!
It is now clear, that General Electric has been cooking it's books for years now!
Says Harry Markopolos, a legendary whislteblower, who runs a finical fraud detection company, famous with him exposing Bernie Madoff and his Wall Street firm Bernard L. Madoff Investment Securities LLC, a hedge fund that turned out to be a giant Ponzi Scheme!
The company is allegedly lacking 39 billion in cash, that being a conservative estimation, covering up it's losses with sophisticated accounting and it's organizational structure!
I am long PUT options on the 2.00-1.5 level with 4-6 moths expiration, and will be adding to the portfolio each month!
When the company announces it's bankruptcy the stock price will go below the mentioned levels, ideally to a couple of cents per share!
A MASSIVE opportunity with 1:100/ 1:300 returns, as the put options on these levels are currently worth almost nothing!
even if the odds of it going bankrupt is 1:2, the risk return ratio is just mind blowing!
It is important to note, that I am taking 4-6 months as an average for the previous cases of such fraud detection, like Enron and WorldCom, which both went bankrupt within 4 moths after the exposure!
S NYSE:GE o I am just being on the safe side here, being up put options with further expiration each month!
It does not matter how the stock's price behaves during these 4 months.If it goes up, take it as the opportunity to double down on your PUTS position.


