BlackRock Bitcoin ETF Could Be Finishing A CorrectionBlackRock Bitcoin ETF with ticker – IBIT looks like a nice and clean A-B-C correction that is right now sitting at interesting support area for A=C, but to confirm support in place and bulls back in the game, we need to see sharp or impulsive recovery back above 36.43 level.
IBIT trade ideas

$IBIT: Bitcoin's next leg up is hereBrace yourselves!
Oh, and go long if not long.
Best of luck!
Cheers,
Ivan Labrie.

Bitcoin ETF Breaking Support#Bitcoin NASDAQ:IBIT ETF is now a not touch until its back above that $34.50/$35 zone.
Down to test that $30 support zone is on the table.

$IBIT - Looks attractive for a starter postion.NASDAQ:IBIT is at 50% Fib retracement and lower trendline of the channel. The risk is a drop to $29 area. I am taking a starter position here and will add again around $29.
The selling will eventually dissipate. If nation states start holding bitcoins as a reserve currency, the price could quickly double from here.

IBIT - IdeaHey Guys,
Just wanted to show a chart / Idea for possible bounce areas.
I would like to see a break of the trendline to think about going long.
Thanks for reading…

Continuation Pattern on BitcoinNASDAQ:IBIT #bitcoin weekly chart.
Continuation inverse head and shoulders makes this one to watch in the coming couple weeks or so.

BTC ETF: If you had been holding off from buying, now's the timeI'm positive the post ETF selloff is over, AMEX:GBTC redemptions slowing down for 3 days, and 4h is showing a bullish Time@Mode pattern. (also forming in spot #BTC)
Low risk entry here, I favor NASDAQ:IBIT personally, but ETF selection is up to you.
Best of luck!
Cheers,
Ivan Labrie.

Asset Managers are looking at IBIT - Bitcoin thoughts - May 2024Sentiment seems to be that the cycle top is in. I disagree. The bitcoin ETFs are now opening up Bitcoin exposure to hedge funds and asset managers managing trillions of dollars, You have to ask yourself at this point, what is the likely hood that bitcoin has topped before the halving and now ETFs have opened the flood gates. I think very unlikely the bull market ends here.
NASDAQ:IBIT

Ibit bullish supply zoneI think here ibit its very bullish from here but also its too much risky anyway this with Hong Kong etf maybe can force the market price to go up

👀WATCHLIST: WED 03APR24Here is my watchlist of stocks I am adding today:
NASDAQ:APPF
NASDAQ:GIFI
NASDAQ:IBIT
MARKET GAUGE: 🟠CAUTION
I have been talking about softness in the market. However, if stocks are breaking out of good positions will entertain.

$IBIT April 3, 2024.NASDAQ:IBIT April 3, 2024.
For the rise from 28.91 to 41.99 NASDAQ:IBIT has taken support around 36.8 levels.
This is about 38.2% retracement for the rise and also 200 average support in 60 minute time frame.
Being a moving average follower I find 50,100 and 200 are all mixed up above 9 and 21 average.
Hence I expect a resistance around 38.5 levels today and support around 37 levels to be intact.
Because of gap strength comes only above 39.95 levels.
BTC next big move (trade IBIT)Hold zone 39.00 without more downside move - very good pattern for new ATH, but need Plan B - 0.5 Fib zone under like second try to put size. Let see

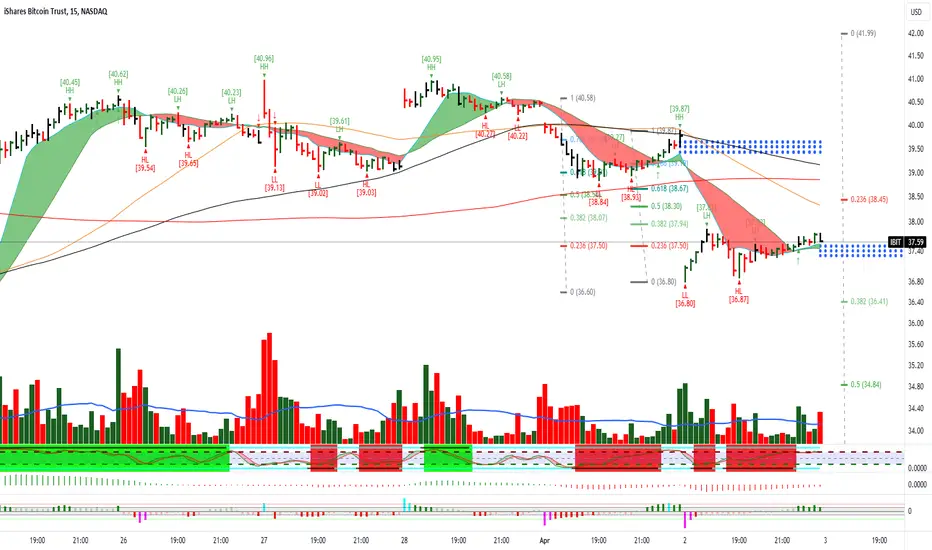
$IBIT March 26, 2024NASDAQ:IBIT March 26, 2024
60 Minutes
As expected 35 levels were held.
For the rise from 28.91 to 41.99 35 levels represented about 50% retracement value.
Now formed HL at 35.71 which becomes an important number to hold for the current uptrend.
Consider the fall from 41.99 to 35.41. NASDAQ:IBIT retraced 61.8% and managed to hold the gap up.
Now if we consider the rise from 35.71 to 40.62 holding 38.5 to 39 levels is important as it is a converging of averages 9,21,50 and 100.
Adding around t 38.5 -39 levels on a retracement today should be a good trade as risk is only 35 levels being 200 averages for a target 43 +

$IBIT March 21, 2024NASDAQ:IBIT March 21, 2024
15 Minutes.
For the rise from 28 to 41.99 levels NASDAQ:IBIT retraced 50%.
The LL at 35.41 made on Wednesday had oscillator divergence.
We have 39.4 levels as 200 averages. That should provide resistance for the current move.
That level is also 61.8 % retracement for the fall from 41.99 to 35.41.
For the day the rise from 35.41 to 37.69, 36-365 levels must hold for the uptrend target 39 - 39.5 levels.
$IBIT March 18, 2024NASDAQ:IBIT March 18, 2024
60 Minutes
Looks like HL, HH pattern is broken.
Also NASDAQ:IBIT too far from moving averages.
At the moment below 9,21 and 50 averages in 60 minute time frame.
I will consider 3 moves.
The rise from 28.91 to 41.99.
The rise from 34.03 to 41.99
The fall from 41.99 to 37.45
for the first rise NASDAQ:IBIT has retraced 23.6 levels. So up trend is intact.
For the second rise NASDAQ:IBIT has retraced 50% of the rise and needs to hold 36-37 levels to continue up trend.
For the fall from 41.99 to 38.45, it retraced to 40.32 which is around 61.8% retracement for the fall.
So buy is only above 42 levels.
Today must cross 41.3 levels to continue up trend. Else I will short around 40.5 levels.
I expect a consolidation this week between 36 to 41 levels so the moving averages can catch up.

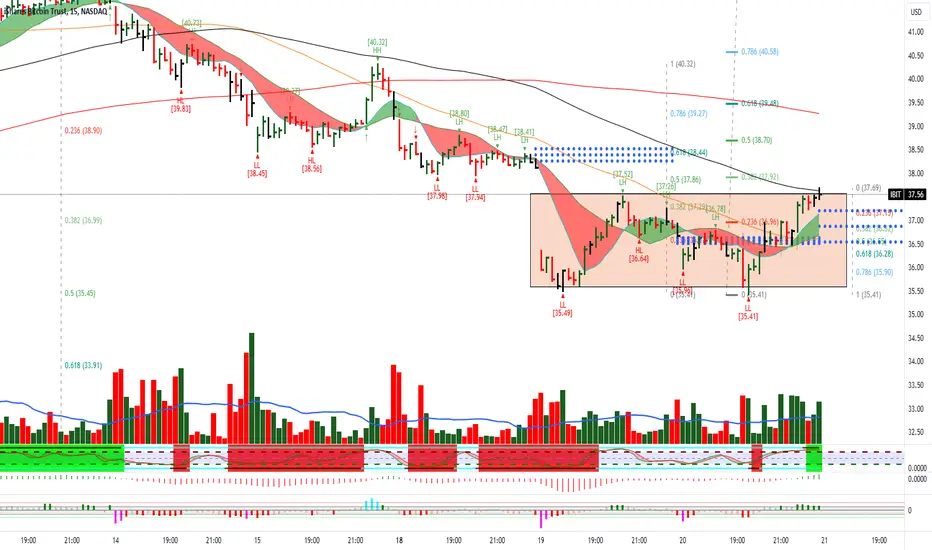
$IBT March 15, 2024LSE:IBT March 15, 2024.
15 Minutes.
NASDAQ:IBIT retraced back to 200 averages in 15 minutes time frame.
For the rise from 34.03 to 41.99 NASDAQ:IBIT has retraced to 38.2 levels.
And for the rise from 37.77 to 41.99 it had retraced more than 61.8%.
So holding 39 resistance can be expected around 41-42 levels.
On the downtrend i expect 37 as a target initially which is 61.8% retracement for the larger rise and 100 average in the 60-minute time frame too. Bias is towards 37 levels initially.
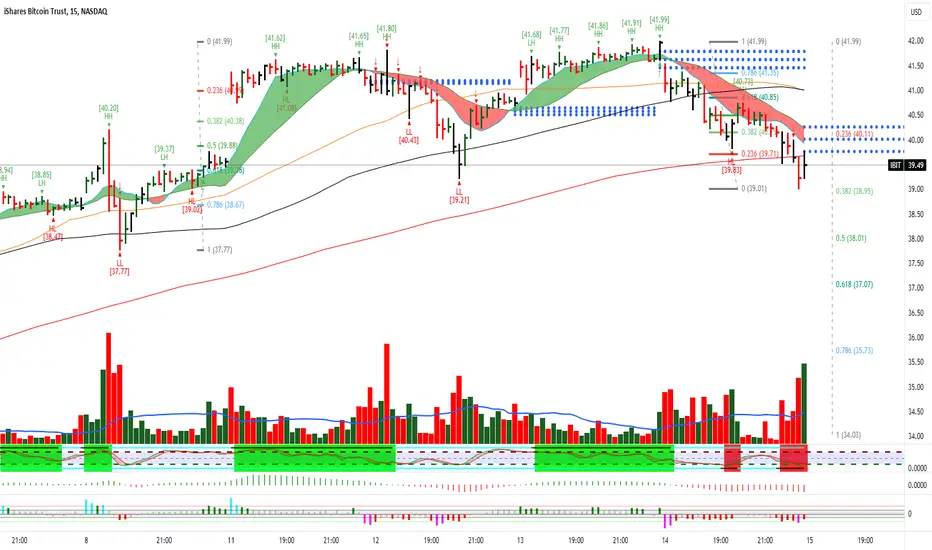
$IBIT March 13, 2024NASDAQ:IBIT March 13, 2024
15 Minutes
The gap was filled yesterday.
If we consider the rise from 37.77 to 41.8 then NASDAQ:IBIT retraced 61.8% of the move.
And for the fall 41.8 to 39.21, it has again retraced 61.8 of the fall.
For the day considering the last rise from 39.21 to 40.94 NASDAQ:IBIT has to hold 39.9 levels for 40-41 as a target.
More uptrend only above 41.8 levels.
I am long yesterday from 39.5 levels SL below 200 average around 38.6 levels.
It is a contra trade as per my setup as my buys are not supported by the Elliott oscillator or black bar on stochastics being on top or CCI green.
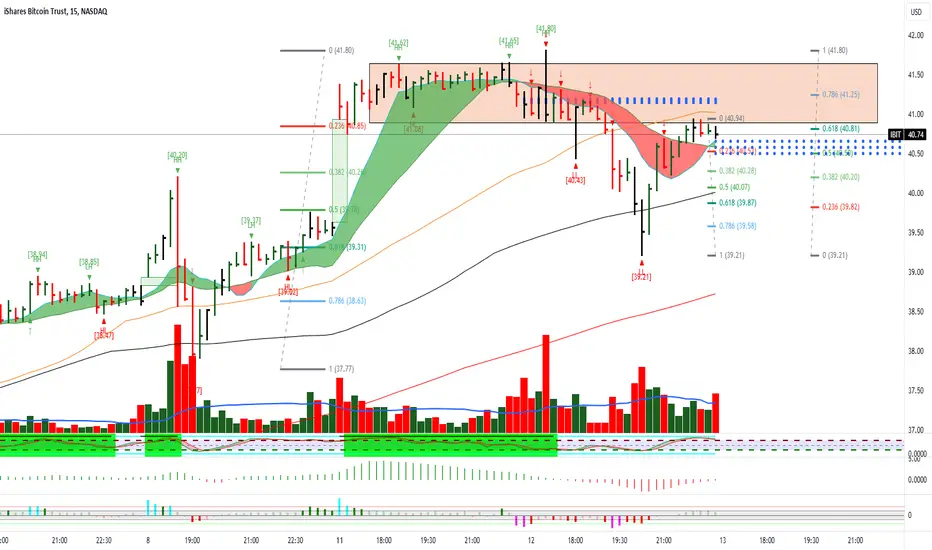
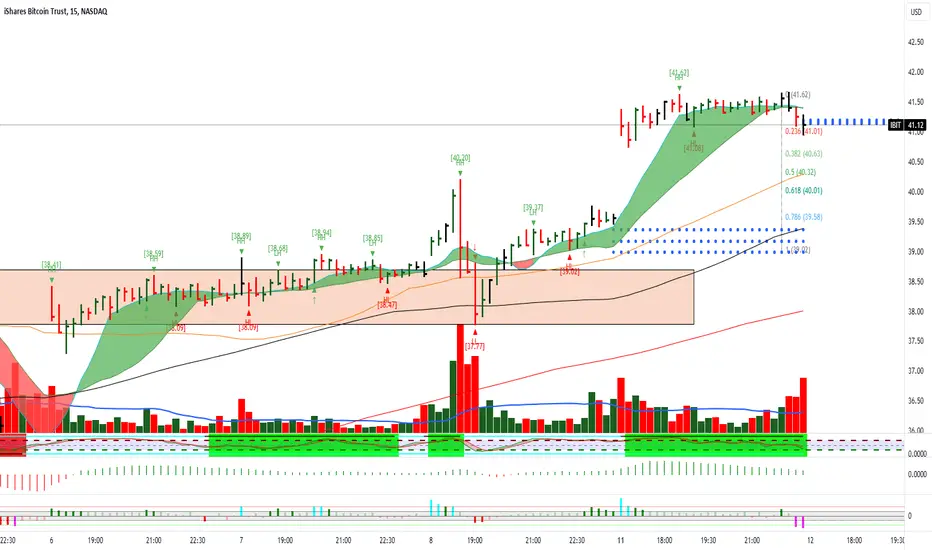
$IBIT March 12, 2024NASDAQ:IBIT March 12, 2024
Closed longs at 41.5 levels.
it was approximately 1.618 extension for the move from 37.77 to 39.37 to 39.02.
So far NASDAQ:IBIT consolidates or retraces to 50 averages.
So for the rise from 39.02 to 41.62, I expect a retrace today to 40.6 levels.
I have a next target as 43 levels if this retracement low is held.
Also if 39.5 is broken then the gap is filled which will lead to a fall in the current momentum on the upside. Then I expect some more consolidation before the next leg.
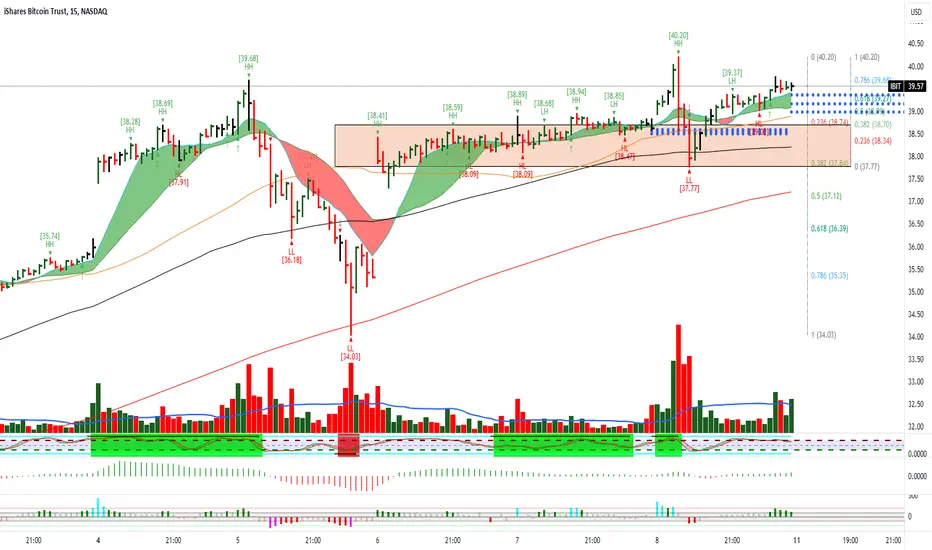
$IBIT March 11, 2024NASDAQ:IBIT March 11, 2024
As of now, the uptrend is intact. Broke the box. On retest took support at the bottom of the rectangle and now above box.
The sideways movement has given enough time for moving averages to catch up.
For the rise of 34.03 to 40.2 NASDAQ:IBIT retraced to 37.77 which is approximately 38.2% retracement.
And for the fall 40.2 to 37.77 NASDAQ:IBIT is around 39.6 well above 61.8% levels.
Holding 38.7 I expect the uptrend to continue for an initial target of 41.5 to 42.5 levels.
I am holding longs at the moment for 42+- 0.5 as targets.
IBIT ETFHello friends, as you know, on March 12th, the Federal Reserve's support for the banks is supposed to be removed, so this could be the beginning of Bitcoin's liquidation and a correction in Bitcoin.

$IBIT March 7, 2024NASDAQ:IBIT March 7, 2024
15 Minutes.
Yesterday we had sideways after a gap up open.
For the rise from 34.03 to 38.59, holding 36.5 levels uptrend continues.
I expect a correction as oscillator divergence is seen.
For the larger move from 29 to 39 we need to hold 35 levels being the 61.8 reteracement for the shorter rise 34.03 to 38.59, which is also 200 average sloping upwards.
Any upward movement for today I expect to be resisted around 40 levels allowing moving averages to catch up.

OMG BLACKROCK IBIT FEROCIOUS SELL-OFF Today ???But how can that be since according to most talking heads it's institution money doing the buying. If RETAIL & Institution(according to talking heads) money is being put into those newly listed ETF's, THEN WHO IS SELLING Such a chunk while supposedly financial institutions are buying???
According to my perspective, FUNDS are pouring RETAIL into Bitcoin while the SMART Institutional money is selling into demand!
Nice triangle suggested the next potential move was going to be forming into a potential top, and that's what price printed.
In my humble opinion.

IBIT short-term ideal based on BTC I’ve been looking at the trend bitcoin is taking and i think it may be exhausted and taking a breather… I also have been looking at crypto mining stock such as riot and Mara both developing a double top, and with the ascending triangle Btc has, i think it may actually move downwards to fill a gap, and push back up. Also the long tail on the red candle tell me people have selling sentiment at that level and it will give people the opportunity to get in. I’m new to posting my ideals but i’ve been at it awhile. Not finical advice, do your own due diligence.
